2nd International Conference on Intelligent Systems (ICIS'2013) July 20-21, 2013 Pattaya (Thailand)
Traffic management Congestion Control Scheme in ATM Networks Rupam Deb, Md Jashim Uddin, Md. Morshedul Islam, Jebunnahar, and Kazi Rafiqul Islam
II. LITERATURE REVIEW
Abstract— The problem of traffic management has been widely recognized as critical to the development of an operational Internet. The goal of traffic management is to efficiently allocated network resources including buffers and bandwidth and provides the negotiated QoS guarantees to users. Rate based Congestion control schemes promises effective traffic management for the ABR service class suitable to data communications in ATM networks. A rate based scheme uses feedback information from the network to specify the maximum rate at which each source can transmit cells in to the network on every VC. In this paper, we considered an efficient rate based congestion scheme, Explicit Rate Indication Congestion Avoidance (ERICA) for ATM networks. An improvement to ERICA scheme is proposed by varying the target rate dynamically.
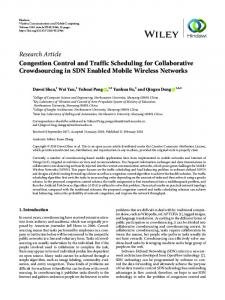
ATM networks offer five classes of service: Constant bit rate (CBR), real-time variable bit rate (rt-VBR), non-real time variable bit rate (nrt-VBR), available bit rate (ABR), and unspecified bit rate (UBR). Of these, ABR and UBR are designed for data traffic, which have a bursty unpredictable behavior [3, 4]. UBR service is simple in the sense that users negotiate only their peak cell rates (PCR) when setting up the connection. Then, they can send burst of frames as desired at any time at the peak rate. If too many sources send traffic at the same time, the total traffic at a switch may exceed the output capacity causing delays, buffer overflows, and loss. The network tries to minimize the delay and loss but makes no guarantees. The ABR service provides better service for data traffic by periodically advising sources about the rate at which they should be transmitting. The switches monitor their load and compute the available bandwidth and divide it fairly among active flows. The feedback from the switches to the sources is sent Resource Management (RM) cells which are sent periodically by the sources and turned around by the destinations. The RM cells are sent by sources after every 31 data cells. The RM cells contain the source’s current cell rate (CCR) and minimum cell rate (MCR). The RM cells also have several fields that can be used by the switches to provide feedback to the sources. These fields are: Explicit Rate (ER), Congestion Indication (CI) flag, No Increase (NI) flag. The ER field indicates the rate that the network can support at the particular instant in time. When starting at the source, the ER field is set to Peak Cell Rate (PCR). Also, CI and NI flags are cleared. On the path, each switch reduces the ER field to the maximum rate it can support. In certain cases, it can also set the CI and NI flags [8]. The sources monitor the returning RM cells and adjust their transmission rates as instructed by the ER, CI, and NI fields. The RM cells flowing from the source to the destination are called Forward RM cells (FRMs) while those returning from the destination to the source are called backward RM cells (BRMs). If a switch or destination becomes extremely congested, it may not want to wait for the next RM cell. They are allowed to generate a limited number of RM cells and send them immediately towards the source. Such RM cells are called “Out-of rate (OOR)” RM cells. The source generated RM cells are “in rate” RM cells because the bandwidth used by them is counted in the rate allocated to the source. Thus, if a source is allocated 32 cells per second, it can send 31 data cells and one RM cell per second (assuming NRM of 32). The out-of rate and in-rate RM cells are
Keywords— ATM network, Cell, Source end terminals, Bit rate, Digital network. I. INTRODUCTION
B
ROADBAND Integrated Services Digital Network (BISDN) with Asynchronous Transfer Mode (ATM) technology will offer multimedia communication, video on demand, live television, and high speed data transport and many other services. Asynchronous Transfer Mode technique is designed to provide fast packet (cell) switching over various types and speeds of media at variable rates from 64 Kbps to 2 Gbps and beyond. ATM networks provide good bandwidth, flexibility and can be used efficiently from desktop computers to LANs and WANs. Unlike other packet switching networks, ATM networks support both fixed and variable bandwidth services. One of the services provided by ATM networks is the Available Bit Rate (ABR) which was proposed for data applications to utilize the left-over bandwidth from other ATM traffic types [1, 2, 5]. Congestion control mechanisms are essential for the support of ABR service to provide efficient and fair bandwidth allocation among connections with vague Quality of Service (QoS) requirements. The congestion control is not only essential for regulating the traffic to prevent congestion, but also necessary to provide efficient and fair bandwidth allocation. In this thesis we considered ERICA congestion control mechanism for ATM networks [2, 6, 7]. Rupam Deb, Dhaka University of Engineering and Technology, Bangladesh Email Id:
[email protected] Md. Jashim Uddin, Blekinge institute of Technology, Sweden Email Id:
[email protected] Md. Morshedul Islam, Bangladesh University of Engineering and Technology, Bangladesh, Email Id:
[email protected] Jebunnahar, Shanto Mariam University, Bangladesh Email Id:
[email protected] Kazi Rafiqul Islam, Dhaka University of Engineering and Technology, Bangladesh, Email Id:
[email protected] 69
2nd International Conference on Intelligent Systems (ICIS'2013) July 20-21, 2013 Pattaya (Thailand)
distinguished by a BN (Backward Notification) Flag in the RM cells.
sources which can use it. For this purpose, the switch calculates the quantity: VC Share = Current cell rate/z If all VCs changed their rate to their VCShare values then, in the next cycle, the switch would experience unit overload (z equals one). Hence VCShare aims at bringing the system to an efficient operating point, which may not necessarily be fair, and FairShare allocation aims at ensuring fairness, possibly leading to overload (inefficient operation). A combination of these two quantities is used to rapidly reach optimal operations as follows: ER Calculated = Max (FairShare, VCShare) Sources are allowed to send at a rate of at least FairShare within the first round-trip. This ensures minimum fairness between sources. If the VCShare value is greater than the FairShare value, the source is allowed to send at VCShare, so that the link is not underutilized. This step also allows an unconstrained source to proceed towards its max-min rate. The previous step is one of the key innovations of the ERICA scheme because it improves fairness at every step, even under overload conditions. The calculated ER value cannot be greater than the ABR capacity which has been measured earlier. Hence, we have:
Fig. 1 Flow of Data and RM Cells
III. ERICA ALGORITHM The ERICA algorithm is concerned with the fair and efficient allocation of the available bandwidth to all contending sources. Like any dynamic resource algorithm, it requires monitoring the available capacity and the current demand on the resources. Here, the key “resource” is the available bandwidth at a queuing point (input or output port). In most switches, output buffering is used, which means that most of the queuing happens at the output ports. This, ERICA algorithm is applied to each output port (or link).
ER Calculated = Min (ER Calculated, ABR capacity)
A. Basic Algorithm: The switch periodically monitors the load on each link and determines a load factor, z, the available capacity, and the number of currently active VCs (N). The load factor is calculated as the ratio of the measured input rate at the port to the target capacity of the output link. z =ABR input rate/ABR capacity Where, ABR capacity =Target Utilization (U) × Link Bandwidth The Input Rate is measured over an interval called the switch averaging interval. The above steps are executed at the end of the switch averaging interval. Target Utilization (U) is a parameter which is set to a fraction (close to, but less than 100 %) of the available capacity. Typical values of target utilization are 0.9 and 0.95. The load factor, z, is an indicator of the congestion level of the link. High overload values are undesirable because excessive congestion; so are low overload values which indicate link underutilization. The optimal operating point is at an overload value equal to one. The goal of the switch is to maintain the network at unit overload. The fair share of each VC, Fair Share, is also computed as follows:
Since every output port is queuing point through which a VC passes, every source ought to send at no more than the ER calculated at its bottleneck queuing point. To ensure that the bottleneck ER reaches the source, each switch computes the minimum of the ER it has calculated as above and the ER value in the RM cell. This value is inserted in the ER field of the RM cell.