Traffic modelling and cost optimization for transmitting traffic messages over a hybrid broadcast and cellular network Jing Hu, Reinhard German, Armin Heindl, Ronald Kates and Matthias Unbehaun Abstract— Broadcast networks are typically used for distributing common information (music, data) to many users within a given service area, while cellular networks provide point-to-point voice or data delivery to individual users. The fundamental difference from an economic point of view is that cellular networks follow a ’pay-per-use’ paradigm with ’per minute’ or ’per kByte’ charges, whereas commercial broadcast services (e.g. Pay-TV) are charged for by long-term (months or years) subscriptions. In this paper, we investigate a hybrid system for carrying traffic information services. It comprises a data broadcast network for providing the base capacity and a cellular network for carrying the peak traffic exceeding this base capacity. Cellular capacity for the excess data traffic can be purchased whenever needed. However, capacity in broadcast networks is typically leased for long periods of time (potentially several years) at a fixed price. The key problem is how to choose – depending on the statistic properties of the input data traffic – the fixed broadcast capacity such that the overall operation cost for the hybrid network is minimized. Results for a telematics service delivering traffic information show that indeed considerable cost savings can be achieved by carefully balancing the capacity allocated in the broadcast network against the peak traffic redirected through the cellular network. The simple analytical model proposed to aid in this tradeoff is validated by simulations.
I. I NTRODUCTION Road traffic is continuously growing, resulting in more frequent and more severe traffic jams. Information about such events, together with an increasing amount of safety-related information (e.g. ice, snow, fog, oil spills, hazardous goods vehicles), is gathered in many countries and either announced during the radio program, broadcast using RDS-TMC [1], or sent via cellular networks [2]. The disadvantage of RDSTMC is its very limited capacity of about 100bps for traffic information. Using cellular networks, every message must be sent to each individual customer, making it a quite expensive solution if many users are to be informed. J. Hu was at the time of this writing student at the University ErlangenNuremberg, 91058 Erlangen, Germany, and did pursue her M.Sc. thesis at the Department of Science and Traffic Policy, Traffic Technology, at BMW Group, 80788 Munich, Germany, e-mail: jingg
[email protected]. R. German is head of the Department of Computer Networks and Communication Systems at the University Erlangen-Nuremberg, 91058 Erlangen, Germany,
[email protected]. A. Heindl is with the Department of Computer Networks and Communication Systems at the University Erlangen-Nuremberg, 91058 Erlangen, Germany,
[email protected]. R. Kates works as a scientific consultant for the Department of Science and Traffic Policy, Traffic Technology, at BMW Group, 80788 Munich, Germany,
[email protected]. M. Unbehaun is with the Department of Science and Traffic Policy, Traffic Technology, at BMW Group, 80788 Munich, Germany,
[email protected].
Recently deployed digital radio systems, such as Digital Audio Broadcasting (DAB) [3], provide much higher bandwidth than RDS-TMC and are therefore well suited for carrying traffic information data. Such digital radio systems can also be combined with cellular networks to form an asymmetric hybrid system [4], where the cellular part provides the uplink and the broadcast network the downlink. However, in this paper we consider a hybrid system without uplink channel, i.e. clients cannot explicitly request information from a central server. Instead, information is continuously distributed whenever some traffic incident occurs. Client devices could be car radios, navigation systems, portable or handheld computers – any device with a built-in digital radio receiver. A common property of such devices is that they are not continuously switched on, but instead operated only at certain, randomly distributed time instants. This precludes the use of intelligent caching strategies [5]. Hence, all relevant messages must be cyclically broadcast using a so-called broadcast carousel such that a client, which is switched on at a random time instant t0 , can receive any of the transmitted messages within some maximum time interval τ < τmax , where τmax is a Quality-of-Service (QoS) metric. The time interval during which one and the same message is periodically broadcast depends on how long the circumstances for that particular event (e.g. a traffic jam) remain unchanged. Whenever some new information (an update) about that event is available (the length of the traffic jam changes), the original message is replaced by a new version. Only when the event disappears (the traffic jam dissolves) is the message removed from the broadcast carousel. This may seem trivial in the case of the broadcast system. However, it has important consequences for cellular networks, where each of u updates must be sent to all c client devices, causing an u × c-fold increase in communication costs. The advantage of cellular systems is that messages or updates need to be sent only once per customer, instead of being repeatedly sent for the duration of the event, as it is the case for broadcast networks. Generally, broadcast is more efficient for distributing this type of one-to-many information if a large number of customers should be serviced. However, the allocation of capacity is very inflexible: broadcasters typically purchase fixed amounts of spectrum (kHz) or capacity (kbps) for periods of several years. Fluctuations in the amount of data traffic to be broadcast thus require purchasing enough capacity to accommodate any peak traffic rate that may occur, leaving much of the broadcast capacity unused during the
180
160
140 Average number of traffic messages
remaining time. In this paper, we seek to combine the properties of cellular and broadcast networks to form a hybrid system, where the base data traffic is carried over the broadcast network, and temporarily occurring excess traffic is sent through the cellular network. The optimization problem to be solved in this scenario is to identify how much broadcast capacity should be purchased (fixed over a long period of time) such that the overall operation costs of the hybrid network are minimized.
120
100
80
60
II. S YSTEM M ODEL
40
We consider the following system model: Services are clustered in three service classes A, B and C, where A represents traffic messages with high priority (accidents, sudden fog, ice or heavy rain, etc.) which should be received within seconds. Messages of priority B (traffic jams, slowly changing weather conditions, etc.) are important, too; however, a delay on the order of tens of seconds is assumed tolerable. Priority C messages inform about static events, e.g. road construction sites, which tolerate delays of several minutes. We assume the following distribution for the service classes: messages of type A, B or C occur with a probability Pr{A} = 0.2, Pr{B} = 0.3 and Pr{C} = 0.5 respectively. This assumption is supported by empirical data. We were fortunate to have access to a database of recorded traffic messages for Germany during the year 2003. Besides, supplementary information e.g. from [6] and [7] was included in the considerations. The maximum tolerable latency for the service classes A, B and C is τA = 20s, τB = 60s and τC = 120s respectively. We consider this a reasonable assumption in the context of providing timely notice and warnings while driving at highway speeds. All messages have a length of L = 1000 bits. We assume an error-free reception of messages, which can be achieved by adding sufficient redundancy (Forward Error Correction, FEC) for recovering transmission errors. The resulting net data rate after channel decoding is denoted R.
20
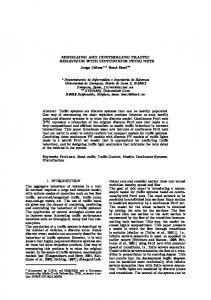
A. Estimation of Message Traffic In realistic applications, the total number of traffic messages at any given time instant will depend on various factors, such as the following: • Time of the day: traffic typically shows distinct morning and evening rush hour periods; • Day of the week: Fridays are the busiest, Saturdays and Sundays the quietest days of the week; • Vacation periods and public holidays: at the beginning and the end of such periods, heavy traffic causes more queues and typically also more related accidents; • Season: during winter, more traffic accidents happen and more cases of ice, slippery road or fog need to be reported. One conceivable approach to the problem of estimating the message traffic would be to construct an explicit analytical
0
0
2
4
6
8
10 12 14 Hour of the day
16
18
20
22
(a) 120
Average number of traffic messages
100
80
60
40
20
0
Mon
Tues
Wed
Thur Day of the week
Fri
Sat
Sun
(b) Fig. 1. Average number of traffic messages per day (a) and per week (b) in Germany for the year 2003.
model for message generation depending on all relevant factors. This is a complex problem, particularly considering the range of applications and influences. For our purposes, capturing the statistics on the frequency of such traffic messages with reasonable accuracy is sufficient. To this end, we can simplify the problem considerably by applying an appropriate statistical fitting procedure to the aforementioned empirical database of recorded traffic messages in Germany in 2003, which was well-suited for illustrating this approach. Figure 1 shows the results of averaging the traffic messages over different time scales. The morning and evening rush hours are clearly distinguishable in Figure 1 (a). Averaged over all weekdays, the difference between working days and weekends is evident from Figure 1 (b). Fluctuations in daily traffic message rates during the year are omitted, because varying school vacation periods in the different federal states make them somewhat specific for Germany.
Weibull Probability Plot 1
0.999 0.99
0.8
0.75
τavg = 120s Probability density function (PDF)
Cumulative distribution function (CDF)
0.96 0.90
0.50
0.25
0.10 0.05 Weibull fit
Data samples
0.6
τA = 20s τB = 60s τC = 120s
0.4
0.02 0.2
0.01
τavg = 40s
0.003 2
5
10
20
50
100
200
500
Number of messages
0
0
1
2
3
4
5
Data rate U [kbps]
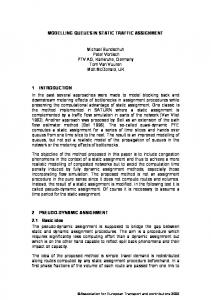
Fig. 2. Weibull fitting of traffic message statistics (number of messages per hour) – cumulative distribution functions (CDF)
Fig. 3. Probability Density Function (PDF) of the data rate U, generated from the Weibull fitting parameter set.
As a first approach, we use the Weibull distribution for the statistical fitting of the number of messages per hour, as it is quite manageable, but still provides sufficient degrees of freedom for capturing complex statistical processes, especially those related to failures. In order to reduce the computational complexity of the fitting process, data are aggregated to 1hour intervals (T0 = 1h). Simulation results showed that using a finer granularity did not significantly improve the results of the statistical fitting. Figure 2 compares the original data with the fitted cumulative Weibull distribution, as obtained from the weibfit function of MATLAB [8].
The underlying assumption in Equation (1) is that a scheduling algorithm exists, which arranges messages in the broadcast carousel in a way such that an equal spacing of messages with intervals of exactly τ{A,B,C} is guaranteed for each class respectively. Equation (1) can now be used together with the Weibull parameter set derived from the fitting in Figure 2 for analytically calculating the distribution of broadcast traffic. Figure 3 shows the probability density function (PDF) of the message distribution scaled with the cumulated traffic of the sampling period (year 2003) for the service set ABC introduced at the beginning of Section II.
B. Modelling of the Data Broadcast Cyclic data broadcasting is fundamentally a tradeoff between latency (the average waiting time before a message has successfully been received, i.e. the user-perceived QoS) and capacity (the data rate allocated for the service and the resulting operation costs). Given a fixed capacity, broadcasting more messages results in a larger data carousel and hence larger time intervals between consecutive repetitions of the same message. Vice versa – given fixed repetition intervals, broadcasting more messages requires more bandwidth. First, we disregard the problem of how to actually schedule the messages in a broadcast carousel and calculate the data rate U (observed in an arbitrary 1-hour interval) from the distribution of the number of messages N (see Subsection IIA), their length L and their frequency of occurrence in the broadcast carousel 1/τ{A,B,C} , by ´ ³ NB NC A + + ·L U = N τ τ τ B C ³ A ´ (1) Pr{A} Pr{B} Pr{A} = ·L·N . + + τA τB τC Note that the probabilistic occurrence of messages of the three traffic types (N{A,B,C} in numbers) allows limiting ourselves to fitting a single distribution, namely that of N .
C. Influence of the Service Parameters on the Traffic Load The choice of parameters for the service classes has an impact on the traffic load and the shape of the resulting PDF. Tighter latency requirements cause more traffic, since messages need to be retransmitted more frequently and thus consume more bandwidth. However, due to the assumed lossless scheduling of messages, we can disregard the specific partitioning of service classes and their individual latency requirements when calculating the excess traffic. Instead, we use the latency averaged over all service classes: τ = τA Pr{A} + τB Pr{B} + τC Pr{C} = 82s. The service set ABC would thus be equivalent (with respect to generated traffic load) to a single service with τ = 82s, or any other combination of services, as long as the resulting average latency τ is identical. Besides the PDF for service set ABC, Figure 3 shows the PDFs for message sets with τ = 40 and τ = 120s. Note that changing τ is essentially a proportional scaling of the distribution and has no influence on the underlying statistical characteristics. Generally, the shorter the required latency, the longer extends the tail of the PDF, indicating an increased probability of high data rate excess traffic.
100
D. Estimation of Excess Traffic
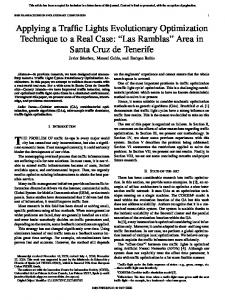
We will therefore refer to R as cut-off rate. Note that U denotes the number of bytes transmitted per hour in the data carousel. Therefore, the integral is multiplied by τ to account for the repetitions in the broadcast carousel. No repetition (i.e. cyclic broadcast) is required in a cellular network, over which the data volume estimated by E is redirected1 . Though, in a cellular network, each user must be addressed individually and therefore the number of users Nu becomes an important factor in calculating the overall system operation costs in Section III. In order to verify the results obtained from Equation (2), we plot the estimated excess traffic E against simulation results, where the number of messages that do not fit in the broadcast channel has been counted numerically for each hour over the entire sampling period. This simulation implements a broadcast carousel as proposed in [9], where an onthe-fly scheduling algorithm is developed. The term on-the-fly means that the broadcast carousel is compiled dynamically, i.e. messages can enter and leave the message queues at any time without the need to recompile the complete broadcast carousel each time. The algorithm in [9] aims at minimizing the overall mean access time for an arbitrary message. For more details on the MATLAB simulation, the reader is referred to [10]. The results in Figure 4 show that the estimated excess traffic E overestimates the simulated results. The reason for that is found in Figure 5, which shows a zoomed view of the upper right corner of the Weibull fitting CDF in Figure 2. Data samples lie mostly above the Weibull approximation, i.e. Pr{Nsampled > n} ≤ Pr{Nweibfit > n}. Since we integrate in Equation (2) over the tail of the PDF, the overestimation in the number of messages results in an overestimation of excess traffic. However, deviations seem acceptable, especially when looking at cut-off rates for which the excess data volume is below 10 kBytes. Again, Figure 4 includes the results for the service sets with τ = 40 and τ = 120s, confirming that the excess traffic increases proportionally with decreasing latency τ . III. C OST O PTIMIZATION We can now use the previous results for the service set ABC (τ = 82s) for trading off broadcast costs, CB , and cellular costs, CC , such as to find the minimum system 1 Regarding the cellular network, we assume that a sufficiently low latency can be guaranteed such that messages are delivered at least within the maximum latency for priority A messages (τA = 20s). Further, we assume that no network capacity shortages occur, which may cause dropped messages.
80
Excess traffic E [kBytes]
R
Excess traffic estimated from the Weibull fit Simulation results from the on−the−fly scheduling
60 τavg = 40s
40 τA = 20s τB = 60s τC = 120s
τavg = 120s 20
0
0
1
2 3 Cut−off rate R [kbps]
4
5
Fig. 4. Excess traffic E as a function of the cut-off rate R, derived from the Weibull fitting (Eq. 2) and the simulated on-the-fly scheduling in [9]. Weibull Probability Plot
Data samples Cumulative distribution function (CDF)
We can now calculate for any given broadcast data rate R the amount of excess traffic E, i.e. the amount of messages that do not fit in the broadcast channel with rate R during the peak hours, by integrating over the tail of the PDF in Figure 3, starting from R. Z ∞ E=τ Pr{U }(U − R) du (2)
0.999 Weibull fit
0.99
0.96
0.90 150
200
300
400
500
600
700
Number of messages
Fig. 5. Zoomed view of the Weibull fitting CDF (upper right corner in Figure 2).
operation costs for a given number of users Nu . We assume that the cost per bit, cb , is the same for both the broadcast and the cellular network2 . Note that the cost for a broadcast channel is a fixed sum, i.e. CB = cb · R · T0 , while cellular costs increase linearly with excess traffic and the number of users, i.e. CC = cb · E · Nu . As suitable performance measure, we propose the operation cost per user µ ¶ CB + CC R · T0 Cu = = cb · +E . (3) Nu Nu A service provider typically receives a certain income from each customer (the subscription fee). After subtracting the operation costs per user, the remainder represents the revenue per customer. Figure 6 shows typical graphs for Cu plotted against the number of users Nu for selected cut-off rates R. 2 This is indeed a reasonable assumption when considering the current pricing of DAB capacity in Germany and GPRS tariffs for large-volume customers. Figures may change somewhat when looking at different countries or cellular pricing models.
Operation cost per user CU [units per hour]
10
message where it should be transferred to – the broadcast or the cellular network. We already mentioned algorithms for an on-the-fly scheduling of messages in the broadcast carousel. One version of this on-line algorithm proposed in [9] uses bucketing, i.e. all messages with similar latency requirements are gathered in one bucket and treated as a uniform group.
R = 7 kbps 1
R = 1 kbps
0.1
What remains unanswered for the hybrid network is the problem of how to implement an optimal router. An algorithm that decides on a message-by-message basis might require too much computing resources. Therefore, we propose a simple priority class removal procedure, which builds upon the bucketing mechanism:
R = 3 kbps
0.01 R = 5 kbps
0.001 10
100
1000
10000
Number of users NU
Fig. 6. System operation cost per user Cu as a function of the number of customers Nu and depending on the cut-off rate R.
The fixed cost for a broadcast channel results in an inverse proportionality between Cu and Nu until the cellular cost, which in turn increases proportionally to Nu , starts overwhelming the cost savings of the broadcast network. As a result, Cu starts levelling out, i.e. the cost (revenue) per user cannot be reduced (increased) further by a growing customer base. Hence, a larger broadcast channel must be purchased, resulting in a larger fixed operation cost. As the number of customers grows, there are distinct crossover points indicating when to switch to a larger broadcast channel: • from 1 kbps to 3 kbps at 20 customers; • from 3 kbps to 5 kbps at 300 customers; • from 5 kbps to 7 kbps at 5640 customers. These figures are provided only for illustrating the approach. The actual switching points are of secondary interest, as they strongly depend on the assumptions about broadcast and cellular costs. The key observations in this analysis are the opposing trends in the cost per user Cu (as a function of the number of users Nu ) and the fact that distinct crossover points exist. Considering the long periods for which broadcast capacities and licenses are auctioned, a service provider needs to carefully estimate subscriber numbers and plan ahead with the subscription fees for achieving a sound and positive business case. The proposed approach may prove useful in this process. IV. A P RAGMATIC I MPLEMENTATION A PPROACH – G RADUAL R EMOVAL OF S ERVICES In the previous sections, we derived analytically the amount of data traffic that needs to be redirected through the cellular network. Achieving optimal performance, i.e. minimizing the excess traffic, would require complete knowledge of all system parameters at any time and a decision module (router) that decides instantaneously and for each individual
1) Monitoring the overall mean latency – Using the number of messages currently present in the system (i.e. the sizes of the queues for priorities A, B and C), their length L and the analytical expression for calculating the overall mean access time in [9], it is possible to monitor quite accurately to which degree the resources in the broadcast network are utilized. After exceeding the threshold τ (see Section II-C), the messages in one, perhaps even several, queues need to be rerouted through the cellular network. 2) Selecting the feasible class combinations – For each of the possible priority class removals (six in the case of three priority classes), the overall mean access time for the remaining services, i.e. those which are not removed, is estimated. 3) Selecting the class(es) to be removed – The overhead costs caused by transmitting the excess traffic through the cellular network can now be calculated from the number of messages in the removal class(es) and the message length L. From the set of feasible removals, the class(es) whose removal results in the lowest overhead costs is finally selected. The results of such a gradual removal strategy are shown in Figure 7. The cut-off rate is set to 2 kbps, the number of messages is NA = 60, NB = 90 and NC = 150, each with a length L = 1000bits. Further, τA = 20s, τB = 60s and τC = 120s, hence τ = 82s . The feasible set of priority class removals, i.e. the classes that can be transmitted over the broadcast channel without violating the required τ , are therefore {AB, A, B, C}, of which AB and C both yield the lowest overhead cost. However, AB achieves a somewhat lower average latency, i.e. a better user-perceived QoS, and should therefore be preferred. This rather simple approach may be refined in many ways, e.g. with respect to defining the threshold or improving the removal process. One could perhaps redirect only part of a priority class. If a clustering of messages in service classes, like the example given with the service set ABC, is not applicable, a suitable message-by-message strategy must be devised.
160
years), perhaps with an increasing total number of messages over time, this method can be used for long-term network capacity planning and for substantiating service provider business plans.
Latency
Latency τ [s] / Overhead cost [units per hour]
140
120 Overhead cost 100
R EFERENCES Desired latency τ = 82s
80
60
40
20
0
ABC
AB
AC
BC
A
B
C
Priority classes transmitted over the broadcast channel
Fig. 7. Results of the gradual removal strategy – latency τ and cellular overhead cost.
V. C ONCLUSION In this paper, we proposed the use of a hybrid (i.e. combination of broadcast and cellular) system for delivering traffic information services to a large number of customers in a given service area. The hybrid system uses the broadcast network for basic supply and the cellular network as backup for times when the number of messages exceeds the capacity of the broadcast network. Thus, worst-case dimensioning of the broadcast system, i.e. the provisioning of overhead capacity for covering peak traffic, is avoided and substantial cost savings can be achieved. These cost savings are partially consumed by paying for the data traffic in the cellular network during the peak hours. The overall problem is therefore a one-dimensional optimization problem with a distinct cost minimum. This minimum depends heavily on the message arrival statistics at the input of the system. Therefore, we analyzed the recorded messages of a public traffic information service from the year 2003 in Germany. By using a fitting to a well-known probability distribution, in this case the Weibull distribution, one can easily estimate the peak traffic and hence the overhead costs caused by the cellular network. This is done by integrating the tail of the probability distribution function, starting from the capacity limit of the broadcast network. The underlying assumption here is that it is not of interest when, or how often, the broadcast network is overloaded, but rather how much traffic must be rerouted over the cellular network during a given time interval – typically the fiscal year of the service provider. The proposed model is insensitive to any specific partitioning of services in classes with individual QoS requirements (latency). Important to estimating the excess traffic is only the average latency over all service classes. Assuming that the underlying traffic message statistics remain about constant during longer periods of time (several
[1] P. Davies, “The radio system-traffic channel,” in Proceedings of Vehicle Navigation and Information Systems Conference, Toronto, Canada, September 1989, pp. A44–A48. [2] J. Hellaker, C. Palmgren, and S. Turunen, “Real-time traveller information - in everyone’s pocket? - a pilot test using hand-portable GSM terminals,” in Proceedings of Vehicle Navigation and Information Systems Conference, Ottawa, Canada, October 1993, pp. 49–52. [3] “Radio broadcasting system; Digital Audio Broadcasting (DAB) to mobile, portable and fixed receivers,” European Telecommunications Standards Institute (ETSI), 1995, ETS 300 401. [4] T. Lauterbach, M. Unbehaun, D. Angebaud, A. Bache, T. Groult, R. P. Knott, P. Luff, G. Lebourhis, M. Bourdeau, P. Karlsson, R. Rebhan, and N. Sundstr¨om, “Using DAB and GSM to provide interactive multimedia services to portable and mobile terminals,” in ECMAST ’97: Proceedings of the Second European Conference on Multimedia Applications, Services and Techniques, London, UK, 1997, pp. 593– 607, Springer-Verlag. [5] B. Aktus and A. Bria, “Evaluation of user perceived performance in sparse infrastructure wireless systems,” in Proceedings of the Affordable Wireless Services and Infrastructure, 2nd Annual Workshop, Sigtuna, Sweden, June 2004. [6] Federal Statistical Office, www.destatis.de/themen/e/thm verkehr.htm, Germany. [7] “OECD international road traffic and accident database,” German Federal Highway Research Institute, www.bast.de/htdocs/fachthemen/ irtad/english/irtadlan.htm. [8] “MATLAB software,” The MathWorks Inc., Natick, MA, USA, www.mathworks.com/products/matlab/, last accessed January 2005. [9] N. H. Vaidya and S. Hameed, “Scheduling data broadcast in asymmetric communication environments.,” ACM Wireless Networks, Kluwer Academic Publishers, Hingham, MA, USA, vol. 5, no. 3, pp. 171–182, 1999. [10] J. Hu, “Telematics services using hybrid networks,” M.S. thesis, Friedrich-Alexander-University Erlangen-Nuremberg, Germany, Dept. of Computer Science, 2004.