arXiv:cond-mat/0401094v1 [cond-mat.stat-mech] 7 Jan 2004. Traffic on complex networks: Towards understanding global statistical properties from microscopic ...
Traffic on complex networks: Towards understanding global statistical properties from microscopic density fluctuations
arXiv:cond-mat/0401094v1 [cond-mat.stat-mech] 7 Jan 2004
Bosiljka Tadi´c1 , Stefan Thurner2 and G. J. Rodgers3 1
Department for Theoretical Physics; Joˇzef Stefan Institute, P.O. Box 3000; SI-1001 Ljubljana; Slovenia, 2 Complex Systems Research Group HNO AKH; Universit¨ at Wien, W¨ ahringer G¨ urtel 18-20; A-1090 Vienna; Austria, 3 Department of Mathematical Sciences; Brunel University, Uxbridge; Middlesex UB8 3PH; UK We study the microscopic time fluctuations of traffic-load and the global statistical properties of a dense traffic of particles on scale-free cyclic graphs. For a wide range of driving rates R the traffic is stationary and the load timeseries exhibit anti-persistence due to the regulatory role of the superstructure associated with two hub nodes in the network. We discuss how the super-structure effects the functioning of the network at high traffic density and at the jamming threshold. The degree of correlations systematically decreases with increasing traffic density and eventually disappears when approaching a jamming density Rc . Already before jamming we observe qualitative changes in the global network-load distributions and the particle queuing-times. These changes are related to the occurrence of temporary crises in which the network-load increases dramatically, and then slowly falls back to a value characterizing free-flow. PACS numbers: 89.75.Fb, 89.20.Hh, 05.65.+b, 87.23.Ge
I.
INTRODUCTION
Microscopic dynamic processes and emergent statistical properties are two facets of complex dynamic systems that are closely connected, and for many systems understanding their interdependence is important for both prediction and strategic planning. Usually detailed information is available about either the microscopic dynamics or the statistical properties, but seldom both. Prominent examples include traffic noise on communication networks [1, 2], noisy signals in driven disordered and self-organized systems [3], and the timeseries of price fluctuations in financial markets [4]. On the other hand, emergent behavior in a statistical system on a macroscopic scale can be described by (stable) statistical laws, their sensitivity to relevant parameters of the dynamics can be studied and the type of global behavior may be predicted. In this work we use a recently proposed model [5] to study both the microscopic fluctuations of traffic timeseries on complex networks and the statistical properties of transport of individual particles. These particles can be thought of, e.g., as information packets in the Internet or organizations, or proteins transported on the cytoskeleton of a cell. We study how the statistical properties, both at a microscopic and macroscopic levels, vary with the particle creation rate R, i.e., traffic density. A new class of networks, called scale-free, has been recognized as the most commonly observed network structure, which appears to be also the most stable (see, e.g., [6, 7]). In particular, communication networks such as the Internet and the Web are scale-free networks with
both in-coming and out-going link connectivity distribution obeying a power-law with significant clustering and link correlations [8, 9, 10]. A model graph with these properties, which we call ”Web-graph” was recently proposed [11]. For study of particle traffic on complex networks we recently introduced a model of simultaneous random walks on scale-free cyclic and tree-graphs [5, 12]. In low particle density the distributions of particle transit-times exhibit power-law dependences with the exponents depending on the network structure. Other theoretical studies capture the essential properties of the jamming transition and self-tuned driving on simpler topologies, like hierarchical trees [13] and square lattice models [14, 15]. Due to finite processing capacities of nodes traffic queues occur especially at hub nodes, depending on the intensity of traffic. This means that the transit-time for particles depends not just on the distance between the sending and receiving node but also on the geometry and local traffic density [5]. The distribution of transit-times is important for network efficiency and for estimating the risk of transport delay. For a given graph and a search algorithm, a fundamental quantity that contributes to the emergent transit-time is the waiting-time that a particle spends in queues along its path. In [5] we considered different network topologies and showed how the dilute, sparse, topology of the network influences the transport on it. Different search algorithms were employed with low density traffic to quantify the network’s performance. We have found that (i) low density traffic is stationary; (ii) away from the jamming transition the distribution of transit-times is power law due
2 to the topology; (iii) the waiting-times are small for low traffic density; (iv) the Web-graph topology of a scale free directed network with closed loops and a next-nearestneighbor search strategy results in efficient traffic with a large output rate which utilizes the hubs effectively. Consequently, compared to many other topologies the Web-graph can support a huge volume of traffic before getting jammed. In this paper we report on a complementary study. We consider the Web-graph, and analyze the waitingtime statistics and the timeseries of network-load, which is defined as the number of particles on the network at a given time, as the traffic density is varied by increasing the creation or posting rate R. We also consider correlations in the timeseries of the network’s activity, i.e., the number of simultaneously active nodes in the network. The queuing of particles on different nodes is a consequence of a self-regulatory traffic of mutually interacting random walks sent to different specified destinations on the graph. Throughout the paper we use the term load in a functional sense, as defined above. It should not be confused with a topological meaning which is sometimes used for the number of minimal paths through a node [16] or betweenness [17]. The paper is arranged as follows. In the next Section we describe the model in detail, in Section 3 we consider the correlation in the load timeseries and in Section 4 the distributions of waiting-times and network-loads are presented. In Section 5 the work is summarized.
II.
GRAPH STRUCTURE AND TRAFFIC RULES
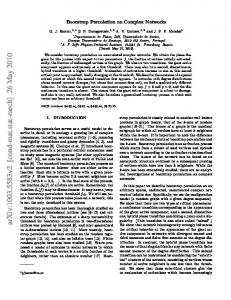
The Web-graph is a directed graph grown with microscopic dynamic rules proposed in [11], which were originally intended to model the evolution of the world-wide Web. It belongs to a class of models with preferential attachment of nodes [6, 7]. In addition to preferential attachment of newly added nodes, the rules of Web-graph evolution include rewiring of preexisting links while the graph grows, which results in an emergent structure with inhomogeneous scale-free ordering in both in-coming and out-going links and a number of closed cycles. An example of such an emergent structure of a Web-graph is shown in Fig. 1. A detailed characterization of the topology of this Web-graph, both on a local and global level, together with a discussion of the origin of scaling laws in this system, can be found in [11, 18, 19, 20, 21]. The observed power-law increase of local connectivity in time [19] can be linked to the power-law distributions for in- and outgoing links, each with their own scaling exponents [11]. Other topological properties which are relevant for traffic on the graph were also studied, in particular the number of paths through a given node as a measure of betweenness was found to have a power-law decay [21] and the degree of clustering and the correlations between in- and
FIG. 1: Web-graph consisting of N = L = 1000 nodes and links.
out-connectivity [20] resemble the properties measured in empirical studies of the Web [9] and the Internet [10]. An important feature of the graph topology is the occurrence of two types of hub nodes (known as hub and authority nodes in the real Web). These are nodes with large in-coming link connectivity and nodes with large out-going link connectivity. These two hubs have many links between them and impose what we call a superstructure which has a strong influence on the transport processes on the graph [5]. We grow the graph to a given size (N = L = 1000 nodes and links) and fix the connectivity matrix after growing. We then model the traffic of particles on that graph [5, 12]. Particles are created with a given rate R (particles per time-interval) at randomly selected nodes and are given a randomly selected destination node where it should be delivered. We select these pairs of nodes within the giant component of the graph. Particles move through the graph simultaneously searching for their respective destination addresses. To navigate particles, each node performs a local search in its next-nearestneighborhood, and if the particle’s destination is found within the searched area, it is delivered to the node’s neighbor linked to the destination node. Alternatively, the particle moves to a randomly selected neighbor. This search algorithm was shown [5] to perform especially well on the Web-graph, where it can effectively make use of the hub nodes. In particular, it was shown that it performs 40 times better than a random diffusion on the same graph and 8 times better than the same algorithm on a scale-free tree graph with the same in-link connectivity.
3
III.
CORRELATIONS IN NETWORK-LOAD TIMESERIES
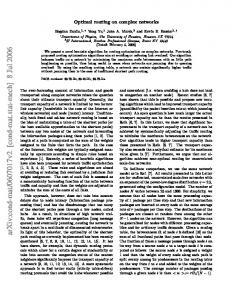
Each particle follows its own (random) path from the origin to its destination. The total time spent along the path, the transit-time, depends on both the topology and the time the particle spends waiting in queues along that path. Statistics of transit-times on different topologies with different search algorithms were studied in [5]. With an efficient search, transit-times can be short, however, some particles get into remote areas of the graph, from which it takes a long time to escape; this results in a power-law distribution of transit-times. With increasing posting rates the interaction between particles, i.e., queueing in hubs, becomes more important and results in longer queuing-times. In effect, the number of particles on the network fluctuates in time in a way that is characteristic of the network structure and the search algorithm, and depends on the posting rate and the buffer capacity. We find that for a wide range of posting rates R the traffic is stationary with the average network output (number of particles delivered per time-step) balancing the input rate R. The load fluctuates around an average value, which increases with R. Eventually, for large R > Rc a permanent increase in the number of particles occurs, indicating that the network is jammed. In Fig. 2 (a) we show an example of the network-load timeseries for two different posting rates. For low posting rates queuing effects are small and transit-times are generally short. Consequently, the total number of particles on the network fluctuates around a small average value. For a much larger posting rate the flow is still stationary but the average number of particles is also much higher. In addition, the character of the fluctuations changes, with occasional dramatic increases in the load, which then dissipate over a relatively long time-period. We considered very long timeseries in order to verify that the particle flow which contains these temporary crises is in fact stationary. When the posting rate is increased over a certain value (R ≈ 0.4 in this particular case) the network-load exhibits a systematic increase, signaling jamming in the network. The power spectra of the network-load timeseries are
100
Network Load
(a)
50
0
0
20000
40000
60000
80000
1e+05
Time 2
Power Spectrum
Additional rules are necessary to regulate the traffic. We assign a buffer (H=1000) to each node in the network. When the buffer at a selected node is full the node cannot accept more particles and the particle waits for the next opportunity to be delivered. Due to the simultaneous movement of particles queues can be formed, especially at nodes with large connectivity. Here we apply the LIFO (last-in-first-out) queuing discipline at each queue. When a particle arrives at its destination it is removed from the network. For simplicity, in this work we allow particles to move along out-going links and against in-coming links with equal probability. Details of the implementation of the numerical code are given in [20].
10 1 10 0 10 −1 10 −2 10 −3 10 −4 10 −5 10 −6 10 −7 10 −8 10
(b)
1
10
2
10
3
10
4
10
5
10
Frequency
FIG. 2: (a) Network-load timeseries in transport on the Webgraph for two different posting rates R representing the stationary free flow (R=0.1, bottom line) and flow with a temporary crisis (R=0.3, top line). (b) Power spectrum of the load timeseries for R=0.005, 0.1, 0.2, 0.3, and 0.4 (bottom to top). Data are log-binned. Fit lines have slopes φ = 1.18, 1.20, 1.30, 1.76, and 1.98. Errors are within ±0.02.
shown in Fig. 2 (b) for several values of R. When posting rates are such that stationary flow (with or without crises) occurs, the work-load timeseries exhibit antipersistence, with the exponent φ of the power-spectrum S(f ) ∼ f −φ increasing with R from φ = 1.2 towards φ = 2. This anti-persistence in the low R regime may be attributed to the regulatory role of the super-structure which is associated with the two hub types in the network. When the particle density is high, queues are formed at these nodes and the queuing particles, although still in transit, are not contributing to the randomness of the load. Moreover, when a particle queuing at a hub gets its turn to move, it gets quickly to its destination, which is often found in the next-nearestneighborhood surrounding one of the hubs, and is then removed from the network. Another situation appears when the queue at a hub node is full. Then the dynamics is reduced to one particle out, one particle in, which entirely destroys the correlations in the transport. In the jammed flow regime the temporal correlations in the network-load are entirely lost (reflected φ ≈ 2 within the error bars). Thus the main properties of the traffic (and jamming) are related to the hubs and their associated structure. To further investigate this effect, we have also studied how the activity is distributed over the network. In Fig. 3 we show the power spectrum of the number of active nodes (non-empty nodes) for varying posting rates R. In
4 0
10
1
10
R=0.01 0.1 0.2 0.3
−1
10
0
10 −2
P(w)
Power Spectrum
10
−1
10
−3
10
−2
10
−4
10
−3
−5
10
10
R=0.4 0.2 0.1 0.01
−6
10
0
1
10
2
10
3
10
10
w
−7 1
10
2
10
3
10 Frequency
4
10
5
10
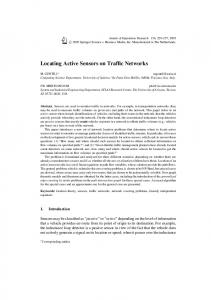
FIG. 3: Power spectrum of network’s activity (number of simultaneously active nodes) for different values of posting rates R. Data are log-binned and the upper two curves shifted vertically for clarity of the plot. Full lines have slopes -1.2, dashed-dotted line: -1.1, and two dotted lines are indicating two slopes of -0.36 and 1.36.
FIG. 4: Probability density function of the network-load in the stationary regime with free flow and flow with temporary crises. Data averaged over 100 network realizations and is log-binned. 0
10
−2
10
P(tw)
10
−4
10
the free flow regime at low posting rate the timeseries of the network’s activity is also anti-persistent with a well defined slope in the power spectrum. For intermediate posting rates, where particle density is increased and temporary crises occur in the flow, a new gradient starts to develop in the low frequency range. Eventually, at high particle density, two distinct types of behavior occur for the low and for high frequencies, indicating that a part of the network has entered the jammed regime.
IV.
WAITING-TIMES AND NETWORK-LOAD DISTRIBUTIONS
The dependence on posting rates of the temporal fluctuations in the network-load and activity, as observed in the previous section, is also found in the averaged statistical properties. The probability density function of the overall network-load, shown in Fig. 4, is obtained from a histogram from timeseries like those in Fig. 2 and averaging over a number of network configurations. At very low traffic density queuing occurs rarely. For intermediate densities queuing becomes more important and consequently the load distribution gets a tail. The large overall load appears – although with smaller probability – to be related to the volatile fluctuations discussed above. In addition, the dominant part of the distribution becomes of log-normal type with the mean shifted towards higher values with increased R. On approaching the jamming limit the tail of the distribution becomes more pronounced, suggesting that queues and thus waiting times increase in a large part of the network. The
R=0.04 R=0.10 R=0.20 R=0.22 R=0.25
−6
10
−8
10
0
10
1
10
2
10
3
10
4
10
tw
FIG. 5: Distribution of waiting-times of individual particles for varying posting rates R in the free flow and flow with temporary crisis. Data collected from a particle which moves within a computation time-window of 200000 time-steps and is log-binned.
distribution of waiting-times of individual particles shows substantial changes when temporary jamming in the network starts occurring more frequently. In Fig. 5 we show the distribution of waiting-times when the posting rate is varied from low to intermediate R, where the flow is still stationary. The distribution is taken from particles which move within a total time-window of up to 200000 time-steps. When crises start to occur the waiting-time distribution changes from simple power-law to a generalized Cauchytype distribution with a slope varying again with the posting rate R. There is robustness in the system in the sense that minor changes to the queuing discipline or the buffer sizes do not lead to a qualitative difference in these results. However, if the queuing discipline is changed from LIFO to FIFO (first in first out) then the
5 power dependence of the waiting-time distribution disappears. In particular, for the range of posting rates below jamming, for FIFO-queuing a gap in the waiting-time distributions appears, separating the power-law like tail for long waiting-times at hubs, from the short waiting-times, which are found at most of the other nodes in the network. In LIFO-queuing the waiting-time at a given node is dynamically conditioned by incoming packet streams from all neighboring nodes after arrival of the packet. In contrast, much weaker dependence on the local network structure is incorporated in the FIFO-queuing mechanism, where the waiting-time is exactly given by the queue length of that node at arrival of the packet, independently on how long it took the network to build the queue [5]. However, the transit-time distribution, which integrates waiting-times over many nodes along the packet trajectory on the network, remains a powerlaw for both queuing mechanisms at low and moderate R [5, 12].
We have performed an extensive study of both the microscopic dynamics (timeseries) and macroscopic probability density functions of network-load and waitingtimes of particles in a model of transport on Web-graphs. Particles move using a local search algorithm with nextnearest-neighbor signaling, which uses the underlying network topology efficiently. We have demonstrated how network function changes when posting rates are altered. Statistical properties of both the microscopic dynamics and the probability density functions suggest that there occur three flow regimes, depending on the overall traffic density: stationary free flow at low posting rates; stationary flow with temporary jams which are subsequently slowly dissipated by the system, and jammed flow at high posting rates. Our analysis applies to the stationary free flow and flow with temporary crisis, whereas we can recognize the approach to jamming transition from the lowdensity side. In particular, we find that the jamming threshold is marked by the loss of temporal correlations in the work-load timeseries and by permanent increase of the overall network load. The waiting-times of packets diverge on approaching the jammed flow, therefore the
statistical analysis of waiting-times can not be carried out in the vicinity of the transition. The super-structure associated with the two types of hubs in the network plays an essential role in determining the properties of the traffic. In the low particle density regime it contributes to efficient free flow and the clearance of temporary jamming through self-regulating mechanisms which may be directly measured by the degree of anti-persistence in the work-load timeseries. However, at high particle density the hubs are the first nodes to jam, forcing a crucial part of the network structure to enter a slow-traffic (jammed) regime, whereas the rest of the network, which carries much less traffic, may continue to function normally. The hub with higher connectivity is likely to jam first. Then the network continues to function with the other hub until it also jams, eventually causing the congestion to spread over the associate structure. In principle, the relative distance between hubs plays the role in spreading of the congestion, e.g., when hubs are far apart the jamming in two parts of the network will occur almost independently. In our model the two-hub structure is an emergent feature and the distance between hubs can not be controlled by the network growth rules in our present setting. However, due to strong clustering property, the relative distance between the hubs is rather short and – in most network realizations – within the reach of the next-nearestneighbor search. Thus highly organized scale-free networks, containing these super-structures, operate more efficiently than conventional networks for a wide range of driving conditions. However, their advantage may become a weak point when the conditions change, i.e., when the traffic density increases over a certain limit. This property of traffic may also be important to prevent dynamical attacks which target hubs, such as denial of service attacks to highly connected servers. Our overall conclusion is, although the particular topology of the Web-graph is essential for its efficient operation under normal conditions, the same topology may also be a weakness under different conditions, reflected by vanishing anti-correlations in network-load timeseries. It seems clear that to assess the vulnerability of a network to different types of attack, one cannot just consider the topology of a network, one must consider how that topology influences particle transport on it.
[1] A. Erramilli, O. Narayan and W. Willinger, IEEE/ACM Trans. Networking 4, 209 (1996). [2] M. Takayasu, H. Takayasu and T. Sato, Physica A 233, 824 (1996). [3] B. Tadi´c, Physica A 270, 125 (1999). [4] R.N. Mantegna and H. E. Stanley, Introduction to Econophysics: Correlations and Complexity in Finance, (Cambridge University Press, 1999). [5] B. Tadi´c and S. Thurner, Physica A 332, 566 (2004); cond-mat/0307670.
[6] S. N. Dorogovtsev and J.F.F. Mendes, Evolution of Networks: From Biology to the Internet and the WWW, (Oxford University Press, 2003). [7] R. Albert and A.-L. Barabasi, Rev. Mod. Phys. 74, 47 (2002). [8] D.J. Watts, Small Worlds: The Dynamics of Networks between Order and Randomness, (Princeton University Press, 1999). [9] A. Broder et al., Comput. Networks 33, 309 (2000). [10] A. Vazquez, R. Pastor-Storras and A. Vespignani, Phys.
V.
CONCLUSIONS
6 Rev E 65, 066130 (2002). [11] B. Tadi´c, Physica A 293, 273 (2001). [12] B. Tadi´c and G.J. Rodgers, Adv. Complex Systems 5, 445 (2002). [13] A. Arenas, A. D´iaz-Guilera, and R. Guimera, Phys. Rev. Lett. 86, 3196 (2001). [14] R. V. Sol´e and S. Valverde, Physica A 289, 595 (2001); [15] S. Valverde and R. V. Sol´e, Physica A 312, 636 (2002). [16] K.-I. Goh, B. Kahng and D. Kim, Phys. Rev. Lett. 87 278701 (2001). [17] M.E.J. Newman, Phys. Rev. E 64, 016132 (2001). [18] B. Tadi´c, Computer Physics Communications 147, 586 (2002);
[19] B. Tadi´c, Physica A 314, 278 (2002). [20] B. Tadi´c, Modeling Traffic of Information Packets on Graphs with Complex Topology, P.Sloot it et al. Eds., Computational Science—ICCS 2003, International conference Melburn, Australia, and St. Petersburg, Russia, 2-4 June 2003, Part I, Lecture Notes in Computer Science 2657, 136, Springer (Berlin) 2003. [21] B. Tadi´c, Exploring complex graphs by random walks, in “Modeling Complex Systems”, P. L. Garrido and J. Marro (Eds.), AIP Conference Proceedings 661, 24 (2002).