TRAINING AND SIMULATION OF NEURAL NETWORKS FOR WEB PROXY CACHE REPLACEMENT Jake Cobb and Hala ElAarag Department of Mathematics and Computer Science Stetson University 421 N. Woodland Blvd Deland, FL 32720 wcobb,
[email protected]
user-perceived latency and link congestion by
ABSTRACT
serving local copies of web objects whenever
Web proxy caches are widely used to reduce
possible. The proxy server aims to serve as many
user-perceived latency and link congestion caused
objects from the cache as possible, serve as much
by the extremely high volume of web traffic. In
data from the cache as possible, or both.
this research, neural networks are trained to make
Optimizing both is ideal, although not always
proxy cache replacement decisions. The neural
possible, but many practical algorithms optimize
networks are trained to classify cacheable objects
for one over the other.
from real world data sets using information known
Web proxy caching is a paging problem.
to be important in web proxy caching, such as frequency, recency and size.
Strategies applied to other paging problems, such
The networks are
as main memory management, have been adapted
able to obtain correct classification ratios of
to address web proxy caching.
between .85 and .88 both for data used for training
Web proxy
caching has two main factors that must be
and data not used for training. In simulation, the
considered:
final neural networks achieve hit rates that are
cache
replacement
and
cache
consistency. Cache replacement refers to deciding
86.60% of the optimal in the worst case and 100%
what should be removed from the cache to make
of the optimal in the best case. Byte-hit rates are
room for new data. Cache consistency refers to
93.36% of the optimal in the worst case and
ensuring that items in the cache are still the same
99.92% of the optimal in the best case.
as items on the original server.
This research
addresses the former.
Keywords
In [1], the authors conduct an extensive
Proxy caching, neural networks, replacement
survey of web cache replacement techniques.
algorithm, performance evaluation.
Cache replacement strategies are classified into recency-based,
1. INTRODUCTION Web traffic dominates other contemporary
recency/frequency-based,
frequency-based, function-based
and
Internet traffic and is continuing to grow in
randomized strategies. Recency-based strategies
volume. Proxy server caching attempts to reduce
are modeled after Least Recently Used (LRU).
SPECTS 2006
279
ISBN: 1-56555-308-X
Recency-based strategies center around the idea of
approximation by example through supervised
temporal locality, meaning that a reference to an
learning [3-7].
item is likely to be followed by additional
The rest of the paper is organized as follows.
references. They are simple, quick and somewhat
Section 2 presents the related work in web proxy
adaptive but many do not handle size information
cache replacement and caching applications of
well.
neural networks.
Frequency-based strategies are modeled
after Least Frequently Used (LFU).
Section 3 describes Neural
These
Network Proxy Cache Replacement (NNPCR) and
strategies are best for static environments. They
enumerates specific methods used in this research.
are used less often in commercial applications
Section 4 reviews the simulation details and
than recency-based strategies because they tend to
results including data preprocessing, metrics,
be more complex.
neural
Furthermore, they tend to
network
training,
and
proxy
suffer from cache pollution if an appropriate aging
simulation.
factor is not used.
and Section 6 explores areas for future work.
Recency/frequency-based
cache
Section 5 presents our conclusions
strategies simply consider both recency and frequency in decision-making.
2. RELATED WORK
Function-based
strategies apply a function to candidate items and
This section discusses some current web
select for replacement based on that value. The
proxy cache replacement algorithms. Next, work
functions
using neural networks for caching is reviewed.
have
weights or
parameters that
determine behavior and are thus able to be tuned
2.1 Existing Algorithms
to specific workloads. Randomized strategies are those that are non-deterministic.
There are a wide variety of web proxy cache
Randomized
replacement
strategies can be fully random, but the vast
algorithms developed from them are considered “good enough” for current web caching needs.
proxy cache replacement strategies as a whole as size,
cost
to
The metrics used to determine this designation are
fetch,
discussed later. PSS is a recency-based algorithm.
modification time and expiration time.
It uses multiple LRU caches and chooses an item
In this paper, we present an approach to web
for replacement from the selections of the
proxy cache replacement that uses neural networks
individual LRU lists. GDSF and LUV are both
for decision making. The framework of this
function-based strategies. GDSF extends GD-Size
research has appeared in [2]. Neural networks are
[11] to take account for frequency in addition to
selected due to their ability to develop internal representations
of
knowledge,
literature.
[9], Least-Unified Value (LUV) [10] and other
Podlipnig et al. [1] list
the most commonly considered factors for web
frequency,
the
(PSS) [8], Greedy Dual Size Frequency (GDSF)
then select an item for replacement at random
recency,
in
According to [1], Pyramidal Selection Scheme
majority cull choices down to a smaller group and
from the remaining list.
algorithms
size, cost to fetch and an aging factor. LUV uses a
approximate
sliding window of request times to gather
continuous, bounded functions and derive such an
parameters for an undefined function F(x) which is used to calculate the probability p(i) that an
ISBN: 1-56555-308-X
280
SPECTS 2006
object i will be referenced in the future.
This
momentum.
probability is used along with cost to fetch and size
information
to
select
an
object
The sigmoid function shown in
equation 1
for
f (u )
replacement.
1 1 eu
(1)
is used as the activation function.
2.2 Neural Network Caching
entropy error function shown in equation 2 is used
Khalid proposed a neural network-based
as the objective function for the neural network.
cache replacement scheme [12] called KORA. KORA is based upon earlier work by Pomerene et
ECE t po ln y po 1 t po ln 1 y po
al. [13] which uses shadow lines. Shadow lines
p
refer to cache lines which are not currently active but have been active in the past.
t {0,1} is the target output y is the actual output
cache lines as shadow lines which then receive
p and o are indexed over the training patterns
preferential treatment. Outside of this distinction,
and output nodes, respectively
The KORA
The neural network has a single output
algorithms use feed-forward back-propagation
which is interpreted as the probability that the
neural networks, as does this research. However,
object represented by the inputs is cacheable.
KORA addresses traditional cache replacement.
NNPCR uses a two hidden layer structure since
Algorithms used in traditional cache replacement
networks of this class are known to have a
form the basis for replacement algorithms used in web
caching,
but
have
received
(2)
o
where,
KORA and
KORA-2 [14] use neural networks to designate
the KORA algorithms use LRU.
The cross-
universal approximation property. Several sizes
extensive
and hidden layer configurations were trained in an
modification. Web proxy cache workloads differ
effort to find the smallest network possible.
from traditional caching due to variable object size
Networks which are too large often learn the
and bursty request sequences, amongst other
training set well but are unable to generalize [7].
things [1,8-11,15-17].
The
hidden
layers
were
usually
kept
at
approximately the same size to ease training [7,18].
3. NEURAL NETWORK PROXY CACHE REPLACEMENT
Section 4.3.1 discusses the effects of these choices.
In this section we present our Neural Network
The cache functions according to the behavior
Proxy Cache Replacement (NNPCR) technique.
that Podlipnig et al [1] suggest is typical of
The main idea behind NNPCR is to construct and
practical implementations; it caches all objects
train a neural network to handle web proxy cache
until it reaches a high mark H and then selects
replacement decisions. The neural networks used
objects for replacement until it reaches a low mark
in this research are multi-layer perceptrons (MLP)
L. Network inputs represent recency, frequency
[5,7]. The weights of the network are adjusted
and size.
using
according to the neural network’s output; those
batch-mode
back-propagation
with
Objects are selected for replacement
with the lowest probability of being cacheable are
SPECTS 2006
281
ISBN: 1-56555-308-X
replaced first. This approach is a function-based
investigating the web proxy cache replacement
replacement strategy. The network is trained with
problem as it exists independent of specific
requests from an hour long segment of a trace file.
hardware, low-level cache simulation, such as that
A second hour long segment is taken from a trace
performed by DiskSIM [19], is not necessary. The
file for a different day in the same week. The
difference in time required to retrieve an object
second set is used as a verification set.
The
from the disk versus main memory is assumed to
weights of the network are not adjusted based on
be trivial compared to the difference in time
the verification set, but the verification patterns
required to send an object from the cache versus
are run across the network each epoch to measure
retrieving and retransmitting a fresh copy of the
how well the network is able to generalize.
object. The simulation ran with trace data from
NNPCR creates a neural network with small random
weights
in
the
range
IRCache [20]. Unique documents were identified
[-0.6,0.6],
by size and Uniform Resource Identifier (URI).
approximately. The training cycle, or epoch, is
Rhea et al [15] propose value-based web
repeated until the number of epochs reaches the
caching to address concerns about the effects of
maximum. Each pattern in the training set is
resource modification and aliasing. Although the
applied to the neural network and the derivatives
point is valid, it is not considered by NNPCR
are back-propagated based on a target output of 0
because the actual data transmitted is not available.
for un-cacheable requests and 1 for cacheable
Furthermore, the trace data is sanitized before
requests. NNPCR records the error and whether
being made publicly available so that dynamic
or not the request was classified correctly.
A
information is not available. For example, form
request is classified as cacheable if and only if the
data passed by appending the parameters to the
neural network output is greater than 0.5. The
URI is removed during sanitation. Finally, such
current set of error derivatives are added to the set
approaches are designed with cache consistency in
of total error derivatives.
At the end of each
mind, which is beyond the scope of NNPCR.
epoch, if the percentage of correctly classified
4.1 Data Preprocessing
training patterns is the highest seen so far in the
A significant amount of data preprocessing
training session the network is saved to a file. To ensure
good
generalization,
NNPCR
was needed to train the neural network.
also
IRCache trace files each cover one day and
calculates the correct classification ratio (CCR) the
neural
network
achieves
against
The
contain tens of thousands of requests. First, we
the
used exhaustive search to convert each log file
verification set. If this ratio is the highest seen so
entry into an entry containing the URI, frequency,
far in the training session, the network is saved to
size, timestamp and number of future requests for
a second file. Finally, the weights are updated
that day.
based on the set of total error derivatives.
Next, we eliminated internal Squid
requests and generated recency values. Recency values were generated by running a cache
4. SIMULATION
simulation using the high/low water mark method
Simulation consists of a simple iterative analysis procedure.
ISBN: 1-56555-308-X
discussed earlier.
Since this research is
282
The timestamp of the most
SPECTS 2006
recently added or updated request was used as the
from the proxy cache versus retrieved from the
current time. Lines were written out whenever a
original server. Optimizing for this metric reduces
request was removed from the cache or caused a
the amount of network traffic and thus eases link
cache hit. Items were assigned a rating equal to
congestion.
the number of future requests for that item and
objects in the cache optimize for hit-rate whereas
replaced starting with the lowest rated.
This
those that prefer fewer large objects optimize for
process created log files with only the desired
byte-hit-rate. In [1], an algorithm is considered
information and thus made them suitable for
“good enough” for current web proxy caching
training.
However, the log files were still
needs if it performs well for more than one metric.
excessive in length so one hour of the January 11,
Therefore, both hit rate and byte hit rate are
2006 pa.us.ircache.net trace file was selected as
considered in evaluating NNPCR.
Algorithms that favor many small
the training set. One hour of the January 10, 2006
For training the network, the most important
pa.us.ircache.net trace file was designated as the
metric is the correct classification ratio (CCR).
verification set.
pa.us.ircache.net is located in
We use a combination of sigmoid activation units
Palo Alto, California. One should note that the
and the cross-entropy error function, shown in
information, such as future requests, in each hour
equations 1 and 2 respectively, to interpret
long set reflected knowledge of the entire day, not
network output as the probability that a particular
just that particular hour. Finally, the inputs were
pattern represents a request in the cacheable class.
normalized into the range [-0.9,0.9] to prevent
A network output of .75 generates an error signal
node saturation.
when the target is 1.0.
This was accomplished by
However, since any
tracking the maximum and minimum values of
network output > 0.5 means the pattern is more
each property and then applying the following
likely cacheable than not, this pattern would still
linear normalization function:
be classified correctly.
xnorm
xactual min data max tgt min tgt (3) max data min data
Therefore, correct
classification ratio is the criteria used for training purposes while hit rate and byte hit rate are the criteria for performance evaluation once training is complete.
4.2 Metrics Hit-rate and byte-hit-rate are the two most commonly
used
metrics
to
evaluate
4.3 Performance Evaluation
the
In order to judge how well the neural network
performance of cache replacement techniques
performs, it is compared with LRU and LFU.
[1,9,16,17]. Podlipnig et al [1] also mention the
Additionally, the neural networks performance is
delay-savings-ratio but claim it is unstable and
compared with a “perfect” function (optimal)
thus not generally used. Hit-rate refers to the ratio
which always rates an object with the number of
of objects served from the proxy cache versus those retrieved from the original server.
future requests.
This
The relationship between the correct
metric targets user perceived delay and availability.
classification ratio of the training set and that of
Byte-hit-rate is the ratio of number of bytes served
the verification set is used to measure the neural
SPECTS 2006
283
ISBN: 1-56555-308-X
network’s ability to generalize. This metric is also
Verification Set Performance LR 0.01, MR 0.4
applied to sets which were not examined during 100
training to evaluate the practical potential of the
90
neural network.
70
80
CCR (%)
2/10/10/1
Several networks were trained with varying
2/5/5/1
60
2/1/2/1
50
2/2/2/1
40
2/10/5/1 3/5/5/1
30
structure, learning rates, momentum rates and
3/2/2/1 20 10
choice of inputs. Batch mode learning was used
0 1
51
for all networks. The majority of the networks
maximum correct classification ratio for the set
and
verification
set
151
Figure 2. Verification set performance over 200 epochs.
converged to the same classification maxima. The
training
101 Epochs
Training Set Performance LR 0.01, MR 0.4
was 90
approximately .88. The impact of variations in
85 2/10/10/1
learning rate (LR) and momentum rate (MR), extreme
values,
were
CCR (%)
excluding
80
minimal
2/5/5/1 2/1/2/1
75
2/2/2/1 2/10/5/1
70
compared to structural variation. Neural network
3/5/5/1 3/2/2/1
65
structure is denoted such that a/b/c/d means the
60 1
51
network has a inputs, b nodes in the first hidden
101
151
Epochs
Figure 3. Training set performance over 200 epochs for 60 < CCR < 90.
layer, c nodes in the second hidden layer and d output nodes.
Verification Set Performance LR 0.01, MR 0.4
4.3.1 Training
90
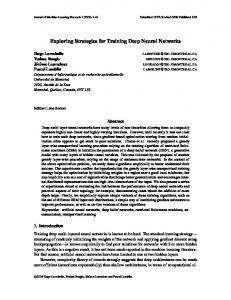
Figures 1 and 2 show the correct classification
85 2/10/10/1
ratio for several different network structures over CCR (%)
80
the first 200 epochs for the training set and verification set, respectively.
2/5/5/1 2/1/2/1
75
2/2/2/1 2/10/5/1
70
Figures 3 and 4
3/5/5/1 3/2/2/1
65
show a more detailed look at training behavior by
60 1
ignoring the brief negative spikes in the CCR
51
101
151
Epochs
values of some networks.
Figure 4. Verification set performance over 200 epochs for 60 < CCR < 90.
Training Set Performance LR 0.01, MR 0.4
These networks were initialized with different
100
random weights. All the networks used frequency
90 80 2/10/10/1 CCR (%)
70
and recency as the first and second inputs,
2/5/5/1
60
2/1/2/1
50
2/2/2/1
40
2/10/5/1
respectively. Neural networks with a hidden layer
3/5/5/1
30
containing only a single node remained frozen
3/2/2/1 20
after initialization and were unable to adjust,
10 0 1
51
101
151
although lucky initializations sometimes started
Epochs
the networks at fairly high ratios. The smallest
Figure 1. Training set performance over 200 epochs.
structure that was able to learn effectively through
ISBN: 1-56555-308-X
284
SPECTS 2006
back-propagation was a 2/2/2/1 neural network.
different structures of neural network. For each
In
larger
structure, two neural networks were tested: 1) the
structures, such as 2/5/5/1, on both the training
network saved for best performance on the
and verification data sets.
This is a very
training set and 2) the network saved for the best
encouraging result because these small networks
performance on the verification set. For a high
are fast to train.
mark of 0.2 GB, the 3/2/2/1 verification (V)
fact,
it
frequently
outperformed
Adding size as a third input
yielded very similar results.
For three-input
network achieved the highest hit rates of the
networks, the smallest network able to learn was a
neural networks and both 2/2/2/1 networks shared
3/2/2/1 structure. The striking similarity between
the worst hit rates of the networks. Table 1 shows
the training and verification graphs indicate the
the hit rates of the optimal algorithm, LRU, LFU,
networks are generalizing well.
The 2/2/2/1,
the 3/2/2/1 verification network and the 2/2/2/1
2/10/10/1 pair of networks and the 3/2/2/1, 3/5/5/1
networks for a high mark (HM) of 0.2 GB and
pair essentially swapped values for the training set
various low mark (LM) values.
versus the verification set (i.e. one pair’s
illustrates the hit rate performance of all tested
performance on the training set was equivalent to
algorithms and neural networks for these same
the other pair’s performance on the verification
parameters.
set).
This suggests a tradeoff in performance
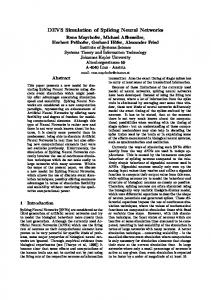
Figure 5
Table 1. Hit rates for a high mark of 0.2 GB and several low mark values.
between sets; it might not be possible to exceed a
LM (GB): Optimal LRU LFU 3/2/2/1 2/2/2/1
certain accuracy on a given set without decreasing accuracy on another. Each neural network was allowed to run 2000 epochs. Many of the networks had jitter in the
0.001
0.01
0.05
0.1
25.99% 23.17% 23.60% 24.04% 22.84%
25.99% 23.17% 23.60% 24.04% 22.84%
26.35% 23.69% 24.88% 24.90% 22.82%
26.35% 24.13% 25.11% 25.66% 22.88%
CCR graph that lent some stochastic search properties to the training once it approached the High Mark: 0.2 GB
maxima.
As described earlier in the paper, a
26.5 26.0
neural network was saved to file whenever its
Optimal LRU
25.5
Hit Rate (%)
LFU
current set of weights achieved a new highest
25.0
2/5/5/1 T
24.5
2/5/5/1 V 2/10/5/1 T
24.0
2/10/5/1 V 2/2/2/1 T
23.5
CCR for either the training or verification set.
2/2/2/1 V 23.0
3/2/2/1 T
22.5
3/2/2/1 V 3/5/5/1 T
22.0 0.001
4.3.2 Proxy Cache Simulation
0.05
0.1
3/5/5/1 V
Low Mark (GB)
Cache simulation was carried out on the entire
Figure 5. Hit rates for the algorithms and neural networks for HM = 0.2 GB.
January 16, 2006 trace file from pa.us.ircache.net.
Although the 3/2/2/1 verification network
The cache size was set at 0.5GB because larger
performed very well for the hit rate metric, it did
cache sizes required so few replacements that the
the opposite for byte-hit rate. The 2/5/5/1 training
problem became too easy to be interesting.
(T) network had the highest byte-hit rates of the
Several combinations of high and low mark values
neural networks, but was the same or slightly
were evaluated. The simulation was repeated for
worse than LFU. Table 2 shows some selected
the optimal algorithm, LRU, LFU and five
SPECTS 2006
0.01
285
ISBN: 1-56555-308-X
byte-hit rates and Figure 6 shows all the tested
High Mark: 0.4 GB 26.5
byte-hit rates for a high mark of 0.2 GB.
Optimal 26
LRU LFU
25.5
LM (GB): Optimal LRU LFU 3/2/2/1 2/5/5/1
0.001
0.01
25.61% 24.00% 24.54% 24.09% 24.54%
25.61% 24.00% 24.54% 24.09% 24.54%
0.05 26.20% 24.26% 24.69% 24.00% 24.46%
Hit Rate (%)
Table 2. Byte-hit rates for various low mark values and a high mark of 0.2 GB.
2/5/5/1 T 2/5/5/1 V
25
2/10/5/1 T 2/10/5/1 V 2/2/2/1 T
24.5
0.1
2/2/2/1 V 3/2/2/1 T
24
26.20% 24.65% 24.88% 23.92% 24.68%
3/2/2/1 V 3/5/5/1 T
23.5 0.001
0.01
0.05
3/5/5/1 V
0.1
Low Mark (GB)
Figure 7. Algorithm and neural network hit rates for a high mark of 0.4 GB.
For a 0.001 GB low mark, the networks and algorithms perform roughly equivalent. High Mark: 0.2 GB
This
results from the tight constraint of the small low
26.5 26.0
mark value and the large gap between the high and
Optimal LRU
25.5 Byte-hit Rate (%)
LFU 25.0
2/5/5/1 T
24.5
2/5/5/1 V
low mark values. The low mark determines how
2/10/5/1 T 24.0
2/10/5/1 V
much is left in the cache after a replacement, so at
2/2/2/1 T
23.5
2/2/2/1 V 23.0
3/2/2/1 T
22.5
some point it becomes low enough that not all
3/2/2/1 V 3/5/5/1 T
22.0 0.001
0.01
0.05
0.1
3/5/5/1 V
cacheable requests can be stored at once. This
Low Mark (GB)
Figure 6. Byte-hit rates for a high mark of 0.2 GB and various low mark values.
effect is, of course, amplified by poor decisions that leave un-cacheable requests in the cache.
Superior performance for the hit rate metric versus
When the gap between the high and low mark
the byte-hit rate metric may be the result of
values is large, the number of items that must be
training for classification only and not in terms of
replaced in a single replacement increases.
a size-related cost.
Furthermore, replacements are carried out less
To further test the effects of cache parameters,
frequently and thus the algorithm or neural
the same simulations were run with a high mark of 0.4GB.
network responsible for replacement decisions
Under these conditions, the 2/5/5/1
does not evaluate the status of items in the cache
networks achieved the best hit rates of the neural
as often.
networks and 2/2/2/1 networks had the worst hit
example, many cacheable items are kept during a
rates. Table 3 compares these networks with the
single replacement sweep but then receive their
other algorithms and Figure 7 shows the
respective last accesses well before the high mark
performance of the comparison algorithms and all
is reached.
the neural networks.
Finally, infrequent replacement
increases the performance cost of bad replacement
Table 3. Algorithm and neural network hit rates for a high mark of 0.4 GB.
LM (GB): Optimal LRU LFU 2/5/5/1 2/2/2/1
This can be problematic when, for
0.001
0.01
0.05
0.1
24.78% 24.68% 24.73% 24.78% 24.69%
25.93% 24.84% 25.05% 24.98% 24.70%
26.35% 25.19% 25.61% 25.29% 24.78%
26.35% 25.36% 25.79% 25.41% 24.89%
decisions because of the additional time selected requests are left untouched in the cache. As the low mark increases, LFU consistently has the high hit rate after the optimal algorithm. The 2/5/5/1 network trails LFU for low marks greater than 0.001 GB, but achieves a better hit rate than LRU for every low mark value. Byte-hit rates for the
ISBN: 1-56555-308-X
286
SPECTS 2006
neural networks were consistent with the hit rate
5. CONCLUSION Web proxy cache replacement is major
rankings; the 2/5/5/1 and 2/2/2/1 networks had the highest and lowest byte-hit rates, respectively.
component
Table 4 compares these two networks with the
Algorithms have been developed for web proxy
other algorithms and Figure 8 shows byte-hit rates
caches specifically, as opposed to local caching,
for the algorithms and all the neural networks.
because the traffic patterns seen by a web proxy
0.001
0.01
0.05
0.1
25.00% 25.04% 25.02% 25.03% 24.98%
26.04% 25.21% 25.38% 25.57% 24.99%
26.20% 25.67% 25.58% 25.70% 25.00%
26.20% 25.71% 25.83% 25.73% 25.06%
proxy
cache
performance.
server vary from those seen in local caches on
Table 4. Byte-hit rates for the algorithms and neural networks with a high mark of 0.4 GB.
LM (GB): Optimal LRU LFU 2/5/5/1 2/2/2/1
of
significant characteristics such as variability in object size and locality of references. The respective
performances
of the replacement
algorithms are heavily dependant on metric and workload.
Algorithms
tend
to
either
have
assumptions about workload characteristics built in or include tune-able parameters to control which assumption(s) the algorithm favors.
High Mark: 0.4 GB 26.5
NNPCR is a novel web proxy cache
Optimal 26
LRU
replacement scheme which incorporates a neural
LFU Hit Rate (%)
25.5
2/5/5/1 T 2/5/5/1 V
25
network. Supervised learning with real-world data
2/10/5/1 T 2/10/5/1 V 2/2/2/1 T
24.5
builds workload assumptions into the decision-
2/2/2/1 V 3/2/2/1 T
24
3/2/2/1 V 3/5/5/1 T
23.5 0.001
0.01
0.05
0.1
making process from actual workloads. The neural
3/5/5/1 V
Low Mark (GB)
network approximates a function relating input
Figure 8. Byte-hit rates for the algorithms and neural networks with a high mark of 0.4 GB.
patterns to a probability that a request will be
The byte-hit rates were subject to the same
referenced in the future.
constraint as hit rates for a low mark of 0.001 GB.
In this paper, we have demonstrated that a
In fact, this was the only case where the optimal
properly structured
algorithm did not achieve the highest metric.
efficiently trained to perform web proxy cache
However, this is an intuitive result since the
replacement from real world data using the basic
optimal algorithm only considers the number of
batch-mode back-propagation with momentum
future requests and not the size of a request for
weight update algorithm. Furthermore, we have
replacement decisions.
The 2/5/5/1 network
shown that such a network is able to effectively
performed very well for this metric; it had the
generalize to other workloads in a similar
highest byte-hit rates after the optimal for 2 of 3
environment; the neural networks we trained were
low mark values greater than 0.001. LFU had a
able to classify both training and verification sets
higher byte-hit rate when the low mark was 0.1
with CCR values in the range of .85 to .88.
neural network can be
GB, but the magnitude of the difference between
We have presented simulation results which
LFU and the 2/5/5/1 network for these parameters
suggest this approach is a promising approach to
was small in comparison to the difference for a
web proxy cache
replacement.
The neural
low mark of 0.01 GB.
SPECTS 2006
287
ISBN: 1-56555-308-X
networks achieve hits rates of 86.60% and 100%
Finally, the selection of data sets from within
of the optimal in the worst and best cases,
the sets made available by IRCache [20] was
respectively. Byte-hit rates range from 93.36% to
essentially arbitrary. Although the performance
99.92% of the optimal in the worst and best cases,
shows that the data was reasonably representative
respectively. The fact that a variety of structures
of the workload, statistical methods might be
can
useful for creating training sets that are more
be
quickly
trained
for
proxy
cache
replacement with virtually no tweaking of training
representative of general workloads.
parameters, such as learning rate, suggests that the capabilities of neural networks are well-suited
7. REFERENCES
to
problem.
[1] S. Podlipnig and L. Böszörmenyi, “A survey
Furthermore, since training success for other
of web cache replacement strategies,” ACM
problems is often dependant on such parameters,
Computing Surveys, vol. 35, no. 4, pp. 374-
neural networks as a class are likely to be capable
398, 2003.
the
proxy
cache
replacement
[2] H. ElAarag and W. Cobb, “A Framework for
of even better performance.
Using Neural Networks for Web Proxy Cache Replacement,”
6. FUTURE WORK NNPCR was compared with, aside from the optimal algorithm, LRU and LFU.
of
Communication and Networking Simulation Symposium (CNS2006), SpringSim’06. (SCS,
These
2006, pp. 389-396)
algorithms form the basis of other web proxy [3]
cache replacement algorithms, but are not the algorithms currently used in practice.
Proceedings
in
C. Stergiou and
D.
Siganos,
“Neural
Networks,” [Online document] [cited Sept. 9,
Future
research which is able to generate neural networks
2005]
Available
WWW:
with enhanced performance should compare such
http://www.doc.ic.ac.uk/~nd/surprise_96/jour
networks with more advanced proxy cache
nal/vol4/cs11/report.html. [4] L. Fu, “Knowledge discovery based on neural
replacement algorithms such as PSS, GD-size and
networks,” Communications of the ACM
LUV.
Archive, vol. 42, no. 11, pp. 47-50, 1999.
NNPCR was tested using data from the same proxy cache within a relatively short time frame.
[5] P. P. van der Smagt, “A comparative study of
The strength of this approach when dealing with
neural network algorithms applied to optical
different caches and/or greater spans of time needs
character recognition,” in Proceedings of the
to be explored.
Third International Conference on Industrial
workload immensely.
These considerations influence variability
and Engineering Applications of Artificial
Workload characteristics undergo
Intelligence and Expert Systems (ACM Press,
characteristics
and
1990, vol. 2, pp. 1037-1044)
significant change over time as technologies and societies develop and change; methods for fast-
[6] B. Dasgupta, H.T. Siegelmann, and E. Sontag,
retraining of the neural network would allow it to
“On a learnability question associated to
adapt to new trends in the data without
neural networks with continuous activations,”
abandoning the knowledge it previously learned.
ISBN: 1-56555-308-X
288
SPECTS 2006
Annual
Workshop
on
Computational
12th International Conference on World Wide
Learning Theory, pp. 47-56, 1994.
Web. (ACM Press, 2003, pp. 619-628)
[7] R. D. Reed and R. J. Marks II, Neural smithing:
[16] R. Caceres, F. Douglis, A. Feldmann, G.
supervised learning in feedforward artificial
Glass and M. Rabinovich, “Web proxy
neural networks. The MIT Press, 1999.
caching: the devil is in the details,” ACM
[8] C. C. Aggarwal, J. L. Wolf and P. S. Yu,
SIGMETRICS
Performance
Evaluation
“Caching on the World Wide Web,” IEEE
Review, vol. 26, no. 3, pp. 11 – 15, 1998.
Trans. Knowl. Data Eng. 11, pp. 94-107, Jan.
[17] L. Rizzo and L. Vicisano, “Replacement policies for a proxy cache,” IEEE/ACM
1999.
Transactions on Networking, vol. 8, no. 2, pp.
[9] M. Arlitt, L. Cherkasova, J. Dilley, R.
158 – 170, 2000.
Friedrich and T. Jin, “Evaluating content [18]
management techniques for Web proxy
J.
de
Villiers
and
E.
Barnard,
caches,” ACM SIGMETRICS Performance
“Backpropagation neural nets with one and
Evaluation Review, vol. 27, no. 4, pp. 3-11,
two hidden layers,” IEEE Transactions on
2000.
Neural Networks, 4(1), pp. 136-141, 1993.
[10] H. Bahn, K. Koh, S. L. Min and S. H. Noh,
[19] G. Ganger, B. Worthington, Y. Patt and J.
“Efficient replacement of nonuniform objects
Bucy,
in Web caches,” IEEE Comput. 35, pp. 65 –
Environment,” [Online document] Sept. 2005
73, June 2002
[cited Sept. 16, 2005] Available WWW:
[11] P. Cao and S. Irani, “Cost-Aware WWW
USENIX
Symposium
on
DiskSim
Simulation
http://www.pml.cdu.edu/DiskSim/
Proxy Caching Algorithms,” in Proceedings of
“The
[20] “IRCache Home,” [Online document] [cited
Internet
Sept.
Technologies and Systems. (1997, pp. 193-
5,
2005]
Available
WWW:
http://ircache.net/
206) [12] H. Khalid, “A new cache replacement scheme based on backpropagation neural networks,” ACM SIGARCH Computer Architecture News, vol. 25, no. 1, pp. 27-33, 1997. [13] J. Pomerene, T.R. Puzak, R. Rechtschaffen and F. Sporacio, “Prefetching Mechanism For a High-Speed Buffer Store,” US Patent, 1984. [14] H. Khalid, “Performance of the KORA-2 cache replacement scheme,” ACM SIGARCH Computer Architecture News, vol. 25, no. 4, pp. 17 – 21, 1997. [15] S. C. Rhea, K. Liang and E. Brewer, “Valuebased Web caching,” in Proceedings of the
SPECTS 2006
289
ISBN: 1-56555-308-X