Liu et al. BMC Genomics (2017) 18:375 DOI 10.1186/s12864-017-3764-9
METHODOLOGY ARTICLE
Open Access
Transcription factor-associated combinatorial epigenetic pattern reveals higher transcriptional activity of TCF7L2regulated intragenic enhancers Qi Liu1,2, Russell Bonneville3, Tianbao Li1,2 and Victor X. Jin1*
Abstract Background: Recent studies have suggested that combinations of multiple epigenetic modifications are essential for controlling gene expression. Despite numerous computational approaches have been developed to decipher the combinatorial epigenetic patterns or “epigenetic code”, none of them has explicitly addressed the relationship between a specific transcription factor (TF) and the patterns. Methods: Here, we developed a novel computational method, T-cep, for annotating chromatin states associated with a specific TF. T-cep is composed of three key consecutive modules: (i) Data preprocessing, (ii) HMM training, and (iii) Potential TF-states calling. Results: We evaluated T-cep on a TCF7L2-omics data. Unexpectedly, our method has uncovered a novel set of TCF7L2-regulated intragenic enhancers missed by other software tools, where the associated genes exert the highest gene expression. We further used siRNA knockdown, Co-transfection, RT-qPCR and Luciferase Reporter Assay not only to validate the accuracy and efficiency of prediction by T-cep, but also to confirm the functionality of TCF7L2-regulated enhancers in both MCF7 and PANC1 cells respectively. Conclusions: Our study for the first time at a genome-wide scale reveals the enhanced transcriptional activity of cell-type-specific TCF7L2 intragenic enhancers in regulating gene expression. Keywords: T-cep, TCF7L2, Intragenic enhancer, PANC1, MCF7
Background Numerous public data resources, including the ENCODE and Epigenomics Roadmap, have generated thousands of genome-wide data sets, and provided us with substantial quantities of data to study transcriptional and epigenetic patterns in different cell types at a genome-wide scale [1, 2]. Many studies have shown that epigenetic modifications play a central role in regulating gene expression, and are involved in a diversity of biological processes in the human organism [3, 4]. However, the “epigenetic code”, referring to the transcription of genetic information encoded in DNA is in part regulated by DNA methylation and histone * Correspondence:
[email protected] 1 Department of Molecular Medicine, University of Texas Health Science Center, 8403 Floyd Curl, San Antonio, TX 78229, USA Full list of author information is available at the end of the article
modifications, has not yet been fully elucidated. Substantial efforts in cracking this code and uncovering its biological functions have been made, utilizing both in vitro and in silico methods [5–7]. One innovative and practical way is to segment the epigenome into various chromatin states [8–10], where each state is decoded as a specific combinatorial pattern of multiple epigenetic modifications. Such states or combinatorial patterns can reflect a variety of sets of genes’ expression levels, which are essential to establish and maintain distinct functions in chromatin [11, 12]. For instance, novel classes of enhancers have been identified through genome-wide pattern analyses [13–15]. Therefore, identification of epigenetic regulatory combinations and networks is increasingly important for understanding genome functions, chromatin components and molecular mechanisms.
© The Author(s). 2017 Open Access This article is distributed under the terms of the Creative Commons Attribution 4.0 International License (http://creativecommons.org/licenses/by/4.0/), which permits unrestricted use, distribution, and reproduction in any medium, provided you give appropriate credit to the original author(s) and the source, provide a link to the Creative Commons license, and indicate if changes were made. The Creative Commons Public Domain Dedication waiver (http://creativecommons.org/publicdomain/zero/1.0/) applies to the data made available in this article, unless otherwise stated.
Liu et al. BMC Genomics (2017) 18:375
Computational approaches and models have been a major force to uncover these complex epigenetic patterns. These contain probabilistic methods, such as ChromaSig, an unbiased clustering and alignment approach that finds over-represented epigenetic signatures [16]. More advanced machine learning approaches have been applied in recent work, such as hidden Markov models (HMM) [10] and Bayesian network methods [17]. The HMM has proved to be a good model in training models with numerous inputs, and that generate thousands of outputs [18–20]. For example, ChromHMM utilized a multivariate HMM to learn chromatin states and to output emission probabilities for each mark in each state and then to infer the number of combinatorial marks in each of all states [21]. Segway [17] applied dynamic Bayesian networks (DBN) to segregate the genome with a higher segment resolution, and derive different chromatin states from chromatin marks [22]. Although these computational methods have successfully been used to annotate chromatin elements, many of them suffer from significant limitations. For instance, some supervised learning methods cannot find de novo information. Some unsupervised learning methods train on small genomic regions such as Segway [17] and HMMSeg [23], or output a single mark’s probability such as ChomHMM [21]. None of these algorithms explicitly compare targets of a specific TF with different histone modification marks to qualitatively assess the association of that TF with active, repressive and elongation regions. Most TFs have narrow binding patterns compared to most histone modification marks, but are major regulators of gene expression [24, 25]. Therefore, by ignoring TF binding in the beginning of algorithm design or training, a method may erroneously consider it as less meaningful due to the lower probability of TF than chromatin states, or not incorporate TF binding information at all. As such, it is critical to develop an algorithm that considers a specific TF together with many different epigenetic marks. In order to address TF-dependent epigenetic regulatory events, we have developed a novel algorithm and software tool, T-cep (Transcription factor-associated combinatorial epigenetic patterns), which applies a univariate HMM to identify combinatorial epigenetic patterns associated with cell type-specific TF targets in different cell types. To evaluate T-cep, we applied it on TCF7L2-omics data, including ChIP-seq data of TCF7L2, Pol-II, active chromatin marks (H3K4me1,3 and H3K27ac), repressive chromatin marks (H3K27me3 and H3K9me3), a mark of transcriptional elongation (H3K36me3) as well as DNase-seq for open chromatin regions in five cancer cell types. TCF7L2 (transcription factor 7-like 2), an important component of WNT pathway, has been implicated in several human diseases including carcinogenesis, type 2 diabetes and bipolar disorder [26–29]. The WNT pathway is often constitutively activated in human cancers,
Page 2 of 13
such as colon, liver, breast, and pancreatic cancer [30], with high upregulation of TCF7L2. Several studies have shown tissue-specific alternative splicing of TCF7L2, suggesting that TCF7L2 may have different functional properties in different cells [31, 32]. In our previous studies, we have mapped genome-wide binding of TCF7L2 in six cell lines [33, 34]. However, the combinatorial epigenetic profile of TCF7L2 in these cancer types has not been well studied. One hypothesis is that TCF7L2 regulates its downstream target genes in a cell type-specific manner, i.e., utilizing different combinatorial patterns with various epigenetic environment cues in each cell type. Therefore, one way to test this hypothesis is to identify TCF7L2-assoicated combinatorial epigenetic patterns in a diverse set of cell types. In this paper, we first describe the workflow of T-cep, then present training results on TCF7L2-omics data in five cancer cell types, and compare it with ChromHMM [21]. Finally, we perform functional validations using siRNA, RT-qPCR, co-transfections and luciferase reporter assays on selected gene loci. To the best of our knowledge, this is the first genome-wide combinational epigenetic pattern discovery study for cell type-specific TCF7L2 regulation.
Results The workflow of T-cep
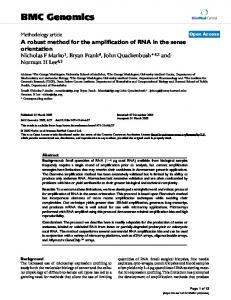
To identify TF regulated chromatin states through a variety of epigenetic marks, we have developed a novel computational method, T-cep, for annotating chromatin states associated with a specific TF. T-cep is composed of three key consecutive modules: (i) Data preprocessing, (ii) HMM training, and (iii) Potential TF-states calling (Fig. 1a). The detail of the algorithm is described in Methods. Step 1: Data pre-processing
T-cep uses a univariate HMM, where each bin can only emit one probability value, which corresponds to a combination of different marks. An alphabet of 2n (n = the number of epigenetic marks) observation symbols is constructed by enumerating each possible combination of marks (including no marks). We combine all ChIP-seq data in multiple cells as observations and translate them to such an alphabet of 2n observations as an input for the next step. If necessary for computational efficiency, this alphabet can be simplified by removing symbols that correspond to mark combinations not present in the input data. Step 2: HMM training
We initially train multiple HMMs for 300 iterations with T-cep, and select the best model based on the lowest BIC score. If desired, this model may be simplified by removing infrequent states. This is performed by
Liu et al. BMC Genomics (2017) 18:375
Page 3 of 13
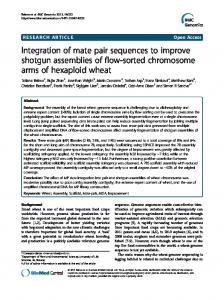
Fig. 1 T-cep algorithm and training results for TCF7L2-omics data. a The workflow of T-cep algorithm. Shown is a schematic summary of the four steps needed for de novo identifying transcription factor associated chromatin state (TF-state). The approach begins with preprocessing the ChIP-seq data into an alphabet of 2n observations, builds a HMM to generate a best selected model without infrequent state, re-estimate transition and emission probabilities and then annotate biological meaningful TF-states. b Result of T-cep approach. The emission probabilities of each mark are independent of others for the selected 18-state HMM. The mark probability of greater than 0.1 is considered to be associated with a chromatin state. c A screenshot of a genomic region in Chr8 of MCF-7 annotated by T-cep in UCSC genome browser. ChIP-seq of TCF7L2 and histone marks are in the first nine lines, while the tenth track represents the main output of the T-cep, annotated different states represented by different colors. RefSeq gene (HG19) genomic positions are shown in the last line
eliminating the states which are called in very few bins (lower than 5% of the average number) and uniformly redistributing their transition probabilities to other states. We then re-train this derived HMM for another 100 iterations to produce the final model. Step 3: Potential TF-states calling
The Viterbi decoding algorithm is used to output called states for all bins in the genome. The probabilities of each mark are futher calculated by marginalization for each of different cell types respectively. We chose states with a cutoff of probability greater than 0.1 for any individual mark for further investigation, as these are most likely to yield meaningful biological insights. Finally, the HMM states can be classified as potential TF-associated chromatin states (TF-states) and potential non-TF-associated chromatin states (non-TF-States). Identification of TCF7L2-associated chromatin states by T-cep
To demonstrate the accuracy of T-cep and evaluate its performance, we chose TCF7L2-omics data as a study case. TCF7L2 is an important component of the WNT
pathway, and has previously been studied by our laboratory. Additionally, 45 datasets of omics-seq data are available for the training (Additional file 1: Table S1-S2, all are available in the ENCODE Consortium), including ChIP-seq of TCF7L2, six histone marks (H3K4me1, H3K4me3, H3K9me3, H3K27ac, H3K27me3, H3K36me3), Pol-II and DNase-seq in five cancer cell types, HCT116, HeLa, HepG2, MCF7 and PANC1, with a total of ~2.02 billion reads. For each of these cell types, we also obtained RNA-seq data from our previous study or publicly available sources [35, 36]. We initially trained five 25-state HMMs over the data with bin sizes of 750 bp for 300 iterations, and selected the best HMM with the lowest BIC score of 4.3247 • 107 (Additional file 1: Table S3). The states of every bin in each genome were called after the first HMM training. Seven infrequent states (lower than 5% of the average) were then eliminated (Additional file 1: Table S4) to produce an 18-state HMM model with BIC 4.40718 * 107. We then performed a secondary HMM training for 100 iterations, and the log-likelihood was calculated at each iteration to verify model convergence (Additional file 1: Figure S1). This produced the final model, with a
Liu et al. BMC Genomics (2017) 18:375
BIC score of 4.31487 *107. The transition probabilities and the emission probabilities of each final state are shown in Additional file 1: Figures S2-S3. The Pearson correlation between the HMM emission probabilities and the actual observation frequencies under each state was R2 ≥ 0.97 for all cell types, except HCT116 with R2 = 0.9545 (Additional file 1: Table S5 and Figure S4). We then divided emission probabilities for each mark independently by marginalization among combinations of marks probabilities and potential TF-states (Fig. 1b and Additional file 1: Figure S5). A comparison of a genomic region for the states annotated by T-cep and the actual ChIP-seq signals (Fig. 1c) clearly demonstrated the ability of T-cep to accurately capture epigenetic elements. We further examined the genomic characterization of potential TF-states using the annotated genomic regions defined in Additional file 1: Table S6, as well as the expression levels of their associated genes (Fig. 2a and Additional file 1: Figure S6). We were able to classify four states, 1, 3, 4 and 5, as TCF7L2-associated states, and the others as non-TCF7L2-associated states (Fig. 2b). State 3 was assigned as TCF7L2-associated promoter because of its higher frequency in 5’TSS regions (44.2% relative to other states) and its high emission probabilities for Pol-II and H3K4me3 (Fig. 2a). State 1 was classified as TCF7L2 binding, non-combinatorial TF-state, as its emission probability is only high for TCF7L2. We classified states 4 and 5 as TCF7L2associated enhancer states due to their higher emission probabilities for the enhancer marks H3K27ac and H3K4me1. Location distribution showed most bins (75.9%) of state 5 were in gene body regions while the associated genes have a higher average gene expression as well as its high emission probabilities for enhancer marks H3K4me1, H3K27ac and gene body mark, H3K36me3 (Fig. 1b). Thus, state 5 was annotated as TCF7L2 intragenic enhancer. State 4 was classified as a TCF7L2 distal enhancer since 67.9% bins of state 14 were outside intragenic regions. Except those bins in Gene Desert regions, there were clearly more bins in 5’Distal regions than in 5’Proximal and 3’Distal regions. State 2 was classified as mapping bias/CNV due to its high emission probabilities for all active and repressive marks, where marks such as Pol-II and H3K9me3 were not expected to co-occur, as well as due to the relatively high proportion of its bins in known amplified regions. We also identified some non-TCF7L2-associated states (non-TF-states). States 7 and 9 were classified as non-TCF7L2-associated enhancers. State 9 with a high Pol-II was assigned as an active non-TCF7L2-associated enhancer, while state 7 was likely to be an inactive nonTCF7L2-associated enhancer. Interestingly, the average gene expression levels of both states are less than those
Page 4 of 13
of the TCF7L2-associated states. State 6 was classified as a non-TCF7L2-associated bivalent state or poised enhancer due to its high emission probability of both repressive mark H3K27me3 and enhancer mark H3K4me1, and its lower average gene expression. All the other nonTCF7L2-associated states were assigned for their possible functions as well (Fig. 2b). The annotation of chromatin states is further supported by the location analysis of bins within each state relative to genes (Fig. 2c). All genes’ length is normalized by Virtual bin Creation and the 5’-3’ region represents the whole gene body region and the distal region is extended to each to 90 kb upstream of 5’TSS or downstream of 3’TSS. Clearly, it is showed more than 60% of state 3 bins were located at or near the 5’TSS of each gene, (the green line), in which we interpreted it as promoter. State 5 is represented with the red line, in which its bins were distributed mainly in gene body region, thus called as intragenic enhancer. State 4 as distal enhancer shown in the blue line was mainly located in distal regions, and state 1 was infrequently in any of gene body or intragenic regions (Fig. 2c and Additional file 1: Figure S7). In the other aspect, we wanted to re-examine whether the distribution in proportion of numbers of three annotated functional states is actually in their expected genomic regions. Indeed, State 3 bins are only in 5’TSS regions (131,086 bins), state 5 bins in intragenic regions (206,644 bins) and state 4 bins in 5’Distal regions (70,812 bins) for further analysis. Moreover, we observed in each cell type the distribution of these three TF-States in order 3/5/4 is the following: 239/32/26 for HCT116, 1061/559/30 for HepG2, 737/1109/29 for HeLa, 802/ 1265/327 for MCF7 and 3093/1972/1581 for PANC1 (Fig. 2d). Our results indicate the distribution in proportion of numbers of each of three functional states may be cell type specific. Gene enrichment and pathway analyses of TCF7L2-associated chromatin states
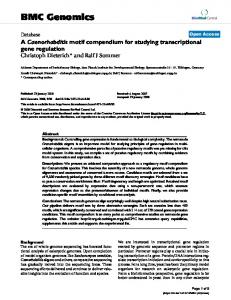
Next, we wanted to examine in silico the biological functions of TCF7L2-associated chromatin states. We chose MCF7 and PANC1 cell types for further analysis as they had the highest number of genes associated with states 3, 4, and 5, where the number of genes associated with states 3/4/5 is 742/230/573 for MCF7 and 2718/ 677/672 for PANC1 respectively (see the list in Additional file 2). Firstly, we checked the cell type specificity of all of the genes. Interestingly, when examined in the National Cancer Institute’s NCI-60 cell lines [37], MCF7 cell line was the top category for genes selected in MCF7 cells, and PANC1 cell line was the top category for its selected genes (Fig. 3a). A Venn diagram of examining these same genes within each cell line showed a
Liu et al. BMC Genomics (2017) 18:375
Page 5 of 13
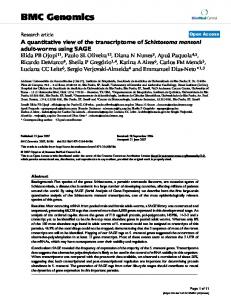
Fig. 2 The annotation of chromatin states for TCF7L2-omics data. a The correlation with other genomic features, the distribution of each state bins as well as the average of gene expression for each of 18 states. The average gene expression is normalized by z-score and % total bin shows the percentage of each state in the human genome. b The biological interpretations of the HMM states and identification of four TCF7L2-assoicated States according to the emission probability and other genomic information. c The distribution of four TF-associated States on the gene structure. All genes’ length is normalized, representing the 5’–3’ region as gene body region and extending 90 kb of up/down steam for gene surrounding distribution. d Summary of bin distribution of three TCF7L2-associated states in five cancer cell types
little among genes associated with each state, with only 22 genes in MCF7 and 77 in PANC1, respectively, associated with all three states (Fig. 3b). We also found that the genes associated with these three different TCF7L2 states in MCF7 and PANC1 cells are different, suggesting cell type specificity of TCF7L2 activity. Moreover, when we examined the average expression levels of all genes associated with each state, we found that the overall gene expression level of state 5 genes was the highest in all selected cell types (p-value < 0.0001) and much higher than genes associated with state 4 or state 3. Our result suggested that TCF7L2-regulated intragenic enhancers may play a prominent role in upregulating gene expression than TCF7L2-regulated distal enhancers (Fig. 3c).
We further examined the biological function of the TCF7L2-regulated genes by KEGG pathway enrichment analysis [38, 39]. Our results demonstrated that the enriched pathways are different between these three categories with cell type specificity (Fig. 3d). In overall, pathway enrichments in MCF7 cells were more involved in cancer initiation and cell cycle pathways, while those in PANC1 cells were more related to the metabolic pathway and cell adhesion. Interestingly, TCF7L2regulated promoters are more enriched with well-known specific cancer initial development such as Epstein-Barr virus infection in breast cancer and metabolic in pancreatic cancer [20, 40, 41]. However, TCF7L2-regulated intragenic enhancers included advanced stage markers
Liu et al. BMC Genomics (2017) 18:375
Fig. 3 (See legend on next page.)
Page 6 of 13
Liu et al. BMC Genomics (2017) 18:375
Page 7 of 13
(See figure on previous page.) Fig. 3 Genes with TCF7L2-associated states in MCF7 and PANC1 cells. a Identification of gene associated with TCF7L2-states in NCI-60 cell showing cancer type specificity. b A Venn diagram showing an overlapping set of genes among TCFL2-associated States in two cancer cell lines. c Boxplot of gene expression level showing TCF7L2-associated intragenic enhancers with the highest expression among three TCF7L2-associated states. Expression levels were log2-transformed, with genes having expression level > > > > X XT −1 > T −1
XT XT > > > = P > t ¼ 1 P ðSi;t Þ >B ¼ t¼1 ðS i;t Þ : Xt ¼ O ð5Þ The second Viterbi decoding algorithm is used to compute the highest probability of combinatorial epigenetic marks in correlation with the hidden states. Each combination of epigenetic mark has one output which is done to allow more direct interrogation of combinatorial epigenetic patterns with states. The probabilities of emitting each epigenetic mark independent are calculated by marginalization among all output combinations of marks probabilities. The independent emission probability follows Eq 6: X 2n � PðxÞ ðjxID > 0Þj0ðxID ¼ 0Þ PðIDÞ ¼ ð6Þ x¼1 where ID is the epigenetic mark binary value, x is the output number and & is the bitwise AND operator. Implementation and Application
T-cep is implemented in C++, runs on Linux, and depends on the OpenMP and Boost APIs. T-cep contains a suite of scripts and program implementing the preprocessing, HMM training and TF-State calling steps. A univariate hidden Markov model (HMM) is applied to uncode observed genome-wide epigenetic data into hidden functional chromatin states. Several other scripts are provided for various utility functions. For the concern of scaling limitation, although it is not necessary in this study (only 512 output combinations), T-cep also provided several scripts for allowing large
Liu et al. BMC Genomics (2017) 18:375
numbers of marks in application. getOutputMap.pl can output the actually combination in all database. manyOutputMapper.pl used for mapping output combinations in precompiled datasets to an arbitrary ID system, which only for at least one bin actually found in output combinations. Due to far fewer mark combinations are expected to occur in practice, this script effectively frees T-cep from the scalability for reasonable outputs instead of considering every combination of marks as a possible output, which grows according to 2n. ManyOutputModelBackConvert.pl applied in mapping the outputs of HMMs trained with this data back to the original output combinations. This only considers mark combinations actually found in the data sets an upper bound to model complexity corresponding to the number of bins in all datasets. The tool and scripts are available at our website, http://compbio.uthscsa.edu/T-cep/.
Page 12 of 13
cDNA was prepared using RevertAid H Minus First Strand cDNA Synthesis Kit (Thermo Fisher Scientific). Expression of mRNA analysis was performed with LightCycler® 480 SYBR Green I Masteron and LightCycler® 480 System Sequence Detection System (Roche Applied Science) using GAPDH for normalization. Luciferase reporter assay
Intragenic or distal TFEs were transient transfection into MCF7/PANC1 cells with Lipofectamine 2000 reagent with or without TCF7L2 co-transfection and β-galactosidase expression vector. Cells were harvested and luciferase activity was determined using the Luciferase Assay System (Promega) per the manufacturer’s protocol. The βgalactosidase activity was performed on lysates as a control. The experiments were performed in triplicate.
Additional files Raw data processing
Public ChIP-seq datasets were downloaded from ENCODE project and only the 5’-end of uniquely mapped reads are used for the further analysis. Alignment to human reference genome hg19 was performed with Bowtie. Default settings were used with an exception that the number of allowed alignments was restricted to 1 in order to obtain only unique mapped reads, and seven threads were used. RNA-seq FASTQ files were aligned to hg19 using Tophat2 and average gene expression of each state was calculated by first finding the highest expression for any splice variant of each gene in the RNA-seq results. The midpoint of each bin is calculated, and compared to the 5’ and 3’ ends of annotated RefSeq genes. The average gene expression reported as gene expression levels are weighted by the number of bins close to them. The percentage of bins within RepeatMasker regions was calculated for all states in all cell lines. Hg19 RepeatMasker data was downloaded from http://www.repeatmasker.org/genomes/hg19/RepeatMasker-rm405-db20140131/. The raw RepeatMasker regions were extracted and converted to BED format. The mergeBed program of the BEDTools package was used to merge adjacent RepeatMasker regions. The merged regions were filtered to exclude regions less than 500 bp length. Correlation between state bins and these filtered regions was performed by BEDTools’ intersectBed.
Additional file 1: Supplementary Figures and Tables. (DOCX 4445 kb) Additional file 2: Gene List associated with TF-states. (XLSX 330 kb)
Acknowledgments The authors gratefully acknowledge a financial support from China Scholarship Council. We are grateful to all members of the Jin laboratories for valuable discussion. Funding US National Institutes of Health (NIH) [R01 GM114142 to V.X.J]. Funding for open access charge: NIH. Availability of data and materials The data that support the findings of this study are available from the ENCODE consortium. Authors’ contributions QL and VXJ conceived the project. QL, RB and TL developed the algorithm. QL, TL and VXJ designed the experiments and QL and TL performed experiments. QL, TL and VXJ wrote the manuscript with input from RB. All authors read and approved the final manuscript. Competing interests The authors declare that they have no competing interests. Consent for publication Not applicable. Ethics approval and consent to participate Not applicable.
Co-transfection and RT-qPCR
Publisher’s Note
TCF7L2 siRNAs were purchased from Thermo Fisher Scientific Silencer® Select siRNAs. For transfection of siRNA oligo, MCF7 and PANC1 cells were seeded by 6 cell plate with Lipofectamine® RNAiMAX Transfection Reagent for 48 h. Total RNAs from cells were extracted using Quick-RNA™ MiniPrep kit (Zymo Research). Then
Springer Nature remains neutral with regard to jurisdictional claims in published maps and institutional affiliations. Author details 1 Department of Molecular Medicine, University of Texas Health Science Center, 8403 Floyd Curl, San Antonio, TX 78229, USA. 2College of Life Science, Jilin University, Changchun 130012, China. 3Biomedical Sciences Graduate Program, The Ohio State University, Columbus, OH 43210, USA.
Liu et al. BMC Genomics (2017) 18:375
Received: 17 January 2017 Accepted: 3 May 2017
References 1. ENCODE Project Consortium. An integrated encyclopedia of DNA elements in the human genome. Nature. 2012;489:57–74. 2. Romanoski CE, Glass CK, Stunnenberg HG, Wilson L, Almouzni G. Epigenomics: roadmap for regulation. Nature. 2015;518:314–6. 3. Reik W, Dean W, Walter J. Epigenetic reprogramming in mammalian development. Science. 2001;293:1089–93. 4. Kouzarides T. Chromatin modifications and their function. Cell. 2007;128: 693–705. 5. Wang Z, Zang C, Rosenfeld JA, Schones DE, Barski A, Cuddapah S, et al. Combinatorial patterns of histone acetylations and methylations in the human genome. Nat Genet. 2008;40:897–903. 6. Wang M, Mok MW, Harper H, Lee WH, Min J, Knapp S, et al. Structural genomics of histone tail recognition. Bioinformatics. 2010;26:2629–30. 7. Su J, Qi Y, Liu S, Wu X, Lv J, Liu H, et al. Revealing epigenetic patterns in gene regulation through integrative analysis of epigenetic interaction network. Mol Biol Rep. 2012;39:1701–12. 8. Hamada M, Ono Y, Fujimaki R, Asai K. Learning chromatin states with factorized information criteria. Bioinformatics. 2015;31:2426–33. 9. Zhou VW, Goren A, Bernstein BE. Charting histone modifications and the functional organization of mammalian genomes. Nat Rev Genet. 2011;12:7–18. 10. Ernst J, Kheradpour P, Mikkelsen TS, Shoresh N, Ward LD, Epstein CB, et al. Mapping and analysis of chromatin state dynamics in nine human cell types. Nature. 2011;473:43–9. 11. Kundaje A, Meuleman W, Ernst J, Bilenky M, Yen A, Heravi-Moussavi A, et al. Integrative analysis of 111 reference human epigenomes. Nature. 2015;518:317–30. 12. Mammana A, Chung HR. Chromatin segmentation based on a probabilistic model for read counts explains a large portion of the epigenome. Genome Biol. 2015;16:151. 13. Heinz S, Romanoski CE, Benner C, Glass CK. The selection and function of cell type-specific enhancers. Nat Rev Mol Cell Biol. 2015;16:144–54. 14. Pradeepa MM, Grimes GR, Kumar Y, Olley G, Taylor GC, Schneider R, et al. Histone H3 globular domain acetylation identifies a new class of enhancers. Nat Genet. 2016;48:681–6. 15. Whitaker JW, Nguyen TT, Zhu Y, Wildberg A, Wang W. Computational schemes for the prediction and annotation of enhancers from epigenomic assays. Methods. 2015;72:86–94. 16. Hon G, Ren B, Wang W. ChromaSig: a probabilistic approach to finding common chromatin signatures in the human genome. PLoS Comput Biol. 2008;4, e1000201. 17. Hoffman MM, Buske OJ, Wang J, Weng Z, Bilmes JA, Noble WS. Unsupervised pattern discovery in human chromatin structure through genomic segmentation. Nat Methods. 2012;9:473–6. 18. Ernst J, Kellis M. Interplay between chromatin state, regulator binding, and regulatory motifs in six human cell types. Genome Res. 2013;23:1142–54. 19. Bonneville R, Jin VX. A hidden Markov model to identify combinatorial epigenetic regulation patterns for estrogen receptor alpha target genes. Bioinformatics. 2013;29:22–8. 20. Majidnezhad V. A HTK-based method for detecting vocal fold pathology. Acta Inform Med. 2014;22:246–8. 21. Ernst J, Kellis M. Discovery and characterization of chromatin states for systematic annotation of the human genome. Nat Biotechnol. 2010;28:817–25. 22. Hoffman MM, Ernst J, Wilder SP, Kundaje A, Harris RS, Libbrecht M, et al. Integrative annotation of chromatin elements from ENCODE data. Nucleic Acids Res. 2013;41:827–41. 23. Day N, Hemmaplardh A, Thurman RE, Stamatoyannopoulos JA, Noble WS. Unsupervised segmentation of continuous genomic data. Bioinformatics. 2007;23:1424–6. 24. Farnham PJ. Insights from genomic profiling of transcription factors. Nat Rev Genet. 2009;10:605–16. 25. Spitz F, Furlong EE. Transcription factors: from enhancer binding to developmental control. Nat Rev Genet. 2012;13:613–26. 26. Wang F, Jiang L, Li J, Yu X, Li M, Wu G, et al. Association between TCF7L2 polymorphisms and breast cancer susceptibility: a meta-analysis. Int J Clin Exp Med. 2015;8:9355–61. 27. Lu XP, Hu GN, Du JQ, Li HQ. TCF7L2 gene polymorphisms and susceptibility to breast cancer: a meta-analysis. Genet Mol Res. 2015;14:2860–7.
Page 13 of 13
28. Grant SF, Thorleifsson G, Reynisdottir I, Benediktsson R, Manolescu A, Sainz J, et al. Variant of transcription factor 7-like 2 (TCF7L2) gene confers risk of type 2 diabetes. Nat Genet. 2006;38:320–3. 29. Winham SJ, Cuellar-Barboza AB, Oliveros A, McElroy SL, Crow S, Colby C, et al. Genome-wide association study of bipolar disorder accounting for effect of body mass index identifies a new risk allele in TCF7L2. Mol Psychiatry. 2014;19:1010–6. 30. Ravindranath A, O’Connell A, Johnston PG, El-Tanani MK. The role of LEF/ TCF factors in neoplastic transformation. Curr Mol Med. 2008;8:38–50. 31. Mondal AK, Das SK, Baldini G, Chu WS, Sharma NK, Hackney OG, et al. Genotype and tissue-specific effects on alternative splicing of the transcription factor 7-like 2 gene in humans. J Clin Endocrinol Metab. 2010;95:1450–7. 32. Weise A, Bruser K, Elfert S, Wallmen B, Wittel Y, Wohrle S, et al. Alternative splicing of Tcf7l2 transcripts generates protein variants with differential promoter-binding and transcriptional activation properties at Wnt/betacatenin targets. Nucleic Acids Res. 2010;38:1964–81. 33. Frietze S, Wang R, Yao L, Tak YG, Ye Z, Gaddis M, et al. Cell type-specific binding patterns reveal that TCF7L2 can be tethered to the genome by association with GATA3. Genome Biol. 2012;13:R52. 34. Liu B, Yi J, Sv A, Lan X, Ma Y, Huang TH, et al. QChIPat: a quantitative method to identify distinct binding patterns for two biological ChIP-seq samples in different experimental conditions. BMC Genomics. 2013;14 Suppl 8:S3. 35. Yamaga R, Ikeda K, Horie-Inoue K, Ouchi Y, Suzuki Y, Inoue S. RNA sequencing of MCF-7 breast cancer cells identifies novel estrogenresponsive genes with functional estrogen receptor-binding sites in the vicinity of their transcription start sites. Horm Cancer. 2013;4:222–232.3. 36. Kirby MK, Ramaker RC, Gertz J, Davis NS, Johnston BE, Oliver PG, et al. RNA sequencing of pancreatic adenocarcinoma tumors yields novel expression patterns associated with long-term survival and reveals a role for ANGPTL4. Mol Oncol. 2016;10:1169–82. 37. Chabner BA. NCI-60 cell line screening: a radical departure in its time. J Natl Cancer Inst. 2016;108. 38. Chen EY, Tan CM, Kou Y, Duan Q, Wang Z, Meirelles GV, et al. Enrichr: interactive and collaborative HTML5 gene list enrichment analysis tool. BMC Bioinformatics. 2013;14:128. 39. Kuleshov MV, Jones MR, Rouillard AD, Fernandez NF, Duan Q, Wang Z, et al. Enrichr: a comprehensive gene set enrichment analysis web server 2016 update. Nucleic Acids Res. 2016;44:W90–7. 40. Marrao G, Habib M, Paiva A, Bicout D, Fallecker C, Franco S, et al. Epstein-Barr virus infection and clinical outcome in breast cancer patients correlate with immune cell TNF-alpha/IFN-gamma response. BMC Cancer. 2014;14:665. 41. Timofte D, Livadariu R, Bintintan V, Diaconu C, Ionescu L, Sandberg AA, et al. Metabolic disorders in patients operated for pancreatic cancer. Rev Med Chir Soc Med Nat Iasi. 2014;118:392–8. 42. Iozzo RV, Sanderson RD. Proteoglycans in cancer biology, tumour microenvironment and angiogenesis. J Cell Mol Med. 2011;15:1013–31. 43. Brown AR, Simmen RC, Simmen FA. The role of thyroid hormone signaling in the prevention of digestive system cancers. Int J Mol Sci. 2013;14:16240–57. 44. Paplomata E, O’Regan R. The PI3K/AKT/mTOR pathway in breast cancer: targets, trials and biomarkers. Ther Adv Med Oncol. 2014;6:154–66. 45. Ernst J, Kellis M. ChromHMM: automating chromatin-state discovery and characterization. Nat Methods. 2012;9:215–6. 46. Osmark P, Hansson O, Jonsson A, Ronn T, Groop L, Renstrom E. Unique splicing pattern of the TCF7L2 gene in human pancreatic islets. Diabetologia. 2009;52:850–4. 47. Zentner GE, Tesar PJ, Scacheri PC. Epigenetic signatures distinguish multiple classes of enhancers with distinct cellular functions. Genome Res. 2011;21: 1273–83. 48. Heintzman ND, Stuart RK, Hon G, Fu Y, Ching CW, Hawkins RD, et al. Distinct and predictive chromatin signatures of transcriptional promoters and enhancers in the human genome. Nat Genet. 2007;39:311–8. 49. Rada-Iglesias A, Bajpai R, Swigut T, Brugmann SA, Flynn RA, Wysocka J. A unique chromatin signature uncovers early developmental enhancers in humans. Nature. 2011;470:279–83.