JOURNAL OF BACTERIOLOGY, Dec. 2001, p. 7341–7353 0021-9193/01/$04.00⫹0 DOI: 10.1128/JB.183.24.7341–7353.2001 Copyright © 2001, American Society for Microbiology. All Rights Reserved.
Vol. 183, No. 24
Transcription Profiling-Based Identification of Staphylococcus aureus Genes Regulated by the agr and/or sarA Loci P. M. DUNMAN,1 E. MURPHY,2 S. HANEY,1 D. PALACIOS,1 G. TUCKER-KELLOGG,3† S. WU,4‡ E. L. BROWN,3 R. J. ZAGURSKY,5 D. SHLAES,1 AND S. J. PROJAN1* Infectious Diseases1 and Department of Bioinformatics,2 Wyeth-Ayerst Research, Pearl River, New York 10965; Department of Genomics, Wyeth-Ayerst Research, Cambridge, Massachusetts 021403; Wyeth-Ayerst Research, Monmouth Junction, New Jersey 08852-95144; and Wyeth-Lederle Vaccines, West Henrietta, New York 145865 Received 2 July 2001/Accepted 26 September 2001
The advent of transcription profiling technologies has provided researchers with an unprecedented ability to study biological processes. Accordingly, a custom-made Affymetrix GeneChip, constituting >86% of the Staphylococcus aureus genome, was used to identify open reading frames that are regulated by agr and/or SarA, the two best-studied regulators of the organism’s virulence response. RNA extracted from wild-type cells and agr, sarA, and agr sarA mutant cells in the early-, mid-, and late-log and stationary phases of growth was analyzed. Open reading frames with transcription patterns expected of genes either up- or downregulated in an agrand/or SarA-dependent manner were identified. Oligonucleotide microarray and Northern blot analyses confirmed that the transcription of several known virulence genes, including hla (alpha-toxin) and spa (protein A), is regulated by each effector and provided insights about the regulatory cascades involved in both alpha-hemolysin and protein A expression. Several putative virulence factors were also identified as regulated by agr and/or SarA. In addition, genes that are involved in several biological processes but which are difficult to reconcile as playing a direct role in the organism’s pathogenesis also appeared to be regulated by each effector, suggesting that products of both the agr and the sarA locus are more-global transcription regulators than previously realized.
Staphylococcus aureus is a major cause of human disease. The organism causes a variety of clinical manifestations, ranging from localized skin infections to severe sepsis, and is a leading cause of hospital-acquired infection (3). Despite advances in antibacterial chemotherapy, S. aureus strains have demonstrated resistance to all currently available antibiotics. Due in part to the immense clinical importance of this organism, an enormous amount of effort has been directed toward identifying the genes and regulatory mechanisms associated with S. aureus pathogenesis. Collectively, this work has demonstrated that the organism’s pathogenesis can be attributed to its capacity to produce a variety of virulence factors (29). The identification of virulence factors and the regulatory networks that influence their expression has been facilitated by the observation(s) that many, if not most, virulence genes are expressed in laboratory cultures. While there is currently a substantial list of staphylococcal virulence factors, it is likely that this list is incomplete and is skewed by the limitations of the experiments used to identify them. Virulence factors that have already been identified generally include (i) bacterial surface proteins that are involved in processes such as adhesion and evasion of the host immune response and (ii) secreted
exoproteins that degrade host tissue(s) and inactivate host defensive mechanisms (29). The genes encoding most virulence factors belong to an extensive regulon that is coordinately regulated in response to a variety of intra- and extracellular signals (1, 5, 21). Octapeptide signaling molecules that are produced as laboratory cultures increase in cell density are the best-studied “stimuli” of the virulence response, mediating a transition in expression of the genes encoding virulence determinants from a predominance of cell surface-expressed genes to a predominance of genes encoding exoproteins (26). The density-dependent regulation of most virulence factors is mediated by regulatory loci such as the accessory gene regulator (agr) and staphylococcal accessory regulator (sarA) loci (9, 19). In the laboratory setting, post-exponential growth activates the agr locus, which contains two divergent promoters, P2 and P3, that direct expression of RNAII and RNAIII transcripts, respectively (19). RNAII encodes four proteins, AgrB, AgrD, AgrC, and AgrA, all of which are required for agrmediated virulence factor regulation (19, 27). AgrD and AgrB act to generate an octapeptide quorum-sensing molecule (autoinducing peptide [AIP]), which, after reaching an extracellular threshold concentration, stimulates activation of AgrC and AgrA, the sensor and regulator, respectively, of a twocomponent regulatory pathway (17–19, 27, 28). Activated AgrA results in the upregulation of RNAII and RNAIII production; the latter is the effector molecule of the agr response (25, 27, 28). RNAIII expression is, in part, responsible for the upregulation of exoprotein production and the downregulation of cell surface protein transcription during the late-log and stationary phases of growth. The manner in which RNAIII
* Corresponding author. Mailing address: Wyeth-Ayerst Research, Department of Infectious Diseases, 401 N. Middletown Rd., Bldg. 205, Rm. 286, Pearl River, NY 10965. Phone: (845) 602-3063. Fax: (845) 602-2480. E-mail:
[email protected]. † Present address: Millennium Predictive Medicine, Cambridge, MA 02139. ‡ Present address: Bristol-Myers Squibb PRI, Bioinformatics, Princeton, NJ 08543-5400. 7341
7342
J. BACTERIOL.
DUNMAN ET AL. TABLE 1. S. aureus strains used in this study
Strain
Relevant genotype
RN27 RN6911
agr⫹ sarA⫹ agr sarA⫹; RN27 derivative with an agr::tetM mutation agr⫹ sarA; RN27 derivative with a sarA::ermC mutation agr sarA; agr mutation in RN6911 transduced into ALC488
ALC488 ALC842
Source or reference
28 8 8
regulates target genes is not yet understood, but it is clear that the molecule acts mainly at the level of transcription. RNAIII also encodes the structural gene for delta-hemolysin, although the transcript, rather than the protein product, acts as a global virulence factor regulator (28). The S. aureus accessory regulatory (SarA) protein also influences both exoprotein and cell surface protein expression (9). The sarA locus contains three overlapping transcripts designated sarA, sarC, and sarB, each of which has a common 3⬘ end encoding SarA (2). SarA binds to conserved regions termed Sar boxes within promoter regions of genes encoding cell surface proteins (spa, encoding protein A), genes encoding exoproteins (hla, encoding alpha-hemolysin), and agr (12). SarA binding to agr promoter elements augments both RNAII and RNAIII transcription and therefore contributes to virulence factor regulation indirectly (7, 13). SarA has also been shown to regulate expression of spa and hla in an agr mutant background, indicating that SarA controls regulation of certain virulence factors directly, in an agr-independent manner. Because RNAIII and/or SarA influences the transcription of most known virulence factors, it was hypothesized that additional, previously uncharacterized potential virulence factors may be identified by analyzing the S. aureus genome for open reading frames (ORFs) that are expressed in an agr- and/or SarA-dependent manner. Furthermore, such an analysis may begin to unravel the overlapping RNAIII and SarA regulatory contributions to known virulence factors. Using an S. aureus GeneChip (Affymetrix), we have identified genes that produce transcript patterns expected of genes regulated by the S. aureus agr and/or sarA locus. In addition to confirming the predicted expression patterns of a number of known virulence factors, and thus validating the methodology, we identified a set of putative virulence factors as being regulated by each effector. Moreover, expression patterns of genes involved in a number of biological processes that are difficult to reconcile as contributing directly to S. aureus pathogenesis produced expression profiles expected of genes regulated in an agr- and/or SarAdependent, density-dependent manner. These results suggest that, in addition to regulating virulence factors, each effector is a more-general transcriptional regulator than previously recognized. MATERIALS AND METHODS Bacterial strains and culture conditions. The S. aureus strains used in this study are listed in Table 1. Strains were grown overnight in 25 ml of brain heart infusion (BHI) medium at 37°C with aeration. Overnight cultures were used to inoculate (1:100 dilution) 1.5 liters of fresh BHI medium. Cultures were incubated with vigorous aeration at 37°C and aliquots were removed at the indicated growth phases as determined by growth phase analysis (data not shown). Cells
from each aliquot were pelleted by centrifugation at 5,000 ⫻ g for 10 min at 4°C in a Beckman JA-10 rotor and were stored at ⫺80°C. RNA extraction. Total bacterial RNA was extracted from samples by resuspending each cell pellet at a concentration of 109 CFU per ml in TE buffer (10 mM Tris-HCl, 1 mM EDTA [pH 8.0]) containing 50 g of lysostaphin (Amicon)/ ml. Resuspensions were incubated at 37°C for 60 min, and 1 ⫻ 1010 to 5 ⫻ 1010 CFU was then applied to a Qiagen RNeasy Maxi column, according to the manufacturer’s recommendations for prokaryotic RNA isolation. RNA concentrations were determined by spectrophotometry (an optical density at 260 nm of 1.0 equals 40 g of RNA/ml). To assess RNA integrity and for Northern blot analysis, 2 g of each RNA sample was electrophoresed in a 1.2% agarose–0.66 M formaldehyde gel, according to Qiagen RNA electrophoresis recommendations. Northern blot analysis. RNA samples were transferred from formaldehydecontaining agarose gels to Biodyne B membranes (Gibco-BRL) by standard molecular procedures. High-stringency hybridization was performed in Kapak/ Scotchpak heat-sealable pouches containing 12 ml of PerfectHyb Plus hybridization buffer (Sigma) and 10 l of radiolabeled randomly primed DNA synthesis products from PCR-generated templates at 42°C. Membranes were subjected to high-stringency washes and were analyzed by phosphorimaging (Bio-Rad Phosphorimager) or densitometry (Bio-Rad). The following PCR primers were used to generate PCR templates: for 16S rRNA (478 nucleotides [nt] of GenBank accession no. Y15856), 5⬘-AAATCTTGACATCCTTTGACAACTC-3⬘ and 5⬘CTAGCTCCTAAAAGGTTACTCCACC-3⬘; for spa (1,999 nt of GenBank accession no. M18264), 5⬘-AAGATTTAATTGAAACAATCCACCA-3⬘ and 5⬘-G ACCAGGTTTGATCATGTTTTTATC-3⬘; for hla (769 nt of GenBank accession no. X01645), 5⬘-TAGGTTCCATATTGATGAATCCTGT-3⬘ and 5⬘ATATTTGTTTGTTGTTTGGATGCTT-3⬘; and for RNAIII (480 nt of GenBank accession no. AF288215), 5⬘-GGGGCTCACGACCATACTTA-3⬘ and 5⬘GGAGTGATTTCAATGGCACA-3⬘. All PCR products were subjected to restriction enzyme analysis and were gel purified prior to labeling reactions. mRNA enrichment, fragmentation, and biotinylation. For mRNA enrichment reactions (240 l), 200 g of total bacterial RNA was mixed with 0.7 M (final concentration) rRNA-specific oligonucleotide mix (5⬘-GATACGGCTACCTTG TT-3⬘, 5⬘-TCAACCTTGCGGTCGTACTC-3⬘, 5⬘-TCCGGATAACGCTTGCC ACC-3⬘, 5⬘-AGCACTTATCCCGTCCACAC-3⬘, 5⬘-CTACAGTAAAGCTCCA CGGG-3⬘, and 5⬘-TCCCCATCACAGCTCAGCCT-3⬘). Aliquots (30 l) were transferred to 0.5-ml thin-walled Eppendorf tubes (Perkin-Elmer), and solutions were incubated at 70°C for 5 min in a thermocycler (Perkin-Elmer). Reverse transcriptase reaction mixture (50 mM Tris-HCl [pH 8.3], 10 mM MgCl2, 75 mM KCl, 10 mM dithiothreitol, 0.5 mM each deoxynucleoside triphosphate, 735 U of RNAguard [Amersham Pharmacia Biotech], and 3,000 U of Moloney murine leukemia virus reverse transcriptase [Epicentre]) was then added. Solutions were incubated at 42°C for 25 min, followed by 45°C for 20 min. For rRNA removal, 0.5 U of RNase H (Epicentre) was added and mixtures were incubated first at 37°C for 45 min and then at 65°C for 5 min. DNase I (0.12 U/l; Amersham Pharmacia Biotech) and 0.225 U of RNAguard were added, and mixtures were incubated at 37°C for 20 min. Reactions were terminated by addition of 10 mM EDTA. Samples were applied to a Qiagen RNeasy minicolumn, according to manufacturer recommendations for RNA clean-up. For RNA fragmentation, 20 g of an mRNA-enriched sample was mixed with fragmentation buffer (1⫻ T4 polynucleotide kinase buffer [New England Biolabs], 70 mM Tris-HCl [pH 7.6], 10 mM MgCl2, 5 mM dithiothreitol) and incubated at 95°C for 30 min and then cooled to 4°C. Samples were then 5⬘-thiolated by addition of 0.1 mM ␥-S-ATP and 1 U of T4 polynucleotide kinase (New England Biolabs) and were incubated at 37°C for 50 min, followed by 65°C for 10 min. Samples were then ethanol precipitated and subsequently biotinylated by addition of 2 mM polyethylene oxide (PEO)-iodoacetyl-biotin and 30 mM morpholinepropanesulfonic acid (MOPS), pH 7.5. Unincorporated biotin molecules were removed by passing RNA mixtures through a Qiagen RNA/DNA minicolumn according to manufacturer recommendations. S. aureus GeneChip design. Preliminary genomic sequence data of the S. aureus COL strain were obtained from The Institute for Genomic Research (TIGR) website (http://www.tigr.org). The sequence consisted of approximately 2,000 contigs, which were concatenated into a single sequence alternating with an 18-nt sequence containing stop codons in all 6 frames. ORF predictions were made using a combination of GLIMMER 1.0 (32) and GeneMark.hmm (23), with a minimum ORF size of 75 nt. In all, 4,528 ORFs, 12 tRNAs, and 3 rRNAs were tiled, with an average of 25 probe sets per ORF. Due to the preliminary state of the genome sequence, many genes are represented on the chip as partial, duplicate, or overlapping fragments. Recent analyses based on the updated sequences of the genomes of COL, NCTC 8325 (OU-ACGT), and MRSA (Sanger Centre) suggest that these 4,528 tilings represent approximately 2,700 to
IDENTIFICATION OF agr- AND/OR SarA-REGULATED GENES
VOL. 183, 2001
2,900 individual genes and that ⬎86% of the S. aureus COL genome is represented on the chip. GeneChip hybridization and washing. Prior to RNA hybridization, S. aureus GeneChips (Affymetrix) were brought to room temperature, washed once with hybridization buffer (100 mM N-morpholinoethanesulfonic acid [MES], 1 M Na⫹, 20 mM EDTA, 0.01% Tween 20), loaded (250 l) with hybridization buffer, and incubated at 45°C for at least 10 min. Hybridization mixture (1.5 g of biotinylated mRNA-enriched RNA, 50 pM oligonucleotide B2 [Affymetrix], 0.1 mg of herring sperm DNA/ml, 0.5 mg of acetylated bovine serum albumin [BSA; Gibco-BRL], and 1⫻ control spike-in cocktail [Genetics Institute] in 1⫻ hybridization buffer) was denatured by incubating at 95°C for 5 min, followed by 45°C for 5 min, and was centrifuged at high speed on a tabletop microcentrifuge for 20 min at room temperature to pellet all nonsolubilized material. A 200-l volume of hybridization mixture was then loaded onto a GeneChip and incubated for 15 h at 45°C. Following hybridization, the RNA-containing mixture was removed and stored at ⫺80°C. GeneChips were then washed 20 times with nonstringent buffer (6⫻ SSPE [1⫻ SSPE is 0.18 M NaCl, 10 mM NaH2PO4, and 1 mM EDTA {pH 7.7}], 0.01% Tween 20, 0.005% antifoam) at 25°C. Chips were then subjected to 60 washes with stringent buffer (100 mM MES, 0.1 M Na⫹, 0.01% Tween 20) at 45°C. Following washing, the hybridized RNA was treated with primary stain (10 g of streptavidin, 2 mg of acetylated BSA) in stain buffer (100 mM MES, 1 M Na⫹, 0.05% Tween 20, 0.005% antifoam) for 10 min at 25°C and was washed 40 times with nonstringent buffer. Next each GeneChip was subjected to a secondary stain containing 2 mg of acetylated BSA, 0.1 mg of goat immunoglobulin G, and 5 g of biotinylated anti-streptavidin (Vector Laboratories) in stain buffer for 10 min at 25°C. The chip-bound RNA molecules were labeled with 10 g of streptavidin-phycoerythrin conjugate (Molecular Probes)/ml in stain buffer for 10 min at 25°C. Excess label was removed by 100 nonstringent washes at 25°C. GeneChip analysis. To increase reproducibility, each experiment was performed in duplicate (RNA extraction from various phases of growth for each strain) and each RNA sample was hybridized to two separate GeneChips. The work here constitutes a total of 16 GeneChips for each strain analyzed. Each GeneChip was scanned at 570-nm, 3-m resolution in an Affymetrix GeneChip scanner. Affymetrix algorithms calculated signal intensities (average difference) and made present or absent determinations for each gene, as previously described (22). Next, to normalize for global systematic variations that could be caused by inconsistencies in loading, each average difference value was divided by the median average difference for a given GeneChip. Normalized intensity values were then averaged for each gene at each growth phase. GeneSpring, version 3.2.11, software (Silicon Genetics, Redwood City, Calif.) was used to plot normalized intensity values across growth phases. GeneSpring algorithms also determined signal strength values for each gene within a strain as the product of the average normalized signal intensity value of the gene of interest and the median normalized signal intensity of the gene taken throughout growth phases. To identify genes that are below the detection limit of the system, the signal strengths indicative of genes with profiles at the level of noise were determined for each strain as the average signal strength of genes considered absent (via GeneChip algorithms) plus 2 standard deviations. Identification of Sar boxes. Intergenic regions were identified within the S. aureus N315 genome by comparing ORF nucleotide coordinates (20). Putative Sar boxes (12) were identified using the Genetics Computer Group (Madison, Wis.) program (Wisconsin Sequencing Package).
RESULTS Identification of S. aureus virulence factors. In the laboratory setting, expression of many S. aureus virulence factors follows a predictable pattern. Cell surface virulence factors, such as protein A (encoded by spa), are predominately expressed during early-log-phase growth, but as the density of a growing culture increases, transcription of these genes decreases. Genes encoding extracellular virulence factors, such as alpha-toxin (encoded by hla), demonstrate a reciprocal phenotype; they tend to be transcribed at basal levels during earlylog-phase growth and are upregulated at higher cell densities. This density-dependent regulation of most virulence determinants can be controlled by a product of the agr locus, RNAIII, and/or SarA. Although there is currently a sizeable list of RNAIII- and
7343
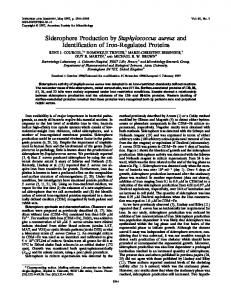
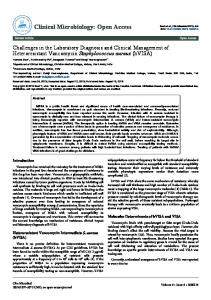
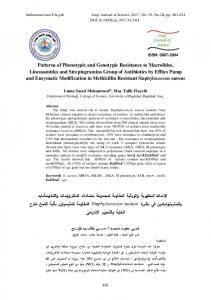
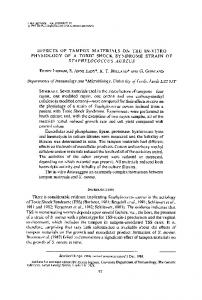
SarA-regulated putative virulence factors, it seems likely that this list is incomplete and that an expansion of known virulence factors is needed to better understand S. aureus pathogenic processes. In an effort to identify previously unrecognized agrand/or SarA-regulated genes, we performed transcription profiling on RNA samples extracted from wild-type cells (RN27) and agr (RN6911), sarA (ALC488), and agr sarA (ALC842) mutant cells during various phases of growth (early-, mid-, and late-log and stationary phases). agr regulation by SarA. To validate the transcription profiling methodology used, we first investigated whether the agr locus transcripts, RNAII and RNAIII, produced expression patterns mimicking previously reported data. It is well established that agr is temporally regulated in a growth phasedependent manner. Basal levels of RNAII and RNAIII are detected during early-log-phase growth; transcription subsequently increases as cells progress through growth phases (16, 34). Additionally, Cheung and colleagues have shown that SarA interacts with agr promoter regions and facilitates RNAII and RNAIII transcription (7, 15). As expected, transcription profiling of RNA extracted from cells at various phases of growth demonstrated that both RNAII and RNAIII production increased (4.8- and 5.7-fold, respectively) as wild-type cells (RN27) transitioned from the early-log to stationary phase of growth, with maximal expression detected during post-exponential growth (Fig. 1A and B). In contrast, both RNAII and RNAIII transcript levels were below the detection limits of the system in agr (RN6911) and agr sarA (ALC842) mutant cells (Fig. 1A and B). Moreover, Affymetrix GeneChip software analysis (see Materials and Methods) of RNA samples from RN6911 and ALC842 cultures determined that the genes constituting RNAII (agrA, agrB, agrC, and agrD) and RNAIII transcripts were absent in all phases of growth (data not shown). As shown in Fig. 2A, these results correlate well with those obtained by Northern analysis, which indicated that RNAIII was induced 14.2-fold in RN27 cells during post-exponential growth but was not detectable in RN6911 cells. Furthermore, our transcription profiling data (Fig. 1B) demonstrated a ⬃2.6-fold decrease in RNAIII production by a sarA mutant strain (ALC488) during stationary-phase growth, in comparison to wild-type transcript levels, confirming that SarA is required for wild-type levels of agr transcription. Collectively these results indicate that our transcription profiling data are in good agreement with previous observations and confirm that both RNAII and RNAIII are expressed in a cell density-dependent manner. agr and SarA regulation of alpha-toxin. To further validate the methodology and extend our knowledge about the transcription of the well-studied agr-regulated exoprotein alphatoxin (encoded by hla), we investigated whether our transcript profiles correlated well with published hla expression patterns. It has been shown that RNAIII production promotes hla expression, with maximum levels being reached at the post-exponential phase of growth (6, 34). As shown in Fig. 1C, transcription profiling results demonstrated a 39-fold increase in hla transcription in wild-type (RN27) cells as they transitioned from the early-log to stationary phase of growth, and these results were in good agreement with the 20.9-fold increase seen in our Northern analysis (Fig. 2B). In contrast, the increase in transcription was reduced to 2.2-fold in RN6911 cells
7344
DUNMAN ET AL.
J. BACTERIOL.
FIG. 1. Transcription profiles of known RNAIII and SarA-regulated genes. Transcript levels for wild-type (䊐), agr mutant (Œ), sarA mutant (■), and agr sarA double-mutant (}) cells were measured during the early-, mid-, and late-log and stationary phases of growth (x axis). Data points were plotted as relative intensity values (y axis) (as described in Materials and Methods). (A) Average signal intensities for genes constituting RNAII transcripts (agrB, agrD, agrC, and agrA). (B) Signal intensities of RNAIII transcripts. (C) Profiles of alpha-toxin (hla) transcript titers. (Inset) agr and agr sarA mutant results. (D) Profiles of protein A (spa) transcript titers.
FIG. 2. Northern blot analysis of known agr-regulated genes. Shown are levels of RNAIII (A), hla (B), spa (C), and rRNA (D) transcripts during the early-, mid-, and late-log and stationary phases of growth of wild-type (RN27) or agr mutant (RN6911) cells. Signal intensities were determined by densitometry and normalized to rRNA signals. Normalized relative signal intensities are shown below each panel.
(Fig. 1C), confirming that a product of the agr locus mediates hla upregulation during the post-exponential phase. These results also indicate that an additional regulatory mechanism(s) may account for the slight (2.2-fold) increase in hla expression in agr mutant cells. Indeed, SarA binding sites have been identified within the hla promoter region, and SarA has been shown to bind directly to the promoter region and induce hla expression in an agr-independent manner (6, 12). To determine whether this modest increase in expression could be attributed to SarA, as opposed to an additional virulence regulator(s), the profiles of hla transcripts were compared for various growth phases of sarA and agr sarA mutant cells. As expected, hla expression was marginally induced in post-exponential sarA mutant cells (Fig. 1C). However, because SarA is necessary for complete expression of agr, the strain is effectively agr deficient and the observed reduction in hla expression may be a direct consequence of decreased production of RNAIII (10, 12). Yet hla was constitutively transcribed during various phases of growth in agr sarA mutant (ALC842) cells (Fig. 1C), confirming that SarA both directly and indirectly regulates alpha-hemolysin transcription. Interestingly, GeneChip analysis (see Materials and Methods) determined that hla
VOL. 183, 2001
IDENTIFICATION OF agr- AND/OR SarA-REGULATED GENES
transcripts were present in all phases of ALC842 growth (data not shown), implying that neither regulator is required for basal levels of alpha-hemolysin transcription. In addition, these results suggest that both RNAIII and SarA are required for wild-type levels of hla transcription during post-exponential aerobic growth. agr and SarA regulation of protein A. It has previously been shown that wild-type S. aureus transcribes spa during early-logphase growth and that its transcription is reduced when RNAIII is produced. Conversely, spa is transcribed at a high level throughout all phases of growth in an agr-null strain (34). The spa promoter contains SarA boxes (12). Both Northern analysis and spa-reporter fusion studies have shown that SarA is a repressor of protein A transcription (4, 10). To determine whether transcription profiling could identify genes known to be downregulated by each effector, we compared the protein A (spa) transcript profiles of each strain. As shown in Fig. 1D, wild-type cells maximally expressed spa at early- and mid-log phases of growth, and transcription decreased 6.8-fold as cells entered stationary phase. A similar phenotype (a 7.2-fold decrease) was observed by Northern analysis (Fig. 2C). Comparison of signal strengths (see Materials and Methods) demonstrated that agr mutant cells expressed high levels of spa throughout all phases of growth (average normalized signal strength value, 1,031.5, as opposed to 170.8 in wild-type cells), confirming that the agr locus is a potent repressor (⬎5-fold) of spa transcription. Northern blot analysis (Fig. 2C) confirmed those observations. Transcription profile analysis also revealed that, like agr mutant cells, spa transcription is significantly increased, across all growth phases, in the sarA mutant (Fig. 1D). This finding is in good agreement with previously published spa expression levels in sarA mutant cells (8). agr-stimulated ORF identification. Given the level of correlation between the transcription profiling data obtained in this study and previously reported results for RNAII, RNAIII, hla, and spa expression, we felt comfortable searching for genes that were previously unrecognized as being regulated by the agr and/or sarA locus. To identify genes upregulated by a product of the agr locus, we took advantage of the observation that transcription of most identified agr-upregulated virulence genes, such as hla, increases with cell density in wild-type cells but does not increase in a density-dependent manner in agr mutant cells. Using GeneSpring software, we were able to compare transcript profiles of genes by analyzing RNA samples taken during various phases of growth from wild-type cells and agr (RN6911), sarA (ALC488), and agr sarA (ALC842) mutant cells. Genes demonstrating transcript patterns expected of those upregulated in an RNAIII-dependent manner were identified by querying for genes that were upregulated at least 2- and 1.5-fold as wild-type and ALC488 cells, respectively, moved from the early-log to the stationary phase of growth but were not upregulated 2-fold or were expressed at background levels in RN6911 and ALC842 cells. Alternatively, genes that were constitutively expressed in wild-type cells but were expressed at twofold-lower levels in both RN6911 and ALC842 cells were likely to be stimulated by a product of the agr locus. In each case the gene also had to be determined to be present in at least one wild-type stationary-phase sample, according to Affymetrix GeneChip software restrictions (Table 2). As expected, genes constituting the agr RNAII transcript
7345
(agrB, agrD, agrC, and agrA) produced the looked-for transcript profiles. Likewise, RNAIII (hld, encoding delta-hemolysin) appeared to be induced in an agr-dependent manner. Several known RNAIII-inducible genes were also identified, including splA, splB, splD, and splF (encoding serine protease) and hla (encoding alpha-toxin) (30, 31). Other extracellular virulence factors, such as hlgB and hlgC (encoding gammahemolysin) and geh (encoding lipase), were also identified. Identification of agr-repressed ORFs. Table 3 lists 64 genes that produced transcript patterns expected of genes downregulated in an agr-dependent manner. These genes appeared to be transcribed at levels at least twofold higher in stationary-phase agr mutant cells than wild-type cells. Additionally, genes were considered present in at least one wild-type stationary-phase sample, according to GeneChip software restrictions. As expected, known RNAIII-downregulated genes, such as spa (34), were detected. Several additional cell wall-associated proteins, such as dlt (involved in teichoic acid linkage to cell wall and resistance to defensins), isaA (cell wall secretory protein), and mnhA, mnhF, and mnhG (constituting a heterologous surface receptor) are potentially repressed by agr. Effects of SarA on agr-regulated genes. As shown in Fig. 1A and B, SarA is required for wild-type levels of agr transcription. More specifically, RNAII and RNAIII transcripts were decreased ⬃2.6-fold (⫾0.6-fold) in sarA mutant (ALC488) cells. Extending this observation, we identified potential agr-stimulated genes (Table 2) that demonstrate a similar fold reduction (within 2 standard deviations) in ALC488 cells. Genes meeting this criterion are presumed to be indirectly regulated by SarA and are indicated in Table 2. Likewise, genes suspected to be downregulated by agr (Table 3) that demonstrated a similar fold increase in transcript levels in ALC488 cells may be indirectly regulated by SarA, as indicated in Table 3. However, it should be kept in mind that RNAIII production has different regulatory effects on responsive genes (i.e., hla is dramatically upregulated in the presence of RNAIII, whereas expression of other genes, such as tst [encoding toxic shock syndrome toxin 1], is stimulated to a lesser extent) (26). Therefore, caution should be exercised in further interpreting these results. Yet comparison of genes determined to be directly regulated by SarA (described below) is in good agreement with our indirect SarA analysis. Identification of SarA-upregulated genes. A series of transcription profile comparisons were performed to identify genes expected to be upregulated by SarA in a density-dependent manner. First, genes upregulated at least twofold as wild-type cells transition from early-log to stationary phase were identified. Additionally, transcripts had to be considered present within wild-type stationary-phase samples by Affymetrix GeneChip analysis. From this list, genes that were expressed at twofold-lower levels in stationary-phase sarA mutant cells than in wild-type cells were identified. We rationalized that this decrease in expression within the sarA mutant could most likely be due to either (i) a direct loss of SarA activator function or (ii) an indirect consequence of the sarA mutation, which decreases production of RNAIII and/or other transcriptional activators and reduces transcription of an agr-responsive gene. To distinguish between these two possibilities, transcription profiles (of genes fitting the criteria above) of agr and agr sarA mutant cells were compared. Genes directly activated by
7346
DUNMAN ET AL.
J. BACTERIOL. TABLE 2. agr-upregulated genes
ORF
a
Gene
b
373 591 3298 831 4897
pyrAA
Pattern
c
SarA effect
cap5J dps fmt
1 (1) 1 (1) 1 (2) 2 (2) 1 (2)
Up Up Up Indirect Indirect
4084 422
arcA arcB
2 (2) 1 (1)
Indirect Indirect
1220 1321 5609 3360 997 774 1001
arcC aroC cpsA gltB hutG hutH hutI
2 (3) 1 (1) 1 (1) 1 (2) 1 (1) 2 (3) 2 (2)
Down Up Indirect Indirect Up Indirect Indirect
1000 4969 2628 6 7
hutU ocd pepF sdhA sdhB
1 (1) 1 (1) 2 (3) 1 (3) 1 (2)
Indirect Indirect Up Indirect Up
1765
epiF
1 (2)
Up
4746 3699 1142 1132 5455 2618
epiP
1 (2) 1 (1) 1 (2) 1 (1) 1 (4) 1 (1)
Up Up
4659 3390 3585
moaB recQ rocA
1 (2) 1 (6) 1 (2)
Indirect Indirect Indirect
4103
pckA
1 (2)
Indirect
3898
crtN
1 (2)
Up
agrA agrB agrC agrD odhA odhB arcR
1 (2) 1 (1) 1 (1) 1 (3) 1 (1) 1 (1) 1 (1) 2 (2) 1 (1) 6 (6) 2 (2) 1 (1)
Indirect Indirect Indirect Indirect Indirect Indirect Indirect Indirect Indirect Indirect Indirect Down
pyrR
1 (2)
Indirect
3806
2 (3)
Indirect
5259
1 (3)
Up
2852
1 (1)
Up
882 1399 1398 5163 1044 2444 1426 2443 1425 884 885 1221 4367
femB
chiB
Indirect
5005 421 4309
arcD fhuD
1 (2) 2 (2) 1 (2)
Indirect Indirect Up
5224
gltP-2
2 (4)
Indirect
2883
lysP
1 (1)
Indirect
d
Functione
Fold changef
N315 ORFg
Carbamoyl-phosphate synthetase Cytidylate kinase Capsule gene General stress protein 20U Methionyl-tRNA formyltransferase Arginine deaminase Aspartate/ornithine carbamoyltransferase Carbamate kinase Chorismate synthetase Amino acid amidohydrolase Glutamate synthase Arginase Histidine ammonia-lyase Imidazolone-5-propionate hydrolase Uroconate hydratase Ornithine-cyclodecarboxylase Peptidase L-Serine deaminase L-Serine dehydratase beta subunit ABC-type multidrug transport system Serine protease Antibacterial peptide synthesis Bacteriophage gene Putative integrase activator mec resistance UTP-glucose-1-phosphate uridylyltransferase Molybdenum cofactor Probable DNA helicase NAD-dependent aldehyde dehydrogenases Phosphoenolpyruvate carboxykinase Putative phytoene dehydrogenase Acyl-coenzyme A dehydrogenase Predicted chitinase B Predicted chitinase B Putative GTPase Cysteine sulfinate desulfinase agr response agr response agr response agr response 2-Oxoglutarate dehydrogenase 2-Oxoglutarate dehydrogenase Transcriptional regulator, Crp/Fnr family Transcriptional attenuator, pyrimidine biosynthesis Transcriptional regulator, RpiR family Transcriptional regulator, GntR family Putative transcriptional regulator, GntR family Acetyltransferases Arginine/ornithine antiporter Ferrichrome-binding periplasmic proteins Proton/sodium-glutamate transport Lysine-specific permease
3.3 2.3 3.6 3.0 2.8
SA1045 SA0515 SA0153 SA1941 SA1059
Nucleic acid metabolism Nucleic acid metabolism Adaptation Adaptation Aminoacyl tRNA synthetases
5.7 8.7
SA2428 SA2427
Amino acid metabolism Amino acid metabolism
7.9 3.1 2.6 2.3 4.5 4.0 41.5
SA2425 SA1299 SA0507 SA0431 SA2125 SA0008 SA2121
Amino Amino Amino Amino Amino Amino Amino
acid acid acid acid acid acid acid
metabolism metabolism metabolism metabolism metabolism metabolism metabolism
23.3 2.5 3.4 6.5 7.6
SA2122 SA0113 SA1216 SA2318 SA2319
Amino Amino Amino Amino Amino
acid acid acid acid acid
metabolism metabolism metabolism metabolism metabolism
2.4
Role categoryh
Sar boxi
Yes Upstream Yes
Antibiotic production
2.5 5.1 2.3 3.6 2.2 2.6
SA0173 SA1786 SAS062 SA1207
Antibiotic production Antibiotic production Bacteriophage related Bacteriophage related Cell wall Cell wall
2.7 2.8 2.7
SA2070 SA0676 SA2341
Coenzyme metabolism DNA replication Electron transport
3.6
SA1609
Glycolysis
2.1
SA2351
Lipid metabolism
2.2 2.8 2.7 2.7 2.9 5.8 3.4 4.8 5.9 2.3 3.1 18.9
SA2080 SA0914 SA0914 SA1086 SA1450 SA1844 SA1842 SA1843 SAS066 SA1245 SA1244 SA2424
Lipid metabolism Miscellaneous Miscellaneous Miscellaneous Miscellaneous Signal transduction Signal transduction Signal transduction Signal transduction TCA cycle TCA cycle Transcriptional regulation
2.8
SA1041
Transcriptional regulation
2.5
SA0187
Transcriptional regulation
5.2
SA0434
Transcriptional regulation
2.4
SA1120
Transcriptional regulation
3.0 6.4 3.2
SA2052 SA2426 SA2079
Translation Transport Transport
4.3
SA0368
Transport
2.3
SA1505
Transport
Upstream Yes Upstream Upstream
Upstream
Yes
Continued on following page
IDENTIFICATION OF agr- AND/OR SarA-REGULATED GENES
VOL. 183, 2001
7347
TABLE 2—Continued ORF
a
Gene
b
Pattern
c
SarA effect
2606
opp-1F
1 (3)
Indirect
2601 3147
opp-2B potD
1 (3) 1 (2)
Up Indirect
1 (1) 2 (2)
Indirect Indirect
1 (1) 1 (1) 1 (3) 2 (4) 2 (2) 2 (2) 1 (2) 1 (2) 1 (2) 1 (1) 1 (2) 1 (1) 1 (2) 1 (2) 1 (1) 1 (1) 1 (2) 1 (1) 1 (1) 1 (1) 1 (1) 1 (1) 1 (2) 1 (1) 1 (1) 1 (3) 1 (5) 3 (6) 2 (2) 1 (1) 2 (2) 1 (1) 1 (1) 2 (2) 1 (2)
Indirect Indirect Up Indirect Indirect
1 (3) 2 (2) 1 (1) 2 (2) 2 (2) 1 (1) 1 (10)
Indirect Indirect Up Up Up Down
1029
1 (2)
Up
4374 5147
2 (2) 3 (15)
Up Indirect
4523
2 (2)
Up
2978 922 2096 987 992 2756 3090 4927 4370 2479 2782 2054 2065 2394 2122 1555 9 37 3982 237 644 203 1494 2275 2617 2827 2968 5500 3653 396 583 4061 1427 1928 1927 667 1175
veg
2036 2928 2929 324 327 2175 2927
set8 splA splB splD splF sspC
a
aur clfB geh hla hld hlgB hlgC lip pls
Up Up Indirect Indirect Indirect Indirect Up Up Up Up Indirect Up Down Indirect Up Indirect Indirect Indirect Indirect Indirect Indirect Indirect Up Indirect Up Up Up
d
Functione
Oligopeptide transporter, ATPase domain Oligopeptide transporter Spermidine/putrescine transport protein D ABC-type Mn/Zn transporter ABC-type Mn/Zn transport system component Conserved hypothetical Conserved hypothetical Conserved hypothetical Conserved hypothetical Conserved hypothetical Hypothetical protein Predicted membrane protein Conserved hypothetical Conserved hypothetical Conserved hypothetical Acetyltransferase Hypothetical protein Hypothetical protein Conserved hypothetical Hypothetical protein Hypothetical protein Hypothetical protein Hypothetical protein Hypothetical protein Hypothetical protein Hypothetical protein Hypothetical protein Hypothetical protein Aureolysin Clumping factor B Lipase (glycerol ester hydrolase) Alpha-toxin Delta-hemolysin Gamma-hemolysin component B Gamma-hemolysin component C Lipase Related to surface protein LPXTG motif Exotoxin 2 Serine protease Serine protease Serine protease Serine protease Protease Similar to streptococcal adhesin Emb Related to map protein-surface protein Surface protein map Homolog of streptococcal hemagglutinin Phenol-soluble modulin beta 2
Fold changef
N315 ORFg
2.3
SA2251
Transport
2.4 2.3
SA1214 SA0953
Transport Transport
2.5 2.7
SA0588 SA0589
Transport Transport
2.7 12.6 14.3 7.0 2.2 3.0 3.4 7.0 2.3 2.4 3.0 2.2 3.4 2.0 3.6 17.3 4.7 2.1 5.7 3.2 2.3 2.4 2.1 4.3 2.3 2.3 2.8 2.7 3.5 38.8 7.9 48.6 6.3 3.4 3.3
SA0452 SA0170 SA0174 SA0184 SA0185 SA0271 SA1037 SA1275 SA1319 SA1379 SA1436 SA1684 SA2128 SA2161 SA2321 SA2343 SA2491 SAS013 SAS016
SA0309 SA1007 SAS065 SA2209 SA2208 SA2463 SA2284
Unknown Unknown Unknown Unknown Unknown Unknown Unknown Unknown Unknown Unknown Unknown Unknown Unknown Unknown Unknown Unknown Unknown Unknown Unknown Unknown Unknown Unknown Unknown Unknown Unknown Unknown Virulence Virulence Virulence Virulence Virulence Virulence Virulence Virulence Virulence
factors factors factors factors factors factors factors factors factors
2.2 2.5 9.6 ND 11.3 2.4 3.0
SA0384 SA1631 SA1630 SA1628 SA1627 SA0899 SA1268
Virulence Virulence Virulence Virulence Virulence Virulence Virulence
factors factors factors factors factors factors factors
7.7
SA2006
Virulence factors
3.1 3.1
SA2006 SA2447
Virulence factors Virulence factors
6.2
SA2430
Role categoryh
Sar boxi
Yes
Yes Upstream
Upstream Yes Yes Upstream Yes Yes
Yes Upstream Upstream Upstream
Virulence factors
Designated S. aureus GeneChip ORF number. Previously described gene name. Many genes are represented on the S. aureus GeneChip in a redundant manner as full or partial fragments. Values are the number of times a gene transcript was identified as fitting a pattern (number of times the gene was either partially or completely represented on the GeneChip). d Expected SarA contribution to agr-regulated gene transcription. e Previously described gene product function. f Fold change in expression of agr-regulated genes as cells transition from the early-log to the stationary phase of growth. g Corresponding designated S. aureus strain N315 gene (20). h Expected metabolic role. TCA, tricarboxylic acid. i Yes, putative Sar box identified within the gene’s promoter region. Upstream, the gene is expected to be part of an operon with a potential Sar box located in an upstream promoter region. b c
7348
DUNMAN ET AL.
J. BACTERIOL. TABLE 3. agr-downregulated genes
ORFa
Geneb
2515 bsaA 1889 ald 5061 bfmBAB
Patternc
1 (2) 2 (2) 1 (2)
626 1888 1664 482 4571 2000 625 4186
nasE tdcB ddh treA folD hemL sirB thiD
1 (3) 2 (2) 1 (2) 1 (1) 1 (2) 1 (4) 1 (3) 1 (2)
5593 777 5293 2092 3524 622 4539 1366 483 1505 1732 4405 952 481 4806 1887 2206 121 100 4122 4081 3910 1941
dinG2 gyrA mnhA mnhF narG narJ hit
1 (4) 2 (7) 1 (7) 1 (1) 2 (9) 1 (2) 1 (2) 1 (2) 1 (3) 1 (2) 1 (3) 1 (2) 1 (2) 1 (1) 2 (4) 2 (3) 1 (2) 1 (3) 1 (2) 1 (2) 2 (2) 1 (2) 3 (3)
pth dltD glpF opuD treP
spa ssaA
SarA effectd
Down
Down
Down
Down Down Down
Functione
Glutathione peroxidase Alanine dehydrogenase Thiamine pyrophosphate-dependent dehydrogenases Assimilatory nitrite reductase Threonine dehydratase D-specific D-2-hydroxyacid dehydrogenase Alpha-glucosidase 5,10-Methylene-tetrahydrofolate dehydrogenase Glutamate-1-semialdehyde aminotransferase S-adenosyl-L-methionine Hydroxymethylpyrimidine/phosphomethylpyrimidine kinase Putative ATP-dependent DNA helicase DNA gyrase Multisubunit Na⫹/H⫹ antiporter Multisubunit Na⫹/H⫹ antiporter Anaerobic dehydrogenases Nitrate reductase Diadenosine tetraphosphate (Ap4A) hydrolase Protease related to collagenase Transcriptional regulator, GntR family Peptidyl-tRNA hydrolase DttD protein Glycerol uptake facilitator Choline-glycine betaine transporter Phosphotransferase system IIC component Putative efflux membrane protein Amino acid permease Putative glucarate transporter Conserved hypothetical Conserved hypothetical Conserved hypothetical Protein A Secretory antigen precursor Myosin cross-reactive antigen
Fold changef
N315 ORFg
5.8 11.9 26.8
SA1146 SA1272 SA1347
Adaptation Amino acid metabolism Amino acid metabolism
115.7 33.8 2.5 10.8 6.5 10.9 ND 3.7
SA2187 SA2312 SA0433 SA0915 SA1491 SA2186 SA0537
Amino acid metabolism Amino acid metabolism Carbohydrate metabolism Carbohydrate metabolism Coenzyme metabolism Coenzyme metabolism Coenzyme metabolism Coenzyme metabolism
4.7 6.2 5.1 11.5 93.4 ND 2.7 3.0 6.5 2.2 58.3 3.9 3.0 13.1 18.4 ND 4.6 ND 34.0 11.5 4.4 17.0 2.8
SA1288 SA0006 SA0813 SA0808 SA2185 SA2183 SA1656 SA1441 SA0434 SA0460 SA0796 SA1140 SA1183 SA0432 SA1269 SA1270 SA2300 SA0212 SA0412 SA2378 SA0107 SA2093 SA0102
DNA replication DNA replication Electron transport Electron transport Electron transport Electron transport Miscellaneous Miscellaneous Transcriptional regulation Translation elongation Transport Transport Transport Transport Transport Transport Transport Unknown Unknown Unknown Virulence factors Virulence factors Virulence factors
Role categoryh
Sar boxi
Yes
Yes Yes Yes
a
Designated S. aureus GeneChip ORF number. b Previously described gene name. c Many genes are represented on the S. aureus GeneChip in a redundant manner as full or partial fragments. Values are the number of times a gene transcript was identified as fitting a pattern (number of times the gene was either partially or completely represented on the GeneChip). d Expected SarA contribution to agr-regulated gene transcription. e Previously described gene product function. f Fold change in expression of agr-regulated genes as cells transition from the early-log to the stationary phase of growth. ND, not determined. g Corresponding designated S. aureus strain N315 gene (20). h Expected metabolic role. i Yes, putative Sar box identified within the gene’s promoter region. Upstream, the gene is expected to be part of an operon with a potential Sar box located in an upstream promoter region.
SarA could be identified as transcripts showing twofold reduction in stationary-phase agr sarA double-mutant cells relative to agr mutant cells. Several ORFs, including known SarAactivated genes, demonstrated background expression levels in agr mutant cells and were considered potentially activated by SarA (Table 4). Additionally, genes transcribed at twofoldhigher levels in stationary-phase agr mutant cells are listed in Table 4. As expected our analysis identified several known SarA-upregulated virulence genes, including agrB, agrD, agrC, agrA, hld, and hla (6, 8, 13, 15). Additionally, other virulence factors, such as gamma-hemolysin, were determined to be upregulated by SarA. Potential SarA contributions, as defined by the above criteria, to the agr-regulated genes are listed in Tables 2 and 3. Identification of SarA-downregulated genes. SarA-downregulated genes were identified as producing at least twofold-
higher transcript levels in stationary-phase sarA mutant cells than in wild-type cells. Additionally, genes were considered present in at least one wild-type stationary-phase sample, as determined by GeneChip analysis. Genes with transcript levels meeting these criteria could include (i) genes that are directly repressed by SarA, in which case the absence of SarA allows for increased gene expression, or (ii) genes repressed by RNAIII, whereby decreased agr transcription allows derepression of gene expression. To distinguish between these two possibilities, transcript patterns of these genes were further compared in agr and agr sarA mutant cells. Genes directly repressed by SarA could be identified as producing elevated transcript levels in stationary-phase double-mutant cells compared to agr mutant cells (or at background levels). Table 5 lists genes that were determined to be downregulated by SarA in a cell density-dependent manner.
IDENTIFICATION OF agr- AND/OR SarA-REGULATED GENES
VOL. 183, 2001
7349
TABLE 4. SarA-upregulated genes ORF
a
3298 1321 997 452 2628 7 821 1765 4746 4442 3688 1973 184 2497 3495 600 4757 3095 3733 3898 797 373 783 1118 2444 1426 2443 1425 2944 5259 2852 1545 4309 614 2601 271 272 4602 4200 992 243 2095 2634 4370 890 2479 2782 2785 5283 5066 4929 5521 2505 1555 9 37 3982 644 2105 2275 4044 3636 4061 4578 1928 1927 366 4374
Gene
b
capJ aroC hutG metK pepF sdhB epiF epiP rodA femA tagF uppS dnaG BH2391 crtN purA pyrAA rpmH queA agrA agrB agrC agrD phoP prfA fhuD gltS opp-2B
fnbA fnbB hla hld hlgB hlgC hsa map
Pattern
1 (2) 1 (1) 1 (1) 1 (2) 1 (4) 1 (2) 1 (2) 1 (2) 1 (2) 1 (2) 1 (7) 1 (3) 1 (2) 1 (2) 1 (4) 1 (3) 1 (2) 1 (2) 1 (1) 1 (2) 1 (3) 1 (1) 1 (1) 2 (4) 1 (1) 1 (1) 2 (2) 1 (1) 1 (1) 1 (3) 1 (2) 1 (1) 1 (2) 1 (1) 1 (4) 1 (3) 1 (2) 1 (2) 1 (2) 1 (3) 1 (1) 1 (1) 1 (3) 1 (2) 1 (2) 1 (2) 1 (2) 2 (6) 1 (2) 1 (2) 1 (2) 1 (2) 1 (2) 1 (2) 1 (1) 1 (1) 1 (2) 1 (1) 1 (2) 1 (1) 1 (7) 1 (3) 1 (1) 2 (2) 1 (5) 1 (2) 1 (X) 3 (3)
c
Functiond
N315 ORFe
Role categoryf
Capsule gene Chorismate synthetase Arginase S-Adenosylmethionine synthetase Peptidase L-Serine dehydratase Acetyltransferase Epidermin-like biosynthetic cluster Serine protease Bacteriophage protein Predicted membrane protein Cell division membrane protein mec resistance Glycosyl/glycerophosphate transferases Undecaprenyl diphosphate synthase Putative glycosyltransferases 6-Pyruvoyl-tetrahydropterin synthase DNA primase Short-chain alcohol dehydrogenases Putative phytoene dehydrogenase Adenylosuccinate synthase Carbamoyl-phosphate synthetase Ribosomal protein L34 S-Adenosylmethionine agr response agr response agr response agr response Response regulator Transcriptional regulator, GntR family Putative transcriptional regulator Protein chain release factor A Ferrichrome-binding periplasmic protein Glutamate permease Putative oligopeptide transporter Putative permease Putative transport Bmr-like protein
SA0153 SA1299 SA2125 SA1608 SA1216 SA2319 SA1931
Adaptation Amino acid metabolism Amino acid metabolism Amino acid metabolism Amino acid metabolism Amino acid metabolism Amino acid metabolism Antibiotic production Antibiotic production Bacteriophage related Bacteriophage related Cell division Cell wall Cell wall Cell wall Cell wall Coenzyme metabolism DNA replication Lipid metabolism Lipid metabolism Nucleic acid metabolism Nucleic acid metabolism Ribosomal proteins RNA modification Signal transduction Signal transduction Signal transduction Signal transduction Transcriptional regulation Transcriptional regulation Transcriptional regulation Translation termination Transport Transport Transport Transport Transport Transport Unknown Unknown Unknown Unknown Unknown Unknown Unknown Unknown Unknown Unknown Unknown Unknown Unknown Unknown Unknown Unknown Unknown Unknown Unknown Unknown Unknown Unknown Virulence factors Virulence factors Virulence factors Virulence factors Virulence factors Virulence factors Virulence factors Virulence factors
Conserved hypothetical Conserved hypothetical Hypothetical protein Unknown Conserved hypothetical Conserved hypothetical Hypothetical protein Conserved hypothetical Conserved hypothetical Conserved hypothetical Hypothetical protein Hypothetical protein Hypothetical protein Acetyltransferase Hypothetical protein Hypothetical protein Conserved hypothetical Hypothetical protein Conserved hypothetical Hypothetical protein Fibronectin binding protein A Fibronectin binding protein B Alpha-toxin Delta-hemolysin Gamma-hemolysin component B Gamma-hemolysin component C Homolog of streptococcal hemagglutinin Map protein
SA1786 SA2436 SA1888 SA1206 SA0244 SA1103 SA0523 SA0666 SA1391 SA1123 SA2351 SA0016 SA1045 SAS093 SA1466 SA1844 SA1842 SA1843 SAS066 SA1516 SA0434 SA1120 SA1920 SA2079 SA2135 SA1214 SA0099 SA0100 SA2241 SA0085 SA0174 SA0350 SA0453 SA0754 SA1037 SA1240 SA1275 SA1319 SA1388 SA1611 SA1684 SA1889 SA1928 SA1944 SA2161 SA2321 SA2343 SA2491 SAS016 SA2291 SA2291 SA1007 SAS065 SA2209 SA2208 SA2447 SA2006
Sar boxg
Yes
Yes
Upstream Yes Upstream Upstream Yes
Yes Upstream
Yes
Yes Yes Upstream Yes
Continued on following page
7350
DUNMAN ET AL.
J. BACTERIOL. TABLE 4—Continued
ORF
a
Gene
b
Pattern
1175
pls
1 (2)
2343 2037 5329 2929 324 327 4523
sdrc set9 splA splB splD splF
2 (2) 1 (4) 1 (2) 1 (1) 1 (1) 2 (2) 2 (2)
c
Functiond
N315 ORFe
Related to Pls and accumulationassociated proteins, LPXTG motif Surface protein (SdrC) Staphylococcal exotoxin Serine protease Serine protease Serine protease Serine protease Phenol soluble modulin beta 2
Role categoryf
SA2284
Virulence factors
SA0385 SA1631 SA1630 SA1628 SA1627
Virulence Virulence Virulence Virulence Virulence Virulence Virulence
factors factors factors factors factors factors factors
Sar boxg
Yes Upstream Upstream Upstream
a
Designated S. aureus GeneChip ORF number. Previously described gene name. Many genes are represented on the S. aureus GeneChip in a redundant manner as full or partial fragments. Values are the number of times a gene transcript was identified as fitting a pattern (number of times the gene was either partially or completely represented on the GeneChip). d Previously described gene product function. e Corresponding designated S. aureus strain N315 gene (20). f Expected metabolic role. g Yes, putative Sar box identified within the gene’s promoter region. Upstream, the gene is expected to be part of an operon with a potential Sar box located in an upstream promoter region. b c
DISCUSSION Using oligonucleotide microarray technology for genomewide transcription profiling, we have identified S. aureus genes with expression patterns expected of genes either up- or downregulated in a cell-density agr- and/or SarA-dependent manner. Given that most known S. aureus virulence factors are temporally regulated by one, if not both, of these effectors, it is likely that the genes identified within this study include previously unrecognized virulence determinants. Although investigators have successfully used transcription profiling technology to study biological processes in a number of other organisms, we initially set out to validate the methodology used by determining whether the results obtained with the S. aureus GeneChip correlated with our Northern blot data and previous reports. As expected, profile analysis of the effector of the agr response (RNAIII) demonstrated that transcript titers increased in a cell density-dependent manner within wild-type cells but were undetectable in agr mutant strains. Results also confirmed that RNAIII expression is diminished in a sarA mutant, further establishing that SarA is required for wild-type levels of RNAIII production or that the absence of SarA delays the onset of RNAIII expression. Likewise, the transcription profiles of alpha-toxin produced results that are consistent with other reports and confirmed that it is upregulated by each effector. Interestingly, profiling indicated that hla expression in RN6911 cells increased 2.2-fold in a growth phase-dependent manner. This increase was not detected by Northern analysis (Fig. 2B) but has also been reported by others (6), suggesting that the GeneChip technology used may be more reliable than Northern blot analysis. Profiling data for protein A also supported both previous reports, as well as our Northern blot data, and confirmed that genes that are downregulated by each effector can be detected in our system. The protein A transcription profiles indicate that the observed derepression of spa transcription occurs throughout all growth phases of agr and sarA mutant cells, implying that either RNAIII or SarA production may repress expression of an activator of protein A in wild-type cells. Indeed, it has recently been found that either agr or sarA mutant cells produce elevated amounts of SarS (also known as SarHI), an
activator of spa transcription (11, 33). More specifically, in those studies it was shown that sarA cells produced more sarS transcripts than did agr mutant cells, which nicely correlates with the spa transcript patterns observed here. In fact, our transcription profiling results indicate that (i) sarS is constitutively expressed at low levels in wild-type cells, (ii) the gene is transcribed above wild-type levels in both RN6911 and ALC842 cells during early growth phases, but transcript levels decrease to wild-type amounts at later growth phases, and (iii) SarS is constitutively expressed at levels 10-fold higher than wild-type levels in sarA cells (data not shown). These results suggest that the mechanisms of sarS derepression differ for sarA and agr cells. This has subsequently been confirmed by additional transcription profiling studies (unpublished data). Results of the present study also demonstrated that the profiles of at least 10 additional genes correlated with the work of other groups, including splA, splB, splC, and splD (31); sarS (11); agrA, agrB, agrC, and agrD (RNAII [7, 13, 19, 27]); and fnbA (35). Collectively these results provide a strong indication that the transcription profiling procedure used correlates well with previous agr and/or sarA studies, and they verify the methodology. In all, 104 genes were revealed to be upregulated in a cell density- and agr-dependent manner. Among these genes (Table 2) were 20 putative virulence determinants, including 14 genes involved in extracellular factor production. Because their expression corresponds directly with agr transcription, presumably these genes were induced directly in response to RNAIII. In contrast, 34 genes appeared to be downregulated in an agr-dependent manner (Table 3). Two of these genes, spa (protein A) and ORF1941 (cross-reactive antigen), encode putative cell surface virulence factors. One potential extracellular virulence factor, sspA (secretory antigen precursor), was found to be downregulated by agr. There appears to be a trend in the expression of agr-regulated virulence factors. Collectively our results suggest that an agr determinant upregulates extracellular virulence factors but downregulates cell surface virulence factors. Although this has long been a common hypothesis among investigators, the present body of work provides an unprecedented corrobora-
IDENTIFICATION OF agr- AND/OR SarA-REGULATED GENES
VOL. 183, 2001
7351
TABLE 5. SarA-downregulated genes a
Gene
2462 1220 1191 4470 1075 1888 2369 4567 1416 5238 2381 4186
clpL arcC gudB rocD
ORF
2912 4407 3933 35 4603 123 2047 1996 265 1221 3985 4405 2839 205 4259 3420 2103 2424 100 2823 827 4122 367 203 2577 426 427 4197 2574 4081 2174 2175
b
aldA fhs atl pbp3 thiD mutL ndhF rocA IrgB purM citC arcR glpF gntP
aur isaB lip nuc spa sspB sspC
Pattern
2 (2) 2 (2) 1 (2) 1 (3) 2 (2) 1 (2) 1 (3) 1 (5) 2 (3) 1 (5) 1 (2) 1 (2) 1 (3) 1 (4) 1 (3) 3 (4) 1 (3) 1 (2) 1 (3) 1 (1) 1 (6) 1 (1) 1 (3) 1 (2) 1 (4) 1 (2) 1 (2) 1 (3) 1 (2) 1 (2) 1 (2) 2 (3) 1 (1) 1 (1) 1 (2) 1 (1) 1 (2) 1 (5) 1 (2) 1 (2) 1 (1) 2 (2) 1 (1) 1 (1)
c
Functiond
N315 ORFe
ATPase/chaperone Carbamate kinase Glutamate dehydrogenase/leucine dehydrogenase Ornithine aminotransferase Proline dehydrogenase Threonine dehydratase NAD-dependent aldehyde dehydrogenases Formyl-tetrahydrofolate synthetase Dihydroxyacetone kinase Autolysin Penicillin-binding protein 3 Hydroxymethylpyrimidine/phosphomethylpyrimidine kinase Homology to N-carbamoylsarcosine amidohydrolase DNA mismatch repair protein NADH-ubiquinone oxidoreductase subunit 5 1-Pyrroline-5-carboxylate dehydrogenase Carboxylesterase type B Holin-like protein Phosphoribosylaminoimidazol synthetase Isocitrate dehydrogenase Putative transcription antiterminator, BgIG family Transcriptional regulator, Crp/Fnr family Transcriptional regulator, RpiR family Glycerol uptake facilitator Gluconate permease Phosphotransferase system IIB components
SA2336 SA2425 SA0819 SA0818 SA1585
Conserved hypothetical Conserved hypothetical Conserved hypothetical Conserved hypothetical Conserved hypothetical Conserved hypothetical Conserved hypothetical Hypothetical protein Hypothetical protein Aureolysin Immunodominant antigen B Lipase Nuclease Protein A Cysteine protease precursor Protease
SA0162 SA1553 SA0605 SA0905 SA1381 SA0537 SA2438 SA1138 SA0411 SA2341 SA2240 SA0253 SA0923 SA1517 SA1961 SA2424 SA0187 SA1140 SA2293 SA0186 SA0021 SA0212 SA0271 SA0363 SA0412 SA1618 SA1937 SA2378 SA2448 SA2430 SA2431 SA2463 SA0746 SA0107 SA0900 SA0899
Role categoryf
Adaptation Amino acid metabolism Amino acid metabolism Amino acid metabolism Amino acid metabolism Amino acid metabolism Carbohydrate metabolism Carbohydrate metabolism Carbohydrate metabolism Cell division Cell wall Coenzyme metabolism
Sar boxg
Upstream Yes
Coenzyme metabolism DNA repair Electron transport Electron transport Lipid metabolism Miscellaneous Nucleotide and nucleic acid metabolism TCA cycle Transcription termination Transcriptional regulation Transcriptional regulation Upstream Transport Transport Transport Upstream Unknown Unknown Unknown Unknown Unknown Unknown Unknown Unknown Yes Unknown Unknown Unknown Virulence factors Upstream Virulence factors Yes Virulence factors Yes Virulence factors Yes Virulence factors Yes Virulence factors Virulence factors
a
Designated S. aureus GeneChip ORF number. Previously described gene name. Many genes are represented on the S. aureus GeneChip in a redundant manner as full or partial fragments. Values are the number of times a gene transcript was identified as fitting a pattern (number of times the gene was either partially or completely represented on the GeneChip). d Previously described gene product function. e Corresponding designated S. aureus strain N315 gene (20). f Expected metabolic role. TCA, tricarboxylic acid. g Yes, putative Sar box identified within the gene’s promoter region. Upstream, the gene is expected to be part of an operon with a potential Sar box located in an upstream promoter region. b c
tion of this proposal. An immediate question that remains unanswered is why cell surface virulence factors are expressed during early phases of growth whereas extracellular proteins are produced at higher cell densities. Traditionally, it has been hypothesized that during early stages of host invasion staphylococci produce MSCRAMMs (microbial surface components recognizing adhesive matrix molecules) and other cell surface proteins, which promote attachment to both host cell and foreign (i.e., catheter) surfaces as well as avoidance of host defensive machinery. Once the organism has reached a critical threshold number, viru-
lence factor expression switches to a more invasive system in which the organism produces extracellular proteins capable of degrading host cells, their products (such as antibacterial agents), or their infrastructure (such as phagocytes). This is an attractive yet, based on our SarA findings, potentially oversimplified hypothesis. As shown in Tables 4 and 5, 76 genes were found to be upregulated in a cell density- and SarA-dependent manner. Among these genes were 16 putative virulence factors, including 10 extracellular and 6 cell surface virulence determinants. Several known SarA-upregulated genes, such as hla and fnbA,
7352
DUNMAN ET AL.
are included in this list (6, 12, 35). A total of 44 genes, including 5 extracellular and 3 cell surface virulence factors, were found to be downregulated in a SarA-dependent manner. These results suggest that SarA-regulated virulence genes do not necessarily follow the reported reciprocal expression patterns that have been established between agr-regulated cell surface and extracellular proteins. Several of the genes identified as being regulated by SarA have been found to harbor putative Sar boxes within their promoter regions, as indicated in each table. Interestingly, Cheung and colleagues have previously demonstrated that fnbA is regulated by SarA (35). Although attempts were made in that study, no fnbB signal was detected in Northern blot analysis. Conversely, our profiling results suggest that both fnbA and fnbB are expressed in a SarA-dependent manner and indicate that GeneChip technology is more sensitive than Northern blot analysis, in that instance. Similarly, numerous attempts to study the transcription of components of both the arginine deiminase and histidine utilization operons (both of which were identified as potentially being regulated by agr in our transcription profiling studies) by Northern analysis did not demonstrate any signal, further illustrating the sensitivity of the GeneChip technology. Many of the genes identified as being regulated by agr and/or SarA encode putative virulence factors, yet the majority do not. Although a number of other investigators have proposed that each effector is likely to regulate “nonvirulence genes,” data substantiating this hypothesis are sparse. It is likely that because the GeneChip technology used appears to provide far more sensitivity in studying biological processes than conventional approaches, others have not identified many of the genes presented in the present study as being regulated by each effector. Among genes not previously known to be stimulated in an agr- and cell density-dependent manner were genes encoding the members (arcA, arcB, arcC, and arcD) and the activator (arcR) of the arginine deiminase pathway. Activation of this pathway allows Bacillus licheniformis to grow anaerobically in the presence of arginine (24), an ability that could be beneficial to S. aureus during pathogenesis. Additionally, utilization of arginine via the arginine deiminase pathway produces ammonia, which has been shown to protect bacteria from the deleterious effects associated with acidic environments (4). However, further in vivo studies are required to determine whether components of the arginine deiminase pathway contribute to S. aureus pathogenesis. Members of the histidine utilization pathway (hutG, hutH, hutI, and hutU), which constitute a single transcript in Bacillus subtilis that is induced primarily by the presence of L-histidine, also appeared to be expressed in an agr- and cell densitydependent manner (14). It is difficult to resolve how transcription of this operon contributes directly to S. aureus pathogenesis. Given the number of genes upregulated by each effector that are involved in amino acid metabolism and transport pathways, it is tempting to speculate that each regulator not only mediates virulence factor production but may also poise the cell to scavenge for nutrients. Another alternative is that proteases that are directly produced in response to agr and/or SarA degrade secreted S. aureus factors and activate transport and metabolic processes; as a consequence, these processes may be indirectly inducible by each effector in laboratory cul-
J. BACTERIOL.
tures. Moreover, it is likely that unrecognized agr- and/or SarA-mediated processes that occur during mid-log-phase growth perturb the cell and affect biological processes, which in turn mask the relevance of biological processes determined to be regulated by each effector in the present body of work. A number of genes identified as regulated by either agr or SarA or both have not been previously characterized. It is likely that some, if not many, of these genes contribute to S. aureus pathogenesis. Moreover, understanding the functions of these genes may further clarify the biological processes identified here as being stimulated by either effector. Finally, it is important to recognize that pathogenesis is not likely to be a static process; rather, the invading bacterium must cope with fluxes in its immediate environment, such as changes in pH, changes in nutrient levels, differences in cell densities, and interactions with host factors. Therefore, the work presented here should be considered a snapshot of gene expression and a cataloging of the network of genes that are expected to be regulated by each effector in a cell density-dependent manner. We are actively characterizing networks of genes that are regulated by other elements, such as host factors, in an effort to better understand the pathogenic processes of staphylococci. Because this technology provides transcriptional profiles for each gene tiled onto a gene chip, yet analysis of each individual gene is beyond the scope of this report, we have elected to provide this data to the scientific community, so that others may analyze genes involved in other biological processes. The transcriptional profiling data obtained in these studies can be accessed at the Network on Antimicrobial Resistance in Staphylococcus aureus (NARSA) website (http//narsaweb.narsa.com). ACKNOWLEDGMENTS We thank Ambrose Cheung for providing strains used in this study and Lefa Alksne for critical reading of the manuscript. In addition, we thank the editors of the NARSA website for accommodating our data. REFERENCES 1. Balaban, N., T. Goldkorn, Y. Gov, M. Hirshberg, N. Koyfman, H. R. Matthews, R. T. Nhan, B. Singh, and O. Uziel. 2001. Regulation of Staphylococcus aureus pathogenesis via target of RNAIII-activating protein (TRAP). J. Biol. Chem. 276:2658–2667. 2. Bayer, M. G., J. H. Heinrichs, and A. L. Cheung. 1996. The molecular architecture of the sar locus in Staphylococcus aureus. J. Bacteriol. 178:4563– 4570. 3. Boyce, J. M. 1997. Epidemiology and prevention of nosocomial infections, p. 309–329. In G. Archer and K. Crossley (ed.), The staphylococci in human disease. Churchill Livingstone, New York, N.Y. 4. Casiano-Colon, A., and R. E. Marquis. 1988. Role of the arginine deiminase system in protecting oral bacteria and an enzymatic basis for acid tolerance. Appl. Environ. Microbiol. 54:1318–1324. 5. Chan, P. F., and S. J. Foster. 1998. The role of environmental factors in the regulation of virulence-determinant expression in Staphylococcus aureus 8325-4. Microbiology 144:2469–2479. 6. Chan, P. F., and S. J. Foster. 1998. Role of SarA in virulence determinant production and environmental signal transduction in Staphylococcus aureus. J. Bacteriol. 180:6232–6241. 7. Cheung, A. L., M. G. Bayer, and J. H. Heinrichs. 1997. sar genetic determinants necessary for transcription of RNAII and RNAIII in the agr locus of Staphylococcus aureus. J. Bacteriol. 179:3963–3971. 8. Cheung, A. L., K. Eberhardt, and J. H. Heinrichs. 1997. Regulation of protein A synthesis by the sar and agr loci of Staphylococcus aureus. Infect. Immun. 65:2243–2249. 9. Cheung, A. L., J. M. Koomey, C. A. Butler, S. J. Projan, and V. A. Fischetti. 1992. Regulation of exoprotein expression in Staphylococcus aureus by a locus (sar) distinct from agr. Proc. Natl. Acad. Sci. USA 89:6462–6466. 10. Cheung, A. L., and S. J. Projan. 1994. Cloning and sequencing of sarA of Staphylococcus aureus, a gene required for the expression of agr. J. Bacteriol. 176:4168–4172.
VOL. 183, 2001
IDENTIFICATION OF agr- AND/OR SarA-REGULATED GENES
11. Cheung, A. L., K. Schmidt, B. Bateman, and A. C. Manna. 2001. SarS, a SarA homolog repressible by agr, is an activator of protein A synthesis in Staphylococcus aureus. Infect. Immun. 69:2448–2455. 12. Chien, Y. T., A. C. Manna, S. J. Projan, and A. L. Cheung. 1999. SarA, a global regulator of virulence determinants in Staphylococcus aureus, binds to a conserved motif essential for sar-dependent gene regulation. J. Biol. Chem. 274:37169–37176. 13. Chien, Y. T., and A. L. Cheung. 1998. Molecular interactions between two global regulators, sar and agr, in Staphylococcus aureus. J. Biol. Chem. 273: 2645–2652. 14. Fisher, S. H., K. Rohrer, and A. E. Ferson. 1996. Role of CodY in regulation of the Bacillus subtilis hut operon. J. Bacteriol. 178:3779–3784. 15. Heinrichs, J. H., M. G. Bayer, and A. L. Cheung. 1996. Characterization of the sar locus and its interaction with agr in Staphylococcus aureus. J. Bacteriol. 178:418–423. 16. Janzon, L., S. Lofdahl, and S. Arvidson. 1989. Identification and nucleotide sequence of the delta-lysin gene, hld, adjacent to the accessory gene regulator (agr) of Staphylococcus aureus. Mol. Gen. Genet. 219:480–485. 17. Ji, G., R. Beavis, and R. P. Novick. 1997. Bacterial interference caused by autoinducing peptide variants. Science 276:2027–2030. 18. Ji, G., R. C. Beavis, and R. P. Novick. 1995. Cell density control of staphylococcal virulence mediated by an octapeptide pheromone. Proc. Natl. Acad. Sci. USA 92:12055–12059. 19. Kornblum, J., B. Kreiswirth, S. J. Projan, H. Ross, and R. P. Novick. 1990. Agr: a polycistronic locus regulating exoprotein synthesis in Staphylococcus aureus. VCH Publishers, New York, N.Y. 20. Kuroda, M., T. Ohta, I. Uchiyama, T. Baba, H. Yuzawa, I. Kobayashi, L. Cui, A. Oguchi, K. Aoki, Y. Nagai, J. Lian, T. Ito, M. Kanamori, H. Matsumaru, A. Maruyama, H. Murakami, A. Hosoyama, Y. Mizutani-Ui, N. K. Takahashi, T. Sawano, R. Inoue, C. Kaito, K. Sekimizu, H. Hirakawa, S. Kuhara, S. Goto, J. Yabuzaki, M. Kanehisa, A. Yamashita, K. Oshima, K. Furuya, C. Yoshino, T. Shiba, M. Hattori, N. Ogasawara, H. Hayashi, and K. Hiramatsu. 2001. Whole genome sequencing of methicillin-resistant Staphylococcus aureus. Lancet 357:1225–1240. 21. Lindsay, J. A., and S. J. Foster. 1999. Interactive regulatory pathways control virulence determinant production and stability in response to environmental conditions in Staphylococcus aureus. Mol. Gen. Genet. 262:323–331. 22. Lockhart, D. J., H. Dong, M. C. Byrne, M. T. Follettie, M. V. Gallo, M. S. Chee, M. Mittmann, C. Wang, M. Kobayashi, H. Horton, and E. L. Brown. 1996. Expression monitoring by hybridization to high-density oligonucleotide arrays. Nat. Biotechnol. 14:1675–1680. 23. Lukashin, A. V., and M. Borodovsky. 1998. GeneMark.hmm: new solutions
7353
for gene finding. Nucleic Acids Res. 26:1107–1115. 24. Maghnouj, A., T. F. de Sousa Cabral, V. Stalon, and C. Vander Wauven. 1998. The arcABDC gene cluster, encoding the arginine deiminase pathway of Bacillus licheniformis, and its activation by the arginine repressor argR. J. Bacteriol. 180:6468–6475. 25. Moore, T. A., and T. J. Standiford. 1998. The role of cytokines in bacterial pneumonia: an inflammatory balancing act. Proc. Assoc. Am. Physicians 110:297–305. 26. Novick, R. P. 2000. Pathogenicity factors and their regulation, p. 392–407. In V. A. Fischetti, R. P. Novick, J. J. Ferretti, D. A. Portnoy, and J. I. Rood (ed.), Gram-positive pathogens. American Society for Microbiology, Washington, D.C. 27. Novick, R. P., S. J. Projan, J. Kornblum, H. F. Ross, G. Ji, B. Kreiswirth, F. Vandenesch, and S. Moghazeh. 1995. The agr P2 operon: an autocatalytic sensory transduction system in Staphylococcus aureus. Mol. Gen. Genet. 248:446–458. 28. Novick, R. P., H. F. Ross, S. J. Projan, J. Kornblum, B. Kreiswirth, and S. Moghazeh. 1993. Synthesis of staphylococcal virulence factors is controlled by a regulatory RNA molecule. EMBO J. 12:3967–3975. 29. Projan, S. J., and R. P. Novick. 1997. The molecular basis of pathogenicity, p. 55–81. In G. Archer and K. Crossley (ed.), The staphylococci in human disease. Churchill Livingstone, New York, N.Y. 30. Recsei, P., B. Kreiswirth, M. O’Reilly, P. Schlievert, A. Gruss, and R. P. Novick. 1986. Regulation of exoprotein gene expression in Staphylococcus aureus by agr. Mol. Gen. Genet. 202:58–61. 31. Reed, S., C. A. Wesson, L. E. Liou, W. R. Trumble, P. M. Schlievert, G. A. Bohach, and K. W. Bayles. 2001. Molecular characterization of a novel Staphylococcus aureus serine protease operon. Infect. Immun. 69:1521–1527. 32. Salzberg, S. L., A. L. Delcher, S. Kasif, and O. White. 1998. Microbial gene identification using interpolated Markov models. Nucleic Acids Res. 26:544– 548. 33. Tegmark, K., A. Karlsson, and S. Arvidson. 2000. Identification and characterization of SarH1, a new global regulator of virulence gene expression in Staphylococcus aureus. Mol. Microbiol. 37:398–409. 34. Vandenesch, F., J. Kornblum, and R. P. Novick. 1991. A temporal signal, independent of agr, is required for hla but not spa transcription in Staphylococcus aureus. J. Bacteriol. 173:6313–6320. 35. Wolz, C., P. Pohlmann-Dietze, A. Steinhuber, Y. T. Chien, A. Manna, W. van Wamel, and A. Cheung. 2000. Agr-independent regulation of fibronectinbinding protein(s) by the regulatory locus sar in Staphylococcus aureus. Mol. Microbiol. 36:230–243.