Transcriptional programming during cell wall maturation in the expanding Arabidopsis stem Hall and Ellis Hall and Ellis BMC Plant Biology 2013, 13:14 http://www.biomedcentral.com/1471-2229/13/14
Hall and Ellis BMC Plant Biology 2013, 13:14 http://www.biomedcentral.com/1471-2229/13/14
RESEARCH ARTICLE
Open Access
Transcriptional programming during cell wall maturation in the expanding Arabidopsis stem Hardy Hall1,2 and Brian Ellis1*
Abstract Background: Plant cell walls are complex dynamic structures that play a vital role in coordinating the directional growth of plant tissues. The rapid elongation of the inflorescence stem in the model plant Arabidopsis thaliana is accompanied by radical changes in cell wall structure and chemistry, but analysis of the underlying mechanisms and identification of the genes that are involved has been hampered by difficulties in accurately sampling discrete developmental states along the developing stem. Results: By creating stem growth kinematic profiles for individual expanding Arabidopsis stems we have been able to harvest and pool developmentally-matched tissue samples, and to use these for comparative analysis of global transcript profiles at four distinct phases of stem growth: the period of elongation rate increase, the point of maximum growth rate, the point of stem growth cessation and the fully matured stem. The resulting profiles identify numerous genes whose expression is affected as the stem tissues pass through these defined growth transitions, including both novel loci and genes identified in earlier studies. Of particular note is the preponderance of highly active genes associated with secondary cell wall deposition in the region of stem growth cessation, and of genes associated with defence and stress responses in the fully mature stem. Conclusions: The use of growth kinematic profiling to create tissue samples that are accurately positioned along the expansion growth continuum of Arabidopsis inflorescence stems establishes a new standard for transcript profiling analyses of such tissues. The resulting expression profiles identify a substantial number of genes whose expression is correlated for the first time with rapid cell wall extension and subsequent fortification, and thus provide an important new resource for plant biologists interested in gene discovery related to plant biomass accumulation. Keywords: Cell wall, Anisotropy, Growth kinematic profiling, Transcriptome, Microarray, Arabidopsis, Inflorescence stem
Background Directional (anisotropic) cell wall expansion is an integral part of most plant developmental processes, where it facilitates the structural changes necessary for proper cell and organ morphogenesis. The initial expansive growth phase, which requires both addition of new extracellular polymers and remodeling of existing components in the primary cell walls, is often succeeded by cell wall thickening and rigidification processes to create secondary cell walls that enhance the structural integrity of the organ, but also curtail further wall extension. These sequential processes require a high degree of dynamic, context-specific * Correspondence:
[email protected] 1 Michael Smith Laboratories, University of British Columbia, Vancouver BC V6T 1Z4, Canada Full list of author information is available at the end of the article
coordination of cell wall building, reconstruction and fortification in order to harness the underlying driving force of turgor pressure in a spatially-defined manner (reviewed in [1,2]). Consistent with such developmental complexity, at least one thousand genes in Arabidopsis have been shown to have some association with cell wall synthesis and remodeling [3]. The gene expression patterns associated with cell wall expansion and/or secondary cell wall formation in Arabidopsis have been analyzed in several studies in efforts to identify participating genes and understand the biological roles of their products [4-8]. To specifically address cell expansion processes, for example, transcript profiles have been compared with protein accumulation profiles in Arabidopsis seedling hypocotyls that were undergoing rapid cell elongation without significant cell division [9].
© 2013 Hall and Ellis; licensee BioMed Central Ltd. This is an Open Access article distributed under the terms of the Creative Commons Attribution License (http://creativecommons.org/licenses/by/2.0), which permits unrestricted use, distribution, and reproduction in any medium, provided the original work is properly cited.
Hall and Ellis BMC Plant Biology 2013, 13:14 http://www.biomedcentral.com/1471-2229/13/14
Transcript profiling has also been conducted with in vitro cultured Zinnia mesophyll cells [10,11] and Arabidopsis subcultured cells [12] that were induced to transdifferentiate into tracheary element-like cells, a process that is accompanied by deposition of distinctive secondary cell wall thickenings on top of the original primary cell walls. In another approach, large-scale correlation analysis of public microarray data enabled the in silico identification of genes whose expression is strongly aligned with expression of specific members of the Arabidopsis cellulose synthase (CesA) gene family that are believed to be predominantly involved in either primary or secondary cell wall biogenesis [13]. The Arabidopsis inflorescence stem represents an attractive experimental system for such gene discovery studies since it provides more substantial amounts of tissue for analyses, and its tissue architecture is largely established prior to bolting, which means that stem expansion is primarily the product of cell elongation, rather than division. However, the growing stem also presents a continuum of developmental states along the organ as its component cells transition from early anisotropic expansion growth to growth cessation, and finally to cell wall fortification. Integrated with these changes in cell expansion activity are additional changes associated with the differentiation and maturation of the discrete tissues that comprise the stem. In order to accurately monitor the gene expression changes, or transcriptional programming, that accompany these various stem growth transitions, it is essential to sample and pool stem tissues that are verifiably associated with specific stages of development. A number of inflorescence stem profiling studies have attempted to compare the global transcriptional changes occurring between specific developmental stages [4,5,7,14], but the experimental strategies employed have typically compared tissues from visually selected regions of multiple plants, and have operated under two untested assumptions: 1) that the pooled plants whose stems are being sampled all have similar developmental proportioning, and 2) that the sampling guidelines for the harvested plants, derived from destructive analysis of a different set of plants, accurately associate features such as appearance of lignification in the interfascicular fibres of the stem [4] with specific developmental growth stages. Contrary to these assumptions, growth kinematic profiling of expanding inflorescence stems of individual Arabidopsis plants has recently demonstrated that stem growth profiles actually vary widely from plant to plant, even within genetically homogeneous populations [15]. As a consequence, data obtained from indirectly selected and harvested stem regions are likely to be relatively poorly correlated with onset of processes involved in cell wall extension or modification events associated with specific growth stages. In this study, we have applied growth kinematic profiling (GKP) to a series of individual Arabidopsis inflorescence
Page 2 of 17
stems as described in Hall and Ellis (2012) [15], and used the resulting growth rate profiles to generate pooled samples of stem tissue that accurately represent four discrete growth stages along the cell wall expansion developmental continuum. Our use of GKP-based sampling was expected to reduce the biological noise associated with indirect sampling strategies used in previous studies, and thus increase the sensitivity (power to detect actual differential expression) and accuracy of transcript profiling. Microarray-based assessment of global transcript abundance in these GKP-matched stem samples then enabled us to generate transcriptomic datasets that can be positioned with confidence within a validated developmental context of cell wall expansion performance (relative elemental growth rates). The resulting gene expression profiles demonstrate the participation of many genes that had earlier been linked to primary or secondary cell wall synthesis, but they also highlight expression changes in a range of unique genes whose role(s) in cell wall maturation or stem expansion have yet to be assessed.
Results Stage-specific transcriptome analysis
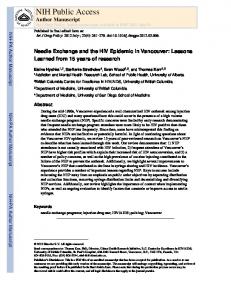
In order to position transcript profiles accurately within the cell wall expansion continuum, we employed growth kinematic profiling to establish relative elemental growth rates (REGRs) for contiguous stem segments harvested from a series of individual plants [15]. These profiles allowed us to identify three developmental stages for each plant being sampled: 1) an apical region where tissues begin to differentiate, and directional cell growth is initializing (termed ‘young’, or YNG), 2) a region where directional growth of the stem is most rapid (termed 'maximum growth-rate’, or MGR), and 3) a region where elongative growth is finishing (termed 'cessation', or CSS). These stages were therefore each represented by samples consisting of multiple pooled segments, each of which had been harvested from a stem location centered upon a specific GKP-identified growth phase. The tissue selection protocol is outlined in Figure 1A-C, while the growth kinematic profiles for all the plants used in this study are provided in Additional file 1: Figure S1. To facilitate comparison of our data with the results of other transcriptome studies in inflorescence stems, we also harvested a segment (termed 'mature', or OLD) from the base of each of the stems and pooled these for inclusion in our transcript profiling analysis. To maximize both statistical power and flexibility in analysis, our experiment directly co-hybridized all pair-wise combinations of developmental stage samples (‘complete factorial’ experimental design) and utilized a ‘mixed effects model’ analysis [16] to compare the four developmental
Hall and Ellis BMC Plant Biology 2013, 13:14 http://www.biomedcentral.com/1471-2229/13/14
Page 3 of 17
6
Segment nu
8
10
12
mber from
14
apex
10
1 2 3 4 5 6 7 8 9 10 11 12
5
Distance from stem base (cm)
(minutes )
Apex
13
YNG MGR CSS
14 15
16
0
4
Time aft er taggin
ge/hr)
2
10 30 50 70 90 110 130 150
C
B62R2 Plant 2
Segment number
Growth rate (%chan
5.5 5.0 4.5 4.0 3.5 3.0 2.5 2.0 1.5 1.0 0.5 0.0
15
B
g
A
0
2
4
OLD
6
Relative Growth Rate (%change/hr)
Figure 1 Representative growth profiling and harvesting. A) Representative surface plot of relative elongation growth rates (% change per hour, vertical axis) plotted against the number of segments (defined by optical marker tags) from the apex downwards, over the duration of the imaging period in 10 minutes intervals. The darker grey-shaded, nearest profile denotes the last 10-minute interval before harvest, depicted in the greater detail in the right-hand scatterplot. B) Corresponding scatter plot of growth rates (% change in length per hour) against distance from the stem base for specific segments. Segments are numbered from the top of the plant downwards in the right-hand margin. The LOWESS regression curve follows the best fit through the growth rate data for this plant over a given 10' interval. Green dotted lines represented 65% confidence intervals for the LOWESS regression curve. Closed-box/arrow indicates the stem position that matches the maximum growth rate of the regression curve (segment 5), plotted as the right-most vertical dotted line, while the open-box/arrow indicates the first position below the top of the stem where the growth rate falls to zero (segment 10). C) Harvesting zones for young (YNG), maximum growth-rate (MGR), cessation (CSS), and stem base (OLD) zones based upon LOWESS curve. See methods for description of zone establishment. See Additional file 1: Figure S1 for complete set of 34 growth kinematic profiles.
stages on the basis of six biological replicates, each pooled from a common set of thirty-four randomly-assigned plants. Examination of differential expression between stages
The goal of this study was to identify genes whose expression in the inflorescence stem differs most strongly between different growth stages, since these are expected to represent the loci most actively involved in the accompanying transcriptional reprogramming. The mixed effects modelbased analysis of this experiment generates six possible pair-wise comparisons between the four stages, for which the complete statistical analysis is presented in Additional files 2, 3 and 4: Table S1. For detailed analysis, we focus here on three growth stage comparisons (YNG-MGR, MGR-CSS, and CSS-OLD), and examine the arithmetic differences between the mean (log2) signal intensities for each gene. Although as many as 4635 genes are differentially expressed (q-value80-fold enrichment in GO terms containing ‘translation’. Also found within this ‘YNG-up-regulated’ list are genes related to signaling (RLK902 [19]; CLE16(CLAVATA3 homologue) [20]; LOX2 [21]; At1g62950, a LRR protein kinase), as well as transcription factors (ZF-HD class AtHB33; NAC063). Cell-cell communication mediated by peptides derived from CLE gene products, acting together with cognate receptor kinases, represents part of the elaborate signaling network that helps guide plant development [22]. While known cell wall-associated genes are not notably over-represented within the ‘YNG-up-regulated’ list, one gene encoding a putative glucan endo-β(1→3)glucosidase (At4g14080) [23] is up-regulated 15-fold over the MGR stage. Although cell wall expansion is expected to be taking place in both the YNG and the MGR stage tissues, genes whose products are uniquely required for rapid expansion should be relatively more highly expressed in the latter. The most strongly differentially up-regulated (~40-fold) gene in the MGR tissues relative to YNG is a peroxidase (PER64) that has been previously reported to be up-
regulated in stems in response to mechanical load [24]. The peroxidase gene family in Arabidopsis is large, and its members play a number of roles in cellular metabolism, including modulation of reactive oxygen species accumulation [25] and the oxidative coupling of aromatic metabolites such as the monolignols that serve as precursors for the lignin polymer [26,27]. The expression of PER64 in Arabidopsis has been shown to be concentrated in the protoxylem [28], where lignification of patterned secondary cell wall thickenings contributes to cell wall stabilization during vascular elongation, a spatial specificity that is consistent with the strong PER64 expression in MGR tissues. The MGR up-regulated list also contains several genes more directly related to primary cell wall formation and re-modeling, including a xyloglucan endotransglycosylase/ hydrolase MERISTEM-5 (MERI5B/XTH24), a putative pectinase (At1g80170), two arabinogalactan proteins (AGP12, AGP13) and a MYB transcription factor (MYB61) that has recently been shown to contribute to both cell wall synthesis and regulation of plant carbon allocation [29-32]. In addition, several genes encoding proteins associated with phytohormone signalling are more highly expressed in the MGR tissues,
Hall and Ellis BMC Plant Biology 2013, 13:14 http://www.biomedcentral.com/1471-2229/13/14
Page 5 of 17
Table 2 Twenty most differentially expressed genes with higher expression in MGR stage relative to YNG stage Accession
Gene annotation1
YNG/MGR Fold-change2
q-value3
AT3G13520
ARABINOGALACTAN PROTEIN 12 (AGP12)
−6.8
3.1E-02
AT1G80170
putative polygalacturonase (pectinase)
−7.3
1.4E-02
AT1G09540
MYB DOMAIN PROTEIN 61 (MYB61)
−7.4
2.6E-02
AT3G05880
RARE-COLD-INDUCIBLE 2A (RCI2A)
−7.5
1.3E-02
AT1G77330
similar to 1-aminocyclopropane-1-carboxylate oxidase
−7.5
1.9E-02
AT1G72430
Auxin responsive SAUR protein
−8.0
3.2E-02
AT4G23496
SPIRAL1-LIKE5 (SP1L5)
−8.1
4.7E-02
AT4G03205
SOUL heme-binding family protein
−8.1
1.9E-02
AT1G67865
unknown protein
−8.2
3.4E-02
AT4G26320
ARABINOGALACTAN PROTEIN 13 (AGP13)
−8.8
1.9E-02
AT3G19710
BRANCHED-CHAIN AMINOTRANSFERASE4 (BCAT4)
−9.6
1.5E-02
AT5G48560
basic helix-loop-helix (bHLH) family protein
−9.9
4.5E-02
AT3G55240
Overexpression leads to PEL (Pseudo-Etiolation in Light) phenotype
−10.0
1.5E-02
AT1G74670
putative gibberellin-responsive protein (GASA6)
−10.2
3.3E-02
AT4G30270
MERISTEM-5 (MERI5B)
−11.5
1.6E-02
AT1G74660
MINI ZINC FINGER 1 (MIF1)
−12.0
4.9E-03
AT4G29905
unknown protein
−12.9
4.3E-02
AT3G45160
unknown protein
−15.3
1.1E-02
AT5G05960
protease inhibitor/seed storage/lipid transfer protein (LTP) family protein
−24.2
1.5E-02
AT5G42180
peroxidase 64 (PER64) located in plant-type cell wall
−40.0
9.4E-04
1
Gene descriptions are abbreviated from TAIR10 genome release. Putative functions are stated in lowercase. 2 Genes ranked according to fold-change values derived from log2 ratios of YNG (numerator) and MGR (denominator). 3 Derived from false discovery-rate correction of p-values.
including a putative ACC oxidase, the GA-responsive MINI ZINC FINGER 1 (MIF1) [33] and another gene GASA6 (At1g74670) reported to be GA-responsive [34]. Comparison of the MGR stage gene expression patterns to those observed at the more mature CSS stage provides another view of those genes that are most relevant to active stem expansion, by contrasting their performance in the rapidly expanding MGR tissues with that seen in the CSS tissues where cell wall expansion has ceased. Interestingly, the list of twenty genes whose expression is ‘Higher in MGR relative to CSS’ (Table 3) is led, not by genes known to be associated with cell wall synthesis or modification, but by MAJOR LATEX PROTEIN 423 (MLP423), a member of the BET V1 class of allergens that exhibits sequence homology to ABA- and stress-responsive proteins from various plant species (EMBL-EBI database information). MLP423 is accompanied by two members of the large (108-member) GDSL-type lipase homologue gene family, and by other genes associated with lipid metabolism/ transport, but few, if any, genes known to be directly involved in cell wall synthesis are included. This profile implies that the genes populating the ‘Higher in MGR relative to CSS’ list are primarily those whose expression is relatively strongly reduced as the cells make their transition from rapid anisotropic expansion to maturation.
The ‘Higher in CSS relative to MGR’ gene list (Table 4), on the other hand, would be expected to capture those genes that make a major contribution to the re-programming associated with transition to a phase of cell wall stabilization and rigidification. Consistent with this prediction, this list is dominated by genes associated with formation of non-expanding walls, including all three of the cellulose synthase genes believed to be involved in cellulose microfibril deposition during secondary cell wall biosynthesis (CESA4/IRX5, CESA7/IRX3, and CESA8/IRX1) [14,35-37], and CHITINASE-LIKE PROTEIN 2 (CTL2) [38] whose loss-of-function mutant displays cellulose biosynthesis defects [39]. Also strongly represented are genes required for xylan biosynthesis/modification, including a UDP-GLUCURONIC ACID DECARBOXYLASE 3/UXS3 [40] that provides UDP-xylose for xylan backbone synthesis, IRREGULAR XYLEM 9 (IRX9) [41] and FRAGILE FIBER 8 (FRA8) [42] whose encoded proteins build and extend the glucuronosylxylan polymer, and two xylan modification genes: a xyloglucan-specific endotransglycosylase/ hydrolase 19 (XTH19) [43], and REDUCED WALL ACETYLATION 1 (RWA1) [44]. Other cell wall modification genes are present, including two pectinesterases (At2g43050, At2g45220), one of which is the most strongly differentially-expressed gene in the list. The prominence of
Hall and Ellis BMC Plant Biology 2013, 13:14 http://www.biomedcentral.com/1471-2229/13/14
Page 6 of 17
Table 3 Twenty most differentially expressed genes with higher expression in MGR stage relative to CSS stage Accession
Gene annotation1
MGR/CSS Fold-change2
q-value3
AT1G24020
MLP-LIKE PROTEIN 423 (MLP423)
16.7
2.9E-03
AT5G33370
GDSL-like lipase
5.7
2.3E-02
AT2G02320
PHLOEM PROTEIN 2-B7 (AtPP2-B7)
5.2
6.6E-03
AT2G38540
LIPID TRANSFER PROTEIN 1 (LP1)
5.2
5.0E-05
AT5G24780
VEGETATIVE STORAGE PROTEIN 1 (VSP1)
4.8
3.6E-03
AT2G02850
PLANTACYANIN (ARPN)
3.9
2.4E-03
AT2G33810
SQUAMOSA PROMOTER BINDING PROTEIN-LIKE 3 (SPL3)
3.8
4.2E-02
AT3G04290
LI-TOLERANT LIPASE 1 (LTL1)
3.7
2.4E-03
AT1G55490
chloroplast 60 kDa chaperonin beta subunit
3.6
9.1E-04
AT5G20630
GERMIN 3 (GER3)
3.5
3.8E-04
AT2G39670
radical SAM domain-containing protein
3.5
2.1E-02
AT3G47650
bundle-sheath defective protein 2 family / bsd2 family
3.4
3.2E-02
AT5G15230
GAST1 PROTEIN HOMOLOG 4 (GASA4)
3.4
3.1E-04
AT3G47340
GLUTAMINE-DEPENDENT ASPARAGINE SYNTHETASE (ASN1)
3.2
1.3E-02
AT5G20720
CHAPERONIN 20 (CPN20)
3.2
7.6E-03
AT5G55450
protease inhibitor/lipid transfer protein (LTP) family protein
3.2
3.6E-03
AT5G61170
40S ribosomal protein S19 (RPS19C)
3.1
4.3E-02
AT3G08740
elongation factor P (EF-P) family protein
3.1
2.0E-02
AT3G21410
F-box family protein (FBW1)
3.1
2.6E-02
AT2G02130
LOW-MW CYSTEINE-RICH 68 (LCR68)(PDF2.3)
3.0
3.5E-02
1
Gene descriptions are abbreviated from TAIR10 genome release. Putative functions are stated in lowercase. 2 Genes ranked according to fold-change values derived from log2 ratios of MGR (numerator) and CSS (denominator). 3 Derived from false discovery-rate correction of p-values.
these pectin de-methylating enzymes in the MGR→CSS transition list is consistent with a current model for plant cell wall rigidification in which a reduction in the levels of pectin methylesterification leads to enhanced calcium ion cross-linking and wall stiffening [45-48]. In addition to genes whose encoded products affect cell wall polysaccharide biosynthesis, the list includes IRREGULAR XYLEM 12 (IRX12/LAC4). Laccases are thought to contribute to polymerization of lignin in secondary walls, and LAC4 expression has previously been shown to be specific to xylary and interfascicular fibres in the Arabidopsis stem. Lignin deposition is largely unaffected in the lac4 loss-of-function mutant, but is strongly reduced in the lac4/lac17 double loss-of-function mutant [49]. It is noteworthy that we observed no significant difference in expression of LAC17 between the CSS and MGR stages (1.3-fold differential, CSS/MGR). Overall, nine of the twenty genes featured in this list also occur among a set of ‘xylem-specific’ Arabidopsis genes identified through analysis of public datasets [50], consistent with a metabolic commitment in CSS tissues to cell wall rigidification in xylem fibres and tracheary elements once stem expansion ceases. While growth kinematic data cannot precisely position the base of the stem along the developmental continuum
(growth kinematic profiling can only distinguish stem regions on the basis of their rates of expansion), it is clear from previous microscopic analysis [4,51] that the OLD stage tissue displays an advanced phase of organ growth and cell wall maturation in the 10-15 cm tall Columbia plants examined in this study. Based on our present understanding of the stem maturation process, the CSS and OLD samples are expected to contain tissues actively engaged in earlier and later stages of secondary cell wall formation and reinforcement, respectively. Tables 5 and 6 present the twenty genes whose expression is ‘Higher in CSS relative to OLD’ and the twenty genes whose expression is ‘Higher in OLD relative to CSS’, respectively. Displaying high expression in the CSS relative to OLD samples are GERMIN-LIKE PROTEIN 3 (GER3/GLP3) (At5g20630) and GERMIN-LIKE PROTEIN 1 (GER1/ GLP1) (At1g72610). GER3 also appeared in the list of genes more highly expressed in MGR tissues than in CSS (Table 3), indicating that expression of this member of the GER gene family follows a steeply declining trajectory during the stem maturation process. While specific developmental roles for GLP1 and 3 have yet to be identified, GER proteins are apoplastic glycoproteins that have been widely associated with plant disease resistance and ROS modulation, particularly in the cereals [52].
Hall and Ellis BMC Plant Biology 2013, 13:14 http://www.biomedcentral.com/1471-2229/13/14
Page 7 of 17
Table 4 Twenty most differentially expressed genes with higher expression in CSS stage relative to MGR stage Accession
Gene annotation1
MGR/CSS Fold-change2
q-value3
AT5G25110
CBL-INTERACTING PROTEIN KINASE 25 (CIPK25)(SnRK3.25)
−5.1
1.8E-02
AT2G43050
pectin methylesterase
−5.5
2.8E-03
AT4G30290
XYLOGLUCAN ENDOTRANSGLUCOSYLASE (XTH19)
−5.5
2.8E-04
AT5G59290
UDP-glucuronic acid decarboxylase 3 (UXS3)
−5.6
5.8E-04
AT2G38080
LACCASE 4 (IRX12)
−6.0
4.1E-04
AT2G37090
IRREGULAR XYLEM 9 (IRX9)
−6.1
4.3E-04
AT5G46340
REDUCED WALL ACETYLATION 1 (RWA1)
−6.1
3.0E-03
AT1G03740
S/T protein kinase
−6.1
7.8E-06
AT5G01360
TRICHOME BIREFRINGENCE-LIKE 3 (TBL3)
−6.9
2.3E-03
AT2G28315
Nucleotide/sugar transporter family protein
−7.3
4.0E-03
AT1G22480
plastocyanin-like domain-containing protein
−7.8
3.6E-04
AT5G17420
CESA7(IRX3)
−8.8
1.6E-04
AT3G18660
glucuronic acid substitution of xylan1 (GUX1)
−9.0
5.7E-04
AT4G18780
CESA8 (IRX1)
−9.5
9.4E-04
AT3G16920
CHITINASE-LIKE PROTEIN 2 (CTL2)
−10.1
1.3E-05
AT2G28110
FRAGILE FIBER 8 (FRA8)
−10.3
4.8E-04
AT2G03200
aspartyl protease family protein
−10.4
9.6E-05
AT1G63910
AtMYB103
−11.5
2.3E-03
AT5G44030
CESA4 (IRX5)
−11.5
5.6E-05
AT2G45220
pectin methylesterase
−38.4
1.8E-05
1
Gene descriptions are abbreviated from TAIR10 genome release. Putative functions are stated in lowercase. 2 Genes ranked according to fold-change values derived from log2 ratios of MGR (numerator) and CSS (denominator). 3 Derived from false discovery-rate correction of p-values.
Interestingly, another Arabidopsis GER homologue (GLP10, At3G62020) whose expression was previously found to be highly correlated with secondary cell wallassociated CESAs (CesA4, 7 and 8) in regression analysis of public microarray datasets [13], also displayed elevated expression at both the CSS and OLD stages in our study (Additional files 2, 3 and 4: Table S1). Also more highly expressed at this earlier stage of cell wall maturation are two pectate lyases (polygalacturonases), At3g07010 and At3g15720, previously associated with cell separation [53], and ALPHAXYLOSIDASE 1/AXY3 (At1g68560), an exoglycosylase that acts specifically on non-fucosylated xyloglucans [54] and is essential for apoplastic xyloglucan modification [55]. Several other up-regulated genes are less clearly linked to cell wall processes, but the functions of their encoded proteins may be related to the overrepresentation of ‘turgor pressure’ in the GO term enrichment analysis for this gene set (Additional file 7: Table S4). The list of genes most highly expressed in OLD tissues relative to CSS tissues (Table 6) is particularly striking: six of the eight most highly up-regulated genes encode PLANT DEFENSIN (PDF) proteins, small cysteine-rich peptides homologous to anti-microbial peptides that are widely
distributed within the eukaryotes [56]. Since both CSS and OLD tissues were harvested only seconds apart, an artifactual pattern of wounding-induced gene induction is not likely. Instead, it appears that accumulation of the products of such classical “defense” genes may form an integral part of the normal maturation of the inflorescence stem, perhaps reflecting a commitment to protection of these tissues until fertilization and seed dispersal are successfully completed. Relatively few cell wall-specific genes appear in the ‘higher in OLD than in CSS’ short list, with the exception of EXTENSIN 3/RSH and another proline-rich extensin-like family protein. EXT3/RSH plays an essential role in cell wall deposition through formation of EXTENSIN protein scaffolds that cross-link other cell wall constituents, thereby contributing to cell wall rigidification [57,58]. The most up-regulated of all the genes at the OLD stage relative to the CSS stage is the chloroplast-localized FATTY ACID REDUCTASE 6 (FAR6). A similar pattern of elevated FAR6 expression was earlier observed in microarray analysis of epidermal peels from the stem base [59] as well as in stem sections harvested from the base of mature Arabidopsis Col-0 plants [6]. Accompanying FAR6 in this list of most highly expressed genes is a wax synthase homologue (At5g22490), a co-occurrence pattern consistent with
Hall and Ellis BMC Plant Biology 2013, 13:14 http://www.biomedcentral.com/1471-2229/13/14
Page 8 of 17
Table 5 Twenty most differentially expressed genes with higher expression in CSS stage relative to OLD stage Accession
Gene annotation1
CSS/OLD Fold-change2
q-value3
AT1G12845
unknown protein
10.1
4.1E-02
AT5G20630
GERMIN 3 (GER3)
6.5
1.6E-02
AT3G07010
pectate lyase family protein
6.3
7.8E-03
AT1G72610
GERMIN-LIKE PROTEIN 1 (GER1)
6.2
4.0E-02
AT1G64660
ARABIDOPSIS THALIANA METHIONINE GAMMA-LYASE (ATMGL)
5.7
9.6E-03
AT3G15720
glycoside hydrolase family 28 protein / polygalacturonase (pectinase) family protein
5.3
3.5E-02
AT1G80280
hydrolase, alpha/beta-fold family protein
5.3
3.4E-02
AT1G68600
unknown protein
5.0
4.3E-02
AT5G38430
ribulose bisphosphate carboxylase small chain 1B / RuBisCO small subunit 1B (RBCS-1B) (ATS1B)
4.8
4.3E-02
AT2G39010
PLASMA MEMBRANE INTRINSIC PROTEIN 2E (PIP2E)
4.8
2.2E-02
AT2G38540
LIPID TRANSFER PROTEIN 1 (LTP1)
4.7
2.8E-02
AT3G16240
DELTA TONOPLAST INTEGRAL PROTEIN (DELTA-TIP)
4.7
2.2E-02
AT4G03205
coproporphyrinogen oxidase activity in porphyrin biosynthetic process within chloroplast
4.4
3.9E-02
AT3G48970
copper-binding family protein in metal ion transport
4.3
4.9E-02
AT1G75900
family II extracellular lipase 3 (EXL3), carboxylesterase activity, acyltransferase activity
4.3
1.5E-02
AT2G05790
glycosyl hydrolase family 17 protein
4.2
7.8E-03
AT5G38420
ribulose bisphosphate carboxylase small chain 2B / RuBisCO small subunit 2B (RBCS-2B) (ATS2B)
4.2
4.1E-02
AT1G68560
ALPHA-XYLOSIDASE 1 (XYL1)
4.2
4.1E-02
AT5G22580
unknown protein
4.2
2.8E-02
AT3G12610
DNA-DAMAGE REPAIR/TOLERATION 100 (DRT100)
4.1
2.2E-02
1
Gene descriptions are abbreviated from TAIR10 genome release. Putative functions are stated in lowercase. 2 Genes ranked according to fold-change values derived from log2 ratios of CSS (numerator) and OLD (denominator). 3 Derived from false discovery-rate correction of p-values.
epidermal cells in fully mature stems actively synthesizing both their cuticle polyester network and the associated wax matrix. The modest representation of explicitly cell wallassociated genes in this CSS-to-OLD transition list implies that the CSS and OLD stage tissues share quite similar transcriptional profiles in terms of secondary cell wall formation processes, and that the metabolic commitment to cell wall fortification in stem tissues does not change dramatically after cessation of active elongation. Stage-specific, whole-genome co-expression analysis
While differential gene expression datasets contrasting discrete growth stages provide initial insights into the biology underlying specific developmental transitions, potential functional relationships between gene products can also be revealed by considering transcript abundances across all the sampled developmental stages. The underlying rationale is that genes co-expressed at one stage and exhibiting similar association patterns across a broader developmental range may represent a subset of genes involved in specific biological processes. The ‘mixed effects model’ approach used in this study allowed us to generate developmental stage 'estimates' from two-channel arrays, which can be expressed as mean foldchange values (biological replicates = 6) of transcript
abundance at one stage relative to a hypothetical mean value of zero across the entire experiment. It should be noted that these 'estimates' can be computed with the same statistical power as applies to the log2 differential expression ratios reported in Tables 1, 2, 3, 4, 5, 6. This treatment provides a more intuitive means of visualizing gene expression trajectories, and provides the basis for formal co-expression analysis. The genes associated with each coexpression set (cluster) are identified in a filterable column within the full-genome dataset (Additional files 2, 3 and 4: Table S1), and their AGI codes are also listed separately in Additional file 8: Table S5 for easier access. Hierarchical divisive clustering was performed on the 4635 genes whose means were most significantly different from the gene-wise mean of all stages (q-value 6-fold higher in the MGR stage relative to the YNG stage. An additional five AGPs (AGP14, 21, 22, 24 and FLA13) were found to be significantly up-regulated (q-value