Oct 15, 2008 - The Columbia TAG (Transductive Annotation by Graph) system is deigned to ... labeled and unlabeled data in learning the classifier or inferring labels of new data. ..... The top right area show the name of current target class, e.g., âstate of .... Figure 4 shows the performance curve of the TAG system for the ...
Columbia TAG System - Transductive Annotation by Graph Version 1.0 Jun Wang and Shih-Fu Chang {jwang, sfchang}@ee.columbia.edu Columbia University ADVENT Technical Report #225-2008-3 Oct 15, 2008
1
Introduction
The Columbia TAG (Transductive Annotation by Graph) system is deigned to facilitate rapid retrieval and exploration of large image and video collections. It incorporates novel graph-based label propagation methods and intuitive graphic user interfaces (GUI) that allow users quickly browse and annotate a small number of images/videos, and then in real or near real time receive refined labels for all remaining unlabeled data in the collection. Using such refined labels, additional positive images/videos matching user’s interest can be quickly discovered. It can be used as a fast search system alone, or a bootstrapping system for developing additional target recognition tools needed in critical image application domains such as intelligence, surveillance, consumer, biomedical, and Web. TAG system differs from the traditional approaches that are based on automatic image classification. These methods usually require a sufficiently large number of labeled samples to train classifiers - a method referred to as supervised learning. Instead, TAG minimizes the burden of manual labeling on users. The objective is to leverage the best use of whatever user input available (as few as one or two samples per class) and propagate such information in the most effective way to all the remaining data in the database. Specifically, we use novel graph-based transductive learning methods developed in our prior works [1, 2] to address several challenging issues, such as unbalanced, noisy, and biased labels, and achieve promising performance in several application domains, including bimolecular images, web documents, and satellite images. TAG system is different from prior works using semi-supervised learning, which utilize both labeled and unlabeled data in learning the classifier or inferring labels of new data. Most semisupervised techniques focus on separation of labeled samples of different classes while taking into account distribution of the unlabeled data. The performance of such methods often suffers from the scarcity of labeled data, invalid assumptions about classification models or distributions, and sensitivity to non-ideal label conditions. To overcome these issues, we adopt the graph-based label propagation paradigm that makes least assumptions about the data and classifier. One central principle of this paradigm is that data share and propagate their labels with other data
in their proximity, defined in the context of a graph. Data are represented as nodes in a graph and the structure and edges in the graph define the relation among data. Propagation of labels among data in a graph is intuitive, flexible, and effective, without requiring complex models for the classifier and data distributions. Moreover, our graph inference method improved the existing graph learning approach in terms of the sensitivity to weak labels, graph construction, and noisy situations [2]. Starting with the small number of labels given by users, the graph-based transductive learning method propagates the initial labels to the remaining data and predicts the most likely labels (or scores) for each data in the graph. The propagation process is optimized with respect to several criteria. How well do the predictions fit the already known labels given by the user? What’s the regularity of the predictions over data in the graph? Is the propagation process amicable to addition of new labels? Are the results sensitive to quality of the initial labels and specific ways the labeled data are selected? The TAG system can be used in different modes - interactive and automatic. The interactive mode is designed for applications in which a user uses the GUI to interact with the system in browsing, labeling, and providing feedback. The automatic mode takes the initial labels or scores produced by other processes and then output refined scores or labels for all the data in the collection. The processes providing the initial labels may come from various sources, such as other classifiers using different modalities, models, or features (EEG signals, computer vision model, etc), rank information of the data from other search engines, or even other manual annotation tools. When dealing with labels/scores from imperfect sources (e.g., EEG classifiers and search engines), special care is needed to filter the initial labels and assess their reliability before using them as input for propagation. The output of TAG system consists of refined or predicted labels (or scores indicating likelihood of positive detection) of all the images in the collection. Such output can be used to identify additional positive samples matching targets of interest, which in turn can be used to train more robust classifiers, arrange the best presentation order for image browsing, or rearrange image presentations for EEG-based image visualization. In this report, we present summary of prior arts, system overview, usage modes, summary of propagation process, and some of sample applications we have tested.
2
Comparison with Prior Work
There have been prior works exploring use of user feedback in improving the image retrieval experience. In [3], relevance feedback provided by the user is used to indicate which images in the returned results are relevant or irrelevant to the search target user has in mind. Such feedback can be indicated explicitly (by marking labels of relevance or irrelevance) or implicitly (by tracking specific images viewed by the user). Given such feedback information, the initial query (either in the form of keywords or example images) can be modified. For example, the following equation describes a simple implementation that generates a new query based on linear
combination of the original query and samples of relevant and irrelevant images. Alternatively, the underlying features and distance metrics used in representing and matching images can be refined using the above relevance feedback information [4, 5]. Though such ideas are intuitive and easy to implement, applications in practical domains have not shown effective results. There is no guarantee that the refined query, feature, or metric will improve the capability of retrieving additional targets that have been missed in the initial results. {new query} = α · {initial query} + β · {positive f eedback} + γ · {negative f eedback} (1) In another thread of research, researchers attempt to answer the question that given a set of labels, the remaining data in the collection that have not been labeled, and the existing model learned by machines using the existing information, what will be the best data sample in the next iteration of user inspection or observation? The objective is to actively select the most beneficial sample for observation so that the uncertainty about the classification model can be reduced to the largest extent. In contrast with the conventional machine learning methods that passively sample data for labeling, such approaches select sample data in an active way, therefore referred to as active learning in the literatures [6, 7, 8]. Active learning methods have shown very promising results in interactive multimedia retrieval. However, in most cases supervised learning techniques are used and a non-trivial number of labeled data are needed in order to learn a classifier with reasonable quality. Such requirements make them non-competitive when there are only very few labeled samples available. In addition, most active learning methods select data that are difficult to classify, aiming at resolving the uncertainty near the local point. However, such methods ignore the impact of additional labels to a larger extent, including other data in the unlabeled collection. Given a mixture of labeled and unlabeled data, better machine learning models can be learned in order to discriminate labeled data from different classes, and simultaneously considering the distribution structures of the rest of data that are not labeled yet. Such techniques, referred to as semi-supervised learning or transductive learning, have attracted a lot of attention from researchers due to its major advantage that the manual labeling cost can be greatly reduced. Among the various options, transductive graph-based diffusion has shown great promises in predicting classification labels in challenging cases such as those have very few initial labels only [9, 10, 11]. Such methods take as input the initial labels of few samples and propagate them to the rest of data. The propagation process is done via a graph which describes the similarity between each sample and its neighbors, and the connectivity structures among the samples in the collection. Several methods have been developed in this area, such as local and global consistency [9], the method based on Gaussian fields and harmonic functions [10], and other related methods using manifold regularization framework proposed in [12, 13] where graph Laplacian regularization terms are combined with regularized least squares (RLS) or support vector machine (SVM) optimization criteria. These methods lead to graph-regularized variants called Laplacian RLS (LapRLS) and Laplacian SVM (LapSVM) respectively. The existing graph-based transductive learning techniques, though promising, are still inadequate under several challenging conditions in practice. For example, the interactive retrieval
process often lead to unbalanced situations in which labeled samples from one class often significantly outnumber those from different classes. Such conditions often cause inaccurate results from label propagation. In addition, the data samples and their observed features may be subject to a large level of noise, causing confusing and ambiguous cases for classification. Furthermore, data labeled by users may be sampled from the underlying data set in a biased way, leading to biased coverage of the data set and thereby incorrect classification results. In the TAG system, we implement several novel ideas developed in our prior works in [1, 2] to address the problems mentioned above. Specifically, we use an iterative optimization method to improve the label propagation accuracy. During each iteration of the process, the most informative label is automatically selected and its class label is automatically predicted. The added label sample is then added to the existing labeled pool and the optimal predicted labels for all of the rest of the unlabeled data are then computed. Such techniques improve the quality of the label propagation results by avoiding an aggressive step of predicting a large number of labels from a small number of labels. Instead, it implements a judicious procedure to predict new labels incrementally, starting from the most informative ones. In addition, we apply a novel graph regularization method to effectively address the class imbalance issue. Specifically, each class is assigned an equal amount of weights and each member of a class is assigned a weight proportionally to its connection density and inversely proportional to the number of samples sharing the same class. Finally, the TAG system includes a novel incremental learning method that allows addition of new labeled samples efficiently. Each time when user labels more data, the results can be quickly updated using a superposition process without repeating the entire propagation process. Influence by the new labels can be easily added to the original predicted labels. Such incremental learning capabilities are important for achieving real-time responses in user’s interaction with the system.
3
TAG System Overview
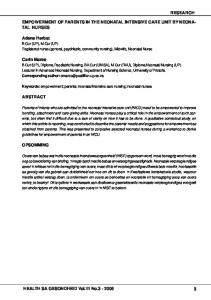
We present the system diagram of TAG system in Figure 1. Given a collection of images or video clips, TAG system builds an affinity graph to capture the relationship among individual images or videos. The graph is also used to propagate information from labeled data to the large number of data in the same collection. In the following, we will walk through the main processed involved in building the graph and using the graph for label propagation.
3.1
Feature Extraction and Graph Construction
Each node in the graph represents a basic entity (data sample) of retrieval and annotation. It can be an image, a video clip, a multimedia document, or an object contained in an image or video. In the ingestion process, each data sample is first pre-processed (e.g., scaling, partitioning, noise reduction, smoothing, quality enhancement etc). Some pre-filter may also be used to filter likely candidates of interest (e.g., images that are likely to contain targets of interest). After
Figure 1: The system diagram and usage modes of Columbia TAG (Transductive Annotation by Graph) System.
pre-processing and filtering, features are extracted from each sample. TAG does not dictate usage of specific features. Any feature set preferred by practical applications may be used, such as global features (color, texture, edge), local features (such as local interest points), and spatial information (such as layout). Multiple types and modalities of features may also be aggregated or combined. Given the extracted features, affinity (or similarity) between each pair of samples is computed. Again, no specific metrics are required by TAG, though judicious choices of features and similarity metrics often play a critical role in determining the quality of the final label prediction results. The pair-wise affinity values are then assigned to be weights of the corresponding edges in the graph. Usually, weak edges with small weights are pruned to reduce the complexity of the affinity graph. Alternatively, a fixed number of edges may be set for each node by finding a fixed number of nearest neighbors for each node.
3.2
Annotation and Browsing
With the affinity graph in place, TAG system is ready to be used for retrieval and annotation. TAG currently provides two different modes for such processes. In the Interactive Mode, users browse, view, inspect, and label images or videos through a graphic user interface (GUI) described later in this document. Initially before any label is assigned, a subset of data may be shown in the browsing window by using certain metadata (time, ID, etc) or simply random sampling of the collection. Using the GUI, user may view any image of interest and then provide feedback about relevance of the result (e.g., marking the image as relevant or irrelevant). Such
labels can then be encoded as labels and assigned to the corresponding nodes in the graph. In the Automatic Mode, the initial labels of a subset of nodes in the graph may be provided by some external filters, classifiers, or ranking systems. For example, if the target of interest is ”helipad” for military intelligence analysis in satellite imagery, an external classifier using image features and computer vision classification models may be used to predict whether the target is present in an image and assign the image to the most likely class (positive vs. negative). If the target is product image search for Web images (say ”automobile”), external Web image search engines may be used to retrieve most likely images using keyword search. The rank information of each returned image can then be used to estimate the likelihood of detecting the target in the image and approximate the class scores which can be assigned to the corresponding node in the graph. As mentioned above, each node in the graph is associated with either a binary label (positive vs. negative) or a continuous-valued score approximating the likelihood of detecting the target.
3.3
Graph-Based Label Propagation
Given the assigned labels or scores for some subset of the nodes in the graph (usually a very small portion of the entire graph), a key function of the TAG system is to propagate the labels to other nodes in the graph in the most accurate and efficient way. Such propagation process needs to be fast, completed in the real time or near-real time in order to keep users engaged. After the propagation process is completed, the predicted labels of all the nodes of the graph are used to determine the best order of presenting the results to the user. One typical option is to rank the images in the database in the descending order of likelihood so that user can quickly find additional relevant images. An alternative is to determine the most informative data to show to the user so that human inspection and labels may be collected for such critical samples. The objective is to maximize the utility of the user interaction so that the best prediction model and classification results can be obtained with the least amount of manual user input. The graph propagation process may also be applied to predict labels for new data that are not yet included in the graph. Such processes may be based nearest neighbor voting or some forms of extrapolation from existing graph to external nodes.
4
Summary of Label Propagation Process
Here we briefly describe the graph based label propagation algorithm used in the TAG system. Comparing with existing graph transduction approaches, there are two major innovations of our methods. First, to handle the interactive and real time requirements, we use a novel graph superposition method to incrementally update the label propagation results, without the need of repeating computation associated with prior labeled samples. Second, to solve noisy and uninformative label problem, we use an alternate optimization technique to achieve a greatly improved accuracy from graph label propagation. The detailed algorithms can be found in [1, 2]. Consider the image set X = (Xl , Xu ) consisting of labeled samples Xl = {x1 , · · · , xl } and
unlabeled samples Xu = {xl+1 , · · · , xn }. The corresponding labels for the labeled data set are denoted as {y1 , · · · , yl }, where yi ∈ L = {1, · · · , c}. For transductive learning, the objective is to infer the labels {yl+1 , · · · , yn } of the unlabeled data {xl+1 , · · · , xn }, where typically l