Jan 27, 2011 ... The consequences in an economic evaluation can vary from clinical effects to .....
in Economic evaluation, J. Fox-Rushby and J. Cairns, Editors.
Transparency of Transferability Diagnosing international aspects of economic evaluations of health care technologies
The research for this thesis was performed at the department of Health Organization, Policy and Economics, within the School for Public Health and Primary Care (CAPHRI), Faculty of Health, Medicine and Life Sciences, Maastricht University. Financial support for this study was provided entirely by a grant from the School for Public Health and Primary Care (CAPHRI), which participates in The Netherlands School of Primary Care Research (CaRe), acknowledged by the Royal Dutch Academy of Science (KNAW).
Printing: Datawyse / Universitaire Pers Maastricht Cover Design: Saskia Knies Lay-out: Saskia Knies ISBN 978 94 6159 023 7 © copyright Saskia Knies, Maastricht 2010
Transparency of Transferability Diagnosing international aspects of economic evaluations of health care technologies
DISSERTATION to obtain the degree of Doctor at the Maastricht University, on the authority of the Rector Magnificus Prof. dr. G.P.M.F. Mols, in accordance with the decision of the Board of Deans, to be defended in public on Thursday 27 January 2011, at 14.00 hours by Saskia Knies
P
UM UNIVERSITAIRE
PERS MAASTRICHT
Supervisor Prof. dr. J.L. Severens Co-supervisors Dr. A.J.H.A. Ament Dr. mr. S.M.A.A. Evers Assessment Committee Prof. dr. J.A.M. Maarse (chairman) Prof. dr. H. Brand Prof. dr. W.B.F. Brouwer (Erasmus University Rotterdam) Prof. dr. M.F. Drummond (University of York, United Kingdom) Prof. dr. F. Nijhuis
Voor mijn opa die me altijd heeft gestimuleerd om mijn nieuwsgierigheid te bevredigen en kennis te vergaren
CONTENTS
Chapter 1
Introduction
Chapter 2
Using cost-effectiveness results from abroad for local policy decisions
19
Chapter 3
The transferability of economic evaluations. Testing the model of Welte
27
Chapter 4
The transferability of valuing lost productivity across jurisdictions. Differences between national pharmacoeconomic guidelines
47
Chapter 5
Lost productivity in four European countries among patients with rheumatic disorders: are absenteeism and presenteeism transferable?
67
Chapter 6
Utilities of the EQ-5D: transferable or not?
87
Chapter 7
General discussion
105
Summary
119
Samenvatting
124
Dankwoord
129
Curriculum Vitae
133
9
Chapter 1
Introduction
9
Chapter 1
Health economics and economic evaluations Health economics is an important and growing field within health care research. The field of health economics focuses on the efficient use of scarce resources. Scarcity is the tension between unlimited needs and the limited possibilities for meeting these demands. Even though society wants to have the best care for its population, budgetary constraints are a given fact. Consequently, health care resources should be used as efficiently as possible [1, 2]. One of the main questions in health economics is for which health care technologies the scarce resources should be used [2]. In economic evaluations the costs and consequences of two or more alternative health care technologies are compared [3, 4]. The consequences in an economic evaluation can vary from clinical effects to health-related quality of life. When selecting the alternatives it is important to select carefully the alternatives with which the new technology will be compared. Preferably, the chose alternative is the best available alternative, or the standard treatment [2-4]. Economic evaluations are carried out to support the decision making process - for example, the decision regarding the reimbursement of specific technologies or whether a technology should be considered for use in clinical practice. This is in line with the aim of economic evaluations to help the decision making process in maximizing the benefits given the resources available [2-4]. A growing number of jurisdictions are using economic evaluations to guide their decision making about reimbursement for health care technologies, especially new pharmaceuticals [5, 6]. Jurisdictions can be perceived as any settings where a need can be identified for local cost-effectiveness estimates. This is often a country, but it may also be a region within a country or a particular payer [7]. In many countries, the request for economic data is often dictated by national guidelines for performing pharmacoeconomic evaluations [8]. Performing evaluations according to these guidelines creates financial, personnel and time pressures on study sponsors and researchers, especially when the guidelines insist on using local data or specific methodologies [7]. It is not always possible to perform studies locally [9]. This is a problem in particular for small countries and for low and middle income countries as these countries have limited resources for carrying out economic evaluations. As a result, most health care technologies are evaluated in a limited number of jurisdictions and decision makers may end up with data collected elsewhere [10]. Unfortunately, the findings of cost-effectiveness analysis do not travel well because of differences between health care systems [11]. This raises the question if and to which extent economic evaluations from one jurisdiction can be easily transferred and used for valid policy decision making in another [12].
10
Introduction
Transferability of economic evaluations Transferability has no clear-cut definition and it is often confused with generalisability. According to Späth et al. (1999) the results of a study are transferable if potential users can assess whether the results apply to their settings and adapt them if necessary [9]. The ISPOR Task Force on Transferability states that economic evaluations are generalisable if they can be applied without adjustment to other settings. Data are transferable if they can be adapted to apply to settings other than the study country [7]. Drummond and Pang (2005) defined transferability as the lack of generalisability from place to place [13]. These definitions indicate that transferability is always between settings and is closely related to generalisability. In this thesis, the definition of the ISPOR taskforce will be used. This means that in this thesis, generalisability is defined as the application of data to other settings without adaptations; transferability is defined as the application to other settings with adaptations. Considering the growing use of economic evaluations, resource constraints and the time needed to carry out economic evaluations for each specific choice to be made between technologies, the importance of transferring results is increasing. Economic evaluations are most useful in the settings in which the study was conducted. The results can probably not be used in another setting without any adaptation, but the value of economic evaluations would increase greatly if studies could be transferred with ease [6]. There is enough evidence available to assume that cost-effectiveness estimates can vary across settings and countries [14]. These differences are the results of so-called transferability factors that affect the results of economic evaluations [15]. These factors that influence the transferability are likely to generate variability in costeffectiveness results across jurisdictions [16, 17]. However, the interplay of various factors can hinder attempts to adapt the data so that it can be transferred across jurisdictions [18]. In the literature several lists and classifications of these transferability factors can be found, differing in length and elaborateness [10, 14, 17]. However, the most frequently mentioned factors are demography and epidemiology of disease, availability of health care resources, clinical practice variation, incentives to health care providers and institutions, relative prices and population preferences [14]. In addition, differences in methodological factors such as the perspective, discount rate and time horizon of a study could also hinder the transferability. Moreover, it has to be kept in mind that transferability is not a dichotomous concept: the transferability of data can be classified in degrees of complexity. Some parameters of economic evaluations can be transferred fairly easy, while other components will take more effort [17]. The transferability of economic evaluations can for example be hindered by differences in the study perspective and differences in case-mix. The modelling study of 11
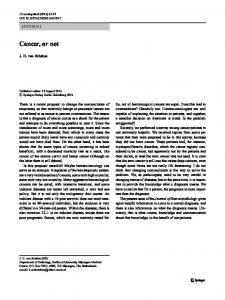
Chapter 1 Essers et al. [19] is an example which showed that calculating the costs using a different study perspective could change the conclusion. In this study a UK-based model on the cost-effectiveness of trastuzumab for the adjuvant treatment of breast cancer was transferred to the Netherlands. When diagnosing the transferability of the model, it became clear that the health care perspective used in the UK did not correspond with the societal perspective required in the Netherlands. Switching to the societal perspective in the Dutch model resulted in that the experimental treatment became dominant over the control treatment [19]. In the study of Esteban et al. [20] in twenty countries on mechanical ventilation it was showed that older mechanically ventilated patients had a lower survival of the intensive care unit and a lower overall survival, while the treatment was equal to younger patients [20]. The transferability of all these factors or of entire economic evaluations can be taken into account when either performing or interpreting economic evaluations. Five different stages can be distinguished in which different transferability issues can be taken into account: these stages are described in Figure 1. When “Performing economic evaluations”, there are three opportunities for increasing transferability, namely when designing, analysing and reporting the study [21]. It is possible in the design stage to anticipate the need for transferring the findings, and, at the design stage, to take several precautionary measures to increase the transferability for example, by selecting a variation of study sites, including a real world comparator, and including a societal perspective of the study. When analysing the results the focus should be on variability of the results in a wide range of settings.
Performing economic evaluations design
analysis
Interpreting economic evaluations
reporting
diagnosis PUBLICATION
adaptation POLICY DECISION
Figure 1 Transferability issues in different stages
In multinational trials data are collected in multiple countries, after which these data should be analysed in such a way that the results are relevant for all included jurisdictions. In reporting the results an attempt could be made to anticipate the need for transferring the data: in general it is necessary to be transparent about every step in the economic evaluation. In the end the main objective is to help decision makers to diagnose whether or not a given study is relevant to their decision 12
Introduction making setting [21]. Two stages can be identified when “Interpreting economic evaluations” in which the transferability of data plays a role. In the diagnosing stage different elements of an economic evaluation are assessed on their transferability. This can be carried out by assessing the transferability of the collected data, and in particular the factors that are likely to differ between settings. The diagnosing stage is very important for decision makers as they must consider whether the costs and effects estimates collected in other jurisdictions can be used for their own setting. However, for many factors it is not clear yet whether or not they can be transferred easily across jurisdictions. When the data are not considered to be transferable new data have to be collected or the data must be adapted. In the adaptation stage the data that cannot be transferred are adapted to the new setting. For example, unit costs have to be adapted to the new setting by replacing the old costs by the costs of the same service in the new setting.
Aim and outline of the thesis In this thesis several aspects related to the diagnosis of transferring economic evaluations across jurisdictions will be discussed. All research in this thesis looks at the diagnosis of international aspects of economic evaluations, meaning that transferability problems related to differences between countries and related to multinational trials are not taken into account. The objective of the thesis is to explore in the diagnosis stage of economic evaluations, methods for transferring costeffectiveness estimates and costs and effect values between jurisdictions. Chapter 2 Transferability issues In Chapter 2 an overview will be given of the current state of the literature regarding the transferability of economic evaluations. Due to the limited availability of local data and increasing pressure to use economic data, more and more often decision makers accept foreign data or data from multinational studies for their decision making process. Foreign data are sometimes used without a critical examination of whether data are really transferable from one jurisdiction to another. This can cause problems and these problems, which are described by giving an overview of the current literature on the transferability of economic evaluations. Chapter 3 Assessment of the transferability of economic evaluations In Chapter 3 the following research question will be answered: To which extent is Welte’s model a valid method for assessing the transferability of economic evaluations? In the last decade several methods have been developed for assessing the
13
Chapter 1 transferability of economic evaluations. Most methods use a kind of checklist to assess the article or report [10, 22-26].These methods can also be used in the analysis stage of an economic evaluation to assess the transferability of the data. By using one of the methods in the design stage of a study, the transferability of the collected data could be increased. However, until now it is not clear if the methods really help in assessing the transferability of economic evaluations, resulting in uncertainty about whether applying one of these methods will lead to different conclusions than those obtained when directly using the data of an economic evaluation in another setting. However, none of the methods have been tested in real life. In this chapter the testing of Welte’s model will be discussed. Chapter 4 The transferability of recommendations on lost productivity Chapter 4 will focus on the following research question: What do the national pharmacoeconomic guidelines recommend regarding the identification, measurement and valuation of lost productivity? Until now, only limited information is available on how this potential element of economic evaluations should be included, according to national guidelines. In addition, for several chronic diseases, the costs of lost productivity are higher than the health care costs. It could therefore be beneficial to reimburse health care technologies that result not only in lower health care costs, but also lower the lost productivity of the patient [27, 28]. In a growing number of countries pharmacoeconomic guidelines have been developed to indicate which requirements economic evaluations should fulfil. This is especially important if the results will be used in determining which technologies might be eligible for reimbursement [8, 29]. At the moment more than thirty national guidelines are available and that number is still rising [8]. Developing guidelines is a continuous process and recommendations can change and may vary across settings, leading to the question of whether the main recommendations differ [6]. This is of particular interest for topics on which no international consensus exist, as diverse recommendations could result. Chapter 5 Real time data of lost productivity in four European countries In the fifth chapter the research question is answered: to what extent is lost productivity, both being absenteeism and presenteeism, influenced by differences in countries? Besides the possible different recommendations regarding the inclusion of the value of lost productivity other problems may occur when transferring these data. Lost productivity data is collected using different kinds of questionnaire, which use different methods for identifying lost productivity; this makes it hard to compare the data. To be able to compare the data collected from different countries the same questionnaire should be used. However, it is not clear if lost productivity data
14
Introduction can be easily transferred between jurisdictions. Previous research [27, 28] has indicated that between country differences can be found, but these differences can be the result of different measurement methods. Chapter 6 Transferring utilities In the sixth chapter the following research question will be answered: what are the effects of differences in national EQ-5D value sets on absolute and marginal utilities of health states, and to what degree can these differences be explained by methodological factors? It is assumed that the clinical effectiveness of health care technologies is equal across neighbouring countries, because the biological differences are negligible [15]. However, it is not clear if this is also true for health state preferences and the resulting utilities. In daily practice, transferring utilities has been given less attention than transferring cost data, with the result that utilities are often transferred without hesitation. It is not clear whether the utilities of the EQ-5D are easily transferable or not. This generic instrument for measuring health-related quality of life in economic evaluations has been developed to compare utilities across countries. Several value sets are available to calculate the utility for specific health states. The utilities derived with the EQ-5D are often used directly without any adaptation and it is not clear if this practice is advisable. However, the value sets differ and it is unclear whether this is caused by cultural or methodological differences [30]. Chapter 7 Discussion The final chapter will discuss the main findings and conclusion of this thesis. Furthermore, a general discussion and considerations related to the overall research will be offered. Several recommendations for further research and for decision makers on dealing with transferability issues will be presented.
15
Chapter 1
References 1. 2. 3. 4. 5. 6. 7.
8. 9.
10.
11.
12. 13.
14. 15.
16.
17.
18. 19.
20.
Samuelson, P.A., Nordhaus, W.D., Economics. Fifteenth ed. 1995: McGraw-Hill Inc. Schut, F.T., Rutten, F.F.H., Economie van de gezondheidszorg. Third edition ed. 2009, Maarssen: Elsevier gezondheidszorg. Fox-Rushby, J., Cairns, J., Economic evaluation. Understanding public health, ed. N. Black and R. Raine. 2005: Open University Press. Drummond, M.F., MacGuire, A., Methods for the economic evaluation of health care programmes. 3 ed. 2005: Oxford University Press. Bryan, S., Brown J., Extrapolation of cost-effectiveness information to local settings. Journal of health services research and policy, 1998. 3(2): 108-112. Sculpher, M.J., Drummond, M.F., Analysis sans frontières. Can we ever make economic evaluations generalisable across jurisdictions? Pharmacoeconomics, 2006. 24(11): 1087-1099. Drummond, M., Barbieri, M., Cook, J. R., Glick, H., Lis, J., Malik, F., et al., Transferability of economic evaluations across jurisdictions: ISPOR good research practices task force report. Value in Health, 2009. 12(4): 409-418. Tarn, T.Y.H., Dix Smith, M., Pharmacoeconomic guidelines around the world. ISPOR Connections, 2004. 10: 5-15. Späth, H.M., Carrère, M.O., Fervers, B., Philip, T., Analysis of the eligibility of published economic evaluations for transfer to a given health care system. Methodological approach and application to the French health care system. Health Policy, 1999. 49(3): 161-177. Welte, R., Feenstra, F., Jager, H., Leidl, R., A decision chart for assessing and improving the transferability of economic evaluation results between countries. Pharmacoeconomics, 2004. 22(13): 857876. Hutubessy, R., Chrisholm, D., Tan-Torres Edejer, T., WHO-CHOICE, Generalized cost-effectiveness analysis for national-level priority-setting in the health sector. Cost effectiveness and resource allocation, 2003. 1(8). Mulligan, J.-A., Fox-Rushby, J., Chapter 18 Transferring cost-effectiveness data across space and time, in Economic evaluation, J. Fox-Rushby and J. Cairns, Editors. 2005, Open University Press. Drummond, M.F., Pang, F., Chapter 11 Transferability of economic evaluation results, in Economic evaluation in health care. Merging theory with practice, M.F. Drummond and A. McGuire, Editors. 2005, Oxford University Press: Oxford. Drummond, M.F., McGuire, A., Economic evaluation in health care. Merging theory with practice. 2005, Oxford Oxford University Press. Oostenbrink, J.B., Bouwmans, C. A. M., Koopmanschap, M. A., Rutten, F. F. H., Handleiding voor kostenonderzoek. Methoden en standaard kostprijzen voor economische evaluaties in de gezondheidszorg. 2004, Diemen: College voor zorgverzekeringen. Sculpher, M.J., Pang, F.S., Manca, A., Drummond, M.F., Golder, S., Urdahl, H., et al., Generalisability in economic evaluation studies in healthcare: a review and case studies, in Health Technology Assessment. 2004, NHS R&D HTA programme. Goeree, R., Burke, N., O'Reilly, D., Manca, A., Blackhouse, G., Tarride, J-E., Transferability of economic evaluations: approaches and factors to consider when using results from one geographic area for another. Current medical research and opinion, 2007. 23(4): 671-682. Willke, R.J., Glick, H.A., Polsky, D., Schulman, K., Estimating country-specific cost-effectiveness from multinational clinical trials. Health Economics, 1998. 7: 481-493. Essers, B.A.B., Seferina, S.C., Tjan-Heijnen, V.C.G., Severens, J.L., Novak, A., Pompen, M., et al. Transferability of model-based economic evaluations: the case of Trastuzumab for the adjuvant treatment of HER2-positive early breast cancer in the Netherlands. Value in Health. 2010. 13(4): 375-380. Esteban, A., Anzueto, A., Frutos-Vivar, F., Alia, I., Wesley Ely, E., Brochard, L., et al. Outcome of older patients receiving mechanical ventilation. Intensive Care Medicine. 2004; 30: 639-646.
16
Introduction 21. Drummond, M.F., Manca, A., Sculpher, M., Increasing the generalizability of economic evaluation: recommendations for the design, analysis and reporting of studies. International Journal of Technology Assessment in Health Care, 2005. 21(2): 165-171. 22. EUnetHTA, EUnetHTA HTA Adaptation Toolkit & Glossary- Work Package 5 Adapting existing HTAs from one country into other settings, NCCHTA, UK, Editor. 2008. 23. Antonanzas, F., Rodriguiz-Ibeas, R., Juarez, C., Hutter, J., Lorente, R., Pinillos, M., Transferability indices for health economic evaluations: methods and applications. Health Economics, 2009. 18(6): 629-643. 24. Boulenger, S., Nixon, J., Drummond, M.F., Ulmann, P., Rice, S., de Pouvourville, G., Can economic evaluations be made more transferable? European Journal of Health Economics, 2005. 4(6): 334346. 25. Nixon, J., Rice, S., Drummond, M., Boulenger, S., Ulman, P., De Pouvourville, G., Guidelines for completing the EURONHEED transferability information checklist. European Journal of Health Economics, 2009. 10(2): 157-165. 26. Urdahl, H., Manca, A., Sculpher, M., Assessing generalisability in model-based economic evaluation studies. Pharmacoeconomics, 2006. 24(12): 1181-1197. 27. Boonen, A., Van der Heijde, D., Landewe, R., Spoorenberg, A., Schouten, H., Rutten-Van Mölken, M., et al., Work status and productivity costs due to ankylosing spondylitis: comparison of three European countries. Annals of rheumatic disorders, 2002. 61: 429-437. 28. Gimeno, D., Benavides, F. G., Benach, J., & Amick III, B. C., Distribution of sickness absence in the European Union countries. Occupational and Environmental Medicine, 2004. 31: 867-869. 29. Hjelmgren, J., Bergren, F., Andersson, F., Health economic guidelines- similarities, differences and some implications. Value in Health, 2001. 4(3): 225- 250. 30. Szende, A., Oppe, M., Devlin, N., EQ-5D value sets: Inventory, Comparative Review and User Guide. 2007, Dordrecht: Springer
17
Chapter 2
Using cost-effectiveness results from abroad for local policy decisions
S Knies, JL Severens, AJHA Ament, SMAA Evers European Journal of Hospital Pharmacy 2008; 14 (4): 51-54 and Pharmacoeconomics for European hospital pharmacists, 2010; 1st edition; p. 20-23
19
Chapter 2
Introduction Decision makers and health care professionals, such as hospital pharmacists, are under increasing pressure to understand and manage the health consequences and economic impact of pharmaceuticals that are new to a health care market [1]. A growing number of jurisdictions request economic data in support of their decisionmaking procedures for the pricing and/or reimbursement of pharmaceuticals [2]. However, economic evaluations, of which cost-effectiveness analysis is the most commonly used method, are costly and time consuming which makes it not always possible to carry them out locally [3]. The increasing demand for cost-effectiveness analysis, limited research resources, time constraints and a shortage of evidence creates pressure to transfer data across jurisdictions [3, 4]. Some of the jurisdictions requiring data of economic evaluations in support of submissions for public reimbursement of pharmaceuticals have pointed out that the data need to be relevant to the local setting. However, little advice is offered on the approach to be adopted [5]. Unfortunately, economic evaluation findings, particularly costs, do not transfer well because of differences in health care and economic systems [6]. The transferability of economic evaluations is not only an issue between countries, but also within countries [7]. Therefore, decision makers commonly want conformation that a given economic evaluation is transferable to their particular population and treatment settings [8]. Although the concept of generalisability is related, it is regarded as something different. Generalisability is defined as the extent to which the results of a study can be generalized to the population from which the sample was drawn. Whereas, transferability is conceptualized as the extent to which the results of a study, as it applies to a particular setting, hold true for a different population or setting [9]. According to Späth et al. (1999) the results of an economic evaluation are transferable if potential users could assess whether the results apply to their settings and adapt them if necessary [3]. According to the ISPOR task force (2009) data are considered transferable if they can be adapted to apply to other settings or jurisdictions [2]. It seems unrealistic to generate cost-effectiveness or cost-utility data for every decision making context and therefore strategies for dealing with transferability issues need to be developed [5]. There are countless sources of variation to consider when adapting the economic evaluation results to a particular health care setting which, if not addressed, might lead to the inefficient implementation of new pharmaceuticals [1]. Even among countries with relatively similar health care systems there are differences in the results of economic evaluations across countries [10]. For example, differences between neighbouring countries regarding the price of pharmaceuticals, variation in resource use or variation in the prescription and dosage of pharmaceuticals [11].
20
Transferability issues
Problems related to transferability factors Transferability factors are factors that are likely to generate differences in economic evaluation results between settings or affect the transferability of economic evaluation data [12, 13]. Several factors have an influence on the differences between countries, which results in variation of the cost-effectiveness of pharmaceuticals from place to place [12, 14]. The factors can be classified into five different categories of characteristics, based on characteristics of the patient, the disease, the provider, the health care system and economic evaluation-methodology used. The following factors are often referred to: demographics of the population; epidemiology of disease; clinical practice; experience, education and training of the health care professionals; incentives for providers; absolute or relative prices (if the relative prices of pharmaceuticals differ between countries then the relative costeffectiveness will also differ); available resources and services; organization of delivery system; available treatment options (the so-called comparators in an economic evaluation); perspective of the economic evaluation and study factors [5, 13]. From the above, it could be argued that the transferability of the results of an economic evaluation is influenced by a large variety of factors. According to Goeree et al. (2007) there are three main factors that are commonly advocated when transferring data across jurisdictions: unit costs; resource utilization or practice patterns and clinical efficacy [13]. Other important factors that have been mentioned are: availability of health care resources and population preferences [10]. It is widely expressed that there are sometimes substantial differences in unit prices across jurisdictions. Most researchers state that at least the unit prices need to be replaced when transferring economic evaluations. However, not only the differences in absolute prices are important, but also the relative price differences. Furthermore, there are sometimes important differences in clinical practice across jurisdictions, which can have a significant impact on the cost-effectiveness of an intervention [13]. All these differences should be taken into account when transferring economic evaluations across countries. Most research on transferability has been focusing on the costing side of economic evaluations. On the effect side, the EQ-5D is a frequently used instrument to measure health-related quality of life in economic evaluations, which was developed to compare the population preferences for health states across countries. At the moment the EQ-5D has seventeen country-specific value sets, which can be used to calculate the utilities for specific health states [15, 16]. Nevertheless, utility estimates from foreign studies are often used directly for costeffectiveness estimates, without adapting by applying the appropriate national value set. However, recent research has indicated that using utilities obtained in one jurisdiction are often not equal to the valuation of health states of the general population in another jurisdiction, which can lead to misleading results. It is there-
21
Chapter 2 fore not advisable to transfer utilities from one country to another without any adjustment [16].
Possible solutions for using economic evaluations from abroad For each evaluation it is necessary to define in advance a clear and appropriately specified decision problem. This requires a description of the patient population and the comparators to the new technology. It is possible that a specified decision problem related to new pharmaceuticals vary between jurisdictions. The first reason is that licences can differ between countries and this can affect the clinical applications of the new product, or of the comparators. A second reason relates to the differences in treatment patterns, where interventions used in one country are not used in another, which affect the choice of comparators [2]. The checklist by Boulenger et al. (2005), forty-two questions, and a sub-checklist, sixteen questions, assesses the level of reporting of transferability information. For each question the answers are classified as: ‘yes’, ‘partially’, ‘no/no information provided’ or ‘not applicable’. The responses are given the following score: 1 for ‘yes’, 0.5 for ‘partially’ and 0 for ‘no/no information’. When the response to a question is ‘not applicable’, the question is excluded from the scoring by reducing the denominator accordingly. A summary score can be derived using the following formula: 1/n-x Σi Si * 100, n= number of questions, x = number of questions with the response ‘not applicable’ and S = score for each question. The answers to the questions lead to a transferability information score. In the article by Boulenger et al. (2005) was the mean score 66.9 ± 13.6% and the scores on the checklist and the sub-checklist, which focus specifically on transferability, were comparable. However, no standard is available and therefore it is difficult to determine what a score indicates [17]. An assessment of the transferability of decision-analytic models can be carried out by paying attention to the four topics as described by Urdahl et al. (2006). These topics are chosen to assess whether articles reporting decisionanalytic models provide enough information to enable decision makers in different jurisdictions to fully appreciate the variability of results according to location and be able to apply the evaluation to their own setting. The topics are: definition of target decision maker or jurisdiction, transparent reporting of model specification, relevance of data inputs to target decision maker or jurisdiction and assessment of robustness of model to variation in data inputs within and between jurisdictions. According to Urdahl et al. (2006) most studies stated the target decision maker or jurisdiction, but less information was provided on the other three topics [18].
22
Transferability issues
Step 1 Is the study of acceptable quality and relevant to the decision problem? (see Welte et al criteria)
No
Consider collecting other data and/or modelling
Yes
Step 2 Are the treatment patterns represented in the study similar to local treatment patterns?
Yes
Consider simple adaptation, e.g. applying local unit costs, using national health state valuation
No
Step 3 Is the study based on data from a multi-location randomized trial?
Yes
Consider using statistical methods
No
Develop a decision-analytic model
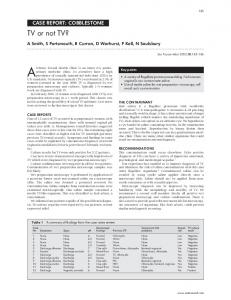
Figure 1 Steps for determining appropriate methods for adjusting cost-effectiveness information (based on: ISPOR Task Force on Transferability of economic evaluation across jurisdictions [2])
In Figure 1, three steps are described that consider the availability of data and helps to determine whether simple or more elaborate methods for adjusting results of economic evaluations to a particular jurisdiction are needed [2]. At first, an economic evaluation must first meet three general knock-out criteria, as stated in Welte et al. (2004) [4].These criteria help to determine which studies can be transferred to the decision country and which not. Both (1) the experimental technology and (2) the comparator(s) should be relevant in the jurisdiction of interest; other23
Chapter 2 wise the cost-effectiveness results are irrelevant. Furthermore, if (3) the methodological quality of the study does not meet the local standards, the transfer of the estimate is not valid. When the economic evaluation does not fulfil these three criteria, then the results are not transferable because the starting point of the evaluation is irrelevant [2, 4]. In the second step, the most important transferability factors, as ascertained by Welte et al. (2004), will be used to determine the level of correspondence between study country and decision country to decide if the economic evaluation is transferable. It is possible that only a simple adjustment procedure is necessary to transfer the economic evaluation results to the decision country. Therefore, the transferability factors should be verified to find out which adjustments may be necessary to be able to use the results. For instance, the setting where a patient is treated (e.g. hospital setting or family physician) can differ between countries. Therefore, practice variation between jurisdictions may make the transferability of the results of economic evaluations impossible without adjustment, for instance costs. Furthermore, differences in absolute and relative prices make recalculation necessary and therefore jurisdiction-specific price data might be required. In addition, the definition of the time horizon of the analysis can be a problem as the guidelines might differ between jurisdictions. Other characteristics of existing economic evaluations for which adjustment may be required, concern the perspective that is used, the discount rate applied and value set used for the valuation of health states [2, 4, 15]. When it becomes clear that the available economic evaluation results are not directly transferable through simple adjustments the last step should be considered. Step three indicates that there are two remaining options. If the jurisdiction of interest has participated in a multinational clinical trial in which data on resource use and/or costs have been collected, then the preferred strategy would be to analyze the individual patient data. When the individual patient data are available there are some analytic approaches to calculate adjusted cost-effectiveness estimates for this jurisdiction. The analytic approaches address two sets of objectives. The first is to evaluate whether there is evidence of heterogeneity across jurisdictions included in the trial and to explore the potential sources of heterogeneity. The second objective is to obtain estimates of incremental resource use, cost and/or cost-effectiveness that are suitable for decision making within particular jurisdictions that may of may not have been included. When the economic evaluation was undertaken outside the jurisdiction of interest, a modelling approach would be required, using as much clinical and cost data as possible from the jurisdiction of interest. In general, the structure of a model will be determined by the clinical course of a disease and the effects of (a set) interventions. Depending on the type of model selected, the structure embodies the choice of states/pathways and how they interact. However, there may be legitimate differences in model structure between jurisdictions and this is related to differences in the specified decision problem [2]. 24
Transferability issues
Conclusion The increasing pressure on health care decision makers to use scarce health care resources more efficient has resulted in an enlarged demand for evidence from economic evaluations. Nevertheless, conducting an economic assessment of each intervention for each jurisdiction will result in inefficient use of evaluation resources. As a result decision makers will increasingly be looking at the applicability of using economic evaluation results from abroad. However, the literature indicates that there is enough evidence that economic evaluation results can vary across jurisdictions and that there are a number of factors that may be a threat to the transferability of economic evaluations. Thus, decision makers should be aware of the factors affecting the transferability of data from another jurisdiction, as we described in this paper. To our opinion, the most feasible option will be to use the steps as proposed by the ISPOR task force.
25
Chapter 2
References 1.
Magnell C, Brown L, Moskowitz A, Gelijns A. Chapter 6 Health care evaluation: issues in transferability. In: Project TOH, editor. Health technologies and decision making. Paris: OECD; 2005. 2. Drummond M, Barbieri M, Cook JR, Glick H, Lis J, Malik F, et al. Transferability of economic evaluations across jurisdictions. ISPOR good research practices task force report. Value in Health. 2009; 12 (4):409-418. . 3. Späth HM, Carrère MO, Fervers B, Philip T. Analysis of the eligibility of published economic evaluations for transfer to a given health care system. Methodological approach and application to the French health care system. Health Policy. 1999; 49(3):161-77. 4. Welte R, Feenstra F, Jager H, Leidl R. A decision chart for assessing and improving the transferability of economic evaluation results between countries. Pharmacoeconomics. 2004; 22(13):857-76. 5. Drummond MF, Pang F. Chapter 11 Transferability of economic evaluation results. In: Drummond MF, McGuire A, editors. Economic evaluation in health care. Merging theory with practice. Oxford: Oxford University Press; 2005. 6. Hutubessy R, Chrisholm D, Tan-Torres Edejer T, WHO-CHOICE. Generalized cost-effectiveness analysis for national-level priority-setting in the health sector. Cost effectiveness and resource allocation. 2003; 1(8). 7. Mason J. The generalisability of pharmacoeconomic studies. Pharmacoeconomics. 1997; 11(6):50314. 8. Willke RJ. Tailor-made of off-the-rack? The problem of transferability of health economic data. Expert review of pharmacoeconomics and outcome research. 2003; 3(1):1-4. 9. Mulligan J-A, Fox-Rushby J. Chapter 18 Transferring cost-effectiveness data across space and time. In: Fox-Rushby J, Cairns J, editors. Economic evaluation: Open University Press; 2005. 10. Li S. How to improve pharmacoeconomic data generalisability between different countries. Expert opinion on pharmacotherapy. 2007; 8(10):1409-13. 11. Barbieri M, Drummond MF, Wilke R, Chancellor J, Jolain B, Towse A. Variability of cost-effectiveness estimates for pharmaceuticals in Western Europe: lessons for inferring generalizability. Value in health. 2005; 8(1):10-23. 12. Sculpher MJ, Pang FS, Manca A, Drummond MF, Golder S, Urdahl H, et al. Generalisability in economic evaluation studies in healthcare: a review and case studies: NHS R&D HTA programme; 2004. Report No.: 49. 13. Goeree R, Burke N, O'Reilly D, Manca A, Blackhouse G, Tarride J-E. Transferability of economic evaluations: approaches and factors to consider when using results from one geographic area for another. Current medical research and opinion. 2007; 23(4):671-82. 14. Oostenbrink JB, Koopmanschap MA, Rutten FFH. Standardisation of costs. The Dutch manual for costing in economic evaluations. Pharmacoeconomics. 2002; 20(7): 443-54. 15. Szende A, Oppe M, Devlin N. EQ-5D value sets: inventory, comparative review and user guide. Dordrecht: Springer; 2007. 16. Knies S, Evers SMAA, Candel MJJM, Severens JL, Ament AJHA. Utilities of the EQ-5D. Transferable or not? Pharmacoeconomics, 2009; 27(9): 767-779. 17. Boulenger S, Nixon J, Drummond MF, Ulmann P, Rice S, de Pouvourville G. Can economic evaluations be made more transferable? European journal of health economics. 2005; 4(6):334-46. 18. Urdahl H, Manca A, Sculpher M. Assessing generalisability in model-based economic evaluation studies. Pharmacoeconomics. 2006; 24(12):1181-97.
26
Chapter 3
The transferability of economic evaluations. Testing the model of Welte
S Knies, AJHA Ament, SMAA Evers, JL Severens Value in Health 2009; 12 (5): 730-738
27
Chapter 3
Abstract Objective: One of the existing methods to asses the transferability of economic evaluations is the model of Welte, which is a decision chart method that includes general and specific knock-out criteria and a transferability checklist. This study aims to test Welte’s model with the help of a case study. Methods: In this study, foreign studies were transferred to the Netherlands and then compared with a Dutch reference study. In the case study the costeffectiveness of physiotherapy was compared with a multidisciplinary treatment. With the help of a systematic search several foreign studies could be identified. Based on these foreign studies two different predictions were produced for the Netherlands. In the “all studies prediction” all foreign studies were used. In the “Welte’s model prediction” only the foreign studies were used which passed the general and specific knock-out criteria. Both predictions were compared with the Dutch reference case. Results: A total of fourteen non-Dutch studies were identified. Seven studies did not pass the general knock-out criteria and one study did not pass the specific knockout criteria. As a result fourteen studies were included in the “all studies prediction” and six studies in the “Welte’s model prediction”. The predictions yielded different results and the “Welte’s model prediction” proved better on costs than the “all studies prediction”. Discussion: Application of Welte’s model does influence cost and effects estimates when transferring economic data between countries. However, more cases should be subjected to the Welte transferability model before a final conclusion can be drawn.
28
Assessment of Welte’s model
Introduction International interest in the economic evaluation of interventions in health care is growing [1]. In recent years, economic evaluations have become more decisive in the process of decision making in health care all over the world [2]. Using data, methods or results from published studies abroad can save time compared to conducting a new economic evaluation in your own country. When studies cannot be performed nationally, for instance because of small number of patients in a country, it may even be the only possibility. Decision makers can use economic evaluations in at least two ways: ‘uncorrected’ by applying the conclusions directly or ‘corrected’ by applying the methods and data that are applicable and substituting local methods and data for those that are not [3]. However, every country has its own unique health care structure. This raises the question whether the results of economic studies can be transferred from one country to another without any correction [2]. Transferability may be defined as the generalisability of study results from one policy setting to another or from one country to another [4]. The extrapolation of the results of economic evaluations to another setting is not straightforward [1]. HTA-researchers agree about the most important factors that influence the transferability of study results [1-6]. These factors are: demography of the population, epidemiology of diseases, availability of health care resources and variations in clinical practice, incentives to health care professionals and institutions, relative prices and population preferences [4]. Besides that, cost-effectiveness results for pharmaceuticals vary between Western European countries and these variations are not systematic. One of the main causes appeared to be the price of the major cost drivers. However, the main factor is whether resource use is allowed to vary across countries and therefore analysts should provide strong arguments for pooling resource use data [7]. These factors make a complete extrapolation of results from one country to another impossible [1]. The transferability factors also hinder the transfer of an incremental costeffectiveness ratio (ICER) without any adjustments, because it is assumed that the costs always differ between countries. These differences can be associated with differences in health care consumption and prices. Therefore, the cost data should always be adjusted to the decision country. The effectiveness data may be transferable from place to place. This is due to the assumption that the differences in outcome resulting from interventions between patients in countries are small and therefore the effectiveness of treatments is the same [4, 8]. In the last fifteen years much has been written about these factors influencing the transferability, but the discussion remained rather theoretical. To our knowledge, this study is one of the first to test the theoretical transferability factors in an experimental setting. By testing the theoretical assumptions, the pitfalls and problems related to the transfer of studies to other settings will be identified. 29
Chapter 3 One of the existing methods to assess the transferability of economic evaluations is the model of Welte. The other existing and published methods to assess the transferability are those of Boulenger et al. [3], Urdahl et al. [9] and Nixon et al. [10]. The methods of Boulenger et al. [3] and Nixon et al. [10] have no clear cut-off points to decide if the economic evaluation is transferable or not. The method of Urdahl et al. [9] is especially developed for assessing method-based economic evaluations. Welte’s model was chosen because it has clear cut-off points and can be used for the assessment of both empirical and method-based economic evaluations. The research question is: To which extent is Welte’s model a valid method to assess the transferability of economic evaluations? Consequently, the objective of this study is to test Welte’s model. This testing will be carried out by means of a case study. Theory: short description of Welte’s model The model of Welte is one of the first general and the oldest method that is developed to decide which studies are transferable [6]. Before Welte’s model, only models for specific diseases were available, cf. Caro et al. (1999) [11]. Welte’s model is a transferability decision chart method that includes general and specific knock-out criteria and a transferability checklist. With the help of these general and specific knock-out criteria it is possible to determine which studies can be transferred to the decision country and which can not. A study or article must first meet three general knock-out criteria: 1) the evaluated technology should be comparable to the one that shall be used in the decision country, 2) the comparator should be comparable to the one that is relevant to the decision country and 3) the study should possess an acceptable quality. When a study has passed these general knock-out criteria, the specific knock-out criteria will be used to determine which parts of the studies are transferable. The specific knock-out criteria are listed in Table 1. Table 1 Specific knock-out criteria of Welte’s model Transferability factors Factors 1 1 Methodological characteristics perspective ; discount rate; medical cost approach ; produc1 tivity cost approach absolute and relative prices; practice variation; technology Health care characteristics availability Population characteristics incidence/prevalence; case-mix; life expectancy; healthstatus preference; acceptance, compliance and incen1 tives to patients; productivity and work-loss time ; disease spread Source: Welte et al., Pharmacoeconomics 2004 22(13), 857-876. 1) These factors have a high relevance in this study
30
Assessment of Welte’s model These factors or specific knock-out criteria in the transferability checklist are used to determine the correspondence between the study country and the decision country. This is carried out in three steps. First, the relevance of each transferability factor is determined. In the second step, the level of correspondence between the study country and the decision country is estimated. For the last step, the checklist is applied to determine the expected effect of the factor on the cost-effectiveness ratio (CER). The estimation of the CER depends on the relevance of the factors and the correspondence between the study and decision country. When both are high, the estimation will be unbiased. In the case of a low correspondence, the estimation of the CER will be biased. After these three steps, it can be decided which adjustments are necessary to transfer the foreign studies [6].
Methods Case selection To test Welte’s model a case was selected by following the next steps. First, topic for the case was searched for using Medline, whereby the topic of the case study should fulfil the following criteria: cost-benefit-analysis [mesh], study not older than five years (py>2002), randomised controlled trial (rand∗ in ti or rand∗ in ab or rct in ab or rct in ti), incremental comparison of treatments (differen∗ in ti or differen∗ in ab or increment∗ in ti or increment∗ in ab or rati∗ in ti or rati∗ in ab), societal perspective (soci∗ in ti or soci∗ in ab or indir∗ in ti or indir∗ in ab or non-medi∗ in ti or non-medi∗ in ab), and cost-utility analysis (util∗ in ab or util∗ in ti). These search criteria resulted in seventy-four results, whereby the abstracts were checked if they fulfilled the following criteria: fulfilled the studies the criteria of the Medline search, performed in the Netherlands, only empirical and no modelling studies and only single country studies. Only a limited of Dutch studies satisfied these criteria (N=15). The full text article was read and based on these articles, studies indicating it was the first economic evaluation on this topic were considered unsuitable and removed. For the remaining studies (N=9) Medline was searched to find comparable foreign studies, which had to be at least five foreign studies for each topic. The foreign studies should fulfil the same criteria as the Dutch study, but there were some extra requirements, namely: equal disease, article should be written in English, study performed outside the Netherlands, studies performed in different foreign countries, ‘comparable’ intervention or experimental treatment. Studies were excluded if they were multinational trials. Based on this search strategy, only one case study remained, namely the study of Van der Roer et al. [12] (Table 2).
31
Chapter 3 Table 2 Selection of the case study Step 1 Selection based on key-words Search criteria #1 cost-benefit-analysis [mesh] #2 rand∗ in ti or rand∗ in ab or rct in ab or rct in ti #3 differen∗ in ti or differen∗ in ab or increment∗ in ti or increment∗ in ab or rat∗* in ti or rati∗ in ab #4 soci∗ in ti or soci∗ in ab or indir∗ in ti or indir∗ in ab or non-med∗i in ti or non-medi∗ in ab #5 #1 and #2 and #3 and #4 and (py>2002) #6 util∗ in ab or util∗ in ti #7 #5 and #6 Step 2 Exclusion based on abstract Reason Studies did not fulfill selection criteria Non-Dutch study Modeling study Non-empirical study Multi-country study * total number higher than 74 due to several reasons possible Step 3 Exclusion based on full article Reference Topic Onrust (2008) [13] Visiting service for older widowed individuals Van den Hout (2008) [14] Treatments for sciatica from lumbar disc heriation Bulthuis (2008) [15] Exercise therapy by hospital discharged arthritis patients Zijlstra (2007) [16] Spa treatment for fibromyalgia Oude Voshaar (2006) [17] Tapering off benzodiazepines Korthals-de Bos (2006) [18] Treatments for carpal tunnel syndrome Steenstra (2006) [19] Van den Hout (2005) [20] Van den Hout (2005) [21] Korthals-de Bos (2004) [22] Van Dieten (2003) [23] Van den Hout (2003) [24] Van den Hout (2003) [25] Korthals-de Bos (2003) [26]
Back to work program for workers with low back pain Treatment programs for rheumatoid arthritis Mobilisation techniques for adhesive capsulitis Interventions for lateral epicondylitis Pharmaceutical treatments for reflex sympathetic dystrophy Radiotherapy for painful bone metastases Multidisciplinary care for rheumatoid arthritis Treatments for neck pain
Results 43206 458732 3055267 500803 252 324129 74
Number* 37 48 15 15 5
Reason for removal no other economic evaluations no other trial-based economic evaluations only Dutch economic evaluations no comparable studies no other economic evaluations no other trial-based economic evaluations only one other economic evaluation only foreign effect studies no other economic evaluations no other economic evaluations no other economic evaluations for this treatment no foreign economic evaluations no other economic evaluations not enough foreign economic evaluations
Based on Dutch guidelines for costing research, a description of the necessary data was produced, whilst at the same time a search for suitable foreign studies was performed [8]. The foreign studies have mainly been identified by looking at three sys32
Assessment of Welte’s model tematic reviews [27-29]. Furthermore, a systematic search was performed within the electronic databases Medline, PubMed and Econlit and in the most relevant journals, Spine and Pain. The following search strategy was used: low back pain [mesh] AND costs and cost analysis [mesh]; low back pain AND physical therapy [mesh] OR exercise* [tw] AND costs and cost analysis; low back pain AND pain clinics [mesh] OR cognitive therapy [mesh] OR multidisciplinary treatm* [tw] AND clinical trial [mesh]; low back pain AND pain clinics OR cognitive therapy AND costs and cost analysis OR effect* [tw]. All references were subsequently checked to identify additional studies. Making the predictions In the next step, the studies were assessed on their transferability to the Netherlands. This was carried out with the help of Welte’s model as described in the theory section. The third general knock-out criterion states that the studies should possess an acceptable quality. The criteria list “Consensus on health economic criteria” (CHEC) was utilised to assess the methodological quality of the foreign studies [30]. By applying the general knock-out criteria, each treatment arm of a foreign study was separately examined to decide if the treatment arm could pass the criteria. In theory it is possible that one of the treatment arms passes the general knock-out criteria and that the other treatment arm not. All studies were assessed on the transferability of the data by two different reviewers. The corresponding author (SK) reviewed all articles and the other authors (AA, SE, and JS) divided the assessment of the studies among them. Table 3 Main structure of the model ICER = ΔC/ΔE ΔC = Ce - Cc ΔE = Ee–Ec E = Eqaly C = Ci + Ch + Csl Ch = (qgp * pgp) + (qit * pit) + (qth * pth) + (qopd * popd) + (qha * pha) + (qm * pm) C e: Cc: total costs of experimental treatment total costs of control treatment Ci : Csl: Ec: q: gp: th: ha:
total costs of intervention costs of sick leave effect of control treatment quantity general practitioner physiotherapist hospital admission
Ch: E e: p: qaly: it: opd: m:
costs of health care consumption effect of experimental treatment price quality adjusted life years imaging techniques outpatient department visit medicine use
33
Chapter 3 After the assessments, two different predictions were produced and both predictions were based on the same model. The main structure of the model is given in Table 3. We distinguished three different costs groups, namely the intervention costs (Ci = qi * pi), sick leave (Csl) and other health care consumption (Ch). The costs of the multidisciplinary treatment itself were represented by Cmdt and of physiotherapy by Cphysio. The effect of the treatments was expressed in quality adjusted life years (QALYs). To make the two predictions, data were extracted from the foreign studies. In the “all studies prediction” all foreign studies were used. In the “Welte’s model prediction” all studies which passed the general and specific knock-out criteria and were therefore considered to be transferable, were used. The predictions were produced according to the Dutch guidelines for costing research [8]. Because of differences in relative prices between countries, it is not possible to transfer prices [4, 8]. As a result, all foreign prices were replaced by Dutch prices. All the available quantity data were pooled using the averages of all foreign studies and the Dutch prices were attached to these average quantities. In some cases the prices of rehabilitation centres were used to estimate the real costs. For all other costs the real prices of that specific treatment were used. All prices utilized, originating from 2003, can be found in the Dutch guideline for costing research [8]. The prices were adjusted to 2004 prices, because the Dutch study was based on 2004 prices. The adjustment was carried out with the help of the consumer price index of the Netherlands [31]. Next to that, the effects of both the multidisciplinary treatment and physiotherapy are calculated by looking at the change from baseline. Sensitivity analysis was performed to investigate the robustness of the predictions. For both predictions a high/low analysis was performed with only the highest and the lowest values used. This way, predictions with the lowest and the highest values of all parameters were available for the “all studies prediction” and the “Welte’s model prediction”. Furthermore, plots of the total costs were produced to identify if the predictions and the results of the Dutch study correspond with each other. In the last step, the two predictions were compared with a Dutch study on the same topic (Figure 1).
Results After a thorough search for a suitable case, the chosen case study became subacute and chronic non-specific low back pain. The Dutch study that was chosen as reference case is the study of Van der Roer (2006). In this study the cost-effectiveness of physiotherapy was compared with a multidisciplinary treatment which included education, exercises and behavioural treatment [12].
34
Assessment of Welte’s model Determination of the case
Determinate which data are needed to make the predictions with help of Oostenbrink guideline
Search for articles
Apply general knockout criteria Apply specific knockout criteria
Use foreign quantities and Dutch prices
Use foreign quantities and Dutch prices
Make “all studies prediction” and perform sensitivity analysis
Make “Welte’s model prediction” and perform sensitivity analysis
Compare the two predictions with each other and with the results of the Dutch reference study
Figure 1 Flowchart of the method
Transferability check: general knock-out criteria As a result of the search for foreign studies, a total of fourteen studies, from which the references and the characteristics are shown in Table 4, were identified. In all studies the cost-effectiveness or effectiveness of either physiotherapy or the multidisciplinary treatment was determined. The multidisciplinary treatment was defined as the evaluated technology and physiotherapy as the comparator. A study was considered to be of low quality if it scored ten or lower out of the possible nineteen on the CHEC criteria list [30]. Seven studies, from which the references can be seen in Table 4, did not fulfil the general knock-out criteria. The studies of Cherkin et al. (2001) [32] and Wright, Lloyd-Davies, Williams et al. (2005) [33] did not fulfil the first and the third general knock-out criteria. In the studies of Karjalainen et al. (2003 + 2004) [34, 35], Molde Hagen, Eriksen and Ursin (2000) [36] and Molde Hagen, Grasdal and Eriksen (2003) [36] the right evaluated technology was not available. The studies of Cherkin, Deyo, Battie et al. (1998) [38], Klaber Moffet et al. (1999) [39] and Torstensen, Ljunggren, Meen et al. (1998) [40] had not enough quality and did not fulfil the third criterion.
35
Chapter 3 After passing the general knock-out criteria, the specific knock-out criteria were applied to the seven studies which passed the general knock-out criteria. Table 4 Characteristics of the studies on chronic non-specific low back pain Reason Country Intervention knock-out Studies not passing knock-out criteria (group 1) Cherkin Evaluator Acupuncture, massage versus self-care USA (2001)[32] and quality education Cherkin Physical therapy, chiropractic manipulation Quality USA (1998) [38] versus educational booklet Karjalainen Mini-intervention, work site visit versus Evaluator Finland [34, 35] usual care Klaber Quality UK Exercise group versus usual care Moffet [39] Study
Molde Hagen [36, 37]
Evaluator
Norway Intervention group versus usual care
Perspective
12 months 24 Health care months 12 Societal months Societal and health 12 care months Costs 12 months, Societal effects 36 months Social security 12 office months 2 Not clear months HMO/ health care
Torstensen Medical exercise therapy, conventional Quality Norway [40] physiotherapy versus self exercise Evaluator Wright [33] UK Usual care versus advice group and quality Usual care, light multidisciplinary treatment Social security Skouen [41]Perspective Norway versus extensive multidisciplinary treatoffice ment Transferable studies (group 2) Brown [42] Fairbank & RiveroArias [43, 44] Frost & RiveroArias [45, 46] Kääpä [47] Skargren [48]
-
UK BEAM [49, 50]
36
USA
Back school versus comparison
UK
Spinal fusion surgery versus intensive reha- Societal/health bilitation care
UK
Advice group versus physiotherapy group
Societal
26 months
6 months 24 months
Societal and health 12 care months
Multidisciplinary group rehabilitation verSocietal sus individual physiotherapy Chiropractic group versus physiotherapy Sweden Societal group Exercise program, spinal manipulation proUK Health care gram, combined treatment versus usual care Finland
Time horizon
24 months 12 months 12 months
Assessment of Welte’s model Transferability check: specific knock-out criteria The following factors were found to have a high relevance for this particular case: perspective, medical cost approach, productivity cost approach, and productivity and work-loss time. All studies in this case originate either from West European countries or from the United States. Nevertheless are within this case, chronic nonspecific low back pain, no large differences between these countries and the Netherlands in patient population and in their main health care characteristics. The health care for patients with chronic low back pain is largely comparable between the study countries, therefore the practice variation and the technology availability is limited. Next to that, the Dutch prices were used for the calculations for the predictions. The relevant population characteristics for this case, incidence/prevalence; case-mix; health-status preference; acceptance, compliance and incentives to patients and productivity and work-loss time are with the exception of the last criterion practically the same between the study countries. The health care and population characteristics are therefore less important in this study, because of the similarities between the countries [6]. Six of the seven studies were, partially, transferable to the Netherlands. The study of Skouen, Grasdal, Haldorsen et al. (2002) was not transferable because of differences in perspective, medical cost approach and because of problems with the data extraction [41]. The foreign studies were divided into two different groups. All studies that did not pass the general knock-out criteria or the specific knock-out criteria are in group 1. The second group comprises the studies that are considered to be transferable to the Netherlands. In the “all studies prediction” the results of group 1 are included and in the “Welte’s model prediction” the studies included in group 2 were used. Comparing predictions The results of the “all studies prediction”, the “Welte’s model prediction” and the Dutch reference study (Van der Roer, 2006) [12] were compared with each other. The results are presented in the Tables 5a and 5b. It is evident that the cost estimations between the two predictions differ. In the “all studies prediction” the highest costs was for the physiotherapy group and this was caused by the high costs of sick leave. The average number of days of sick leave was 32.3 days in the physiotherapy group and in the other prediction this was 10.3 days. This high average in the physiotherapy group was caused by the study of Torstensen et al. [40], which reported a high number of days of sick leave. As a result the average days of sick leave were high and this also influenced the total costs for the physiotherapy group substantially. In the “Welte’s model prediction” the highest total costs were for the multidisciplinary treatment group. The treatment costs of the multidisciplinary treatment were higher than the costs of physiotherapy in this prediction. This could 37
Chapter 3 be explained by the intensity of the multidisciplinary treatment and the staff needed. Table 5a Recalculation of costs using Dutch prices
International Studies Studies not passing knock-out criteria (group 1) Cherkin (2001) [32] Cherkin (1998) [38] Karjalainen [34, 35] Klaber Moffet [39] Molde Hagen [36, 37] Torstensen [40] Wright [33] Skouen [41] Transferable studies (group 2) Brown [42] Fairbank [43]& Rivero-Arias (2005)[44] Frost [45]& Rivero-Arias (2006) [46] Kääpä [47] MDT physio Skargren [48] UK BEAM [49, 50] Predictions (base case) All studies prediction (group 1) MDT physio Welte’s model prediction (group 2) Cmdt: costs multidisciplinary treatment Csl: costs of sick leave E: effect of treatment
MDT physio
Cmdt*
Cphysio*
Csl*
100 154 154 251 3670
162 185 833 -
1257 4442 4402 -
111 463 148 218
2698 2533 3150
1804 -
303
2388 9186
Ch*
E
31
1537
294 259 12
0.88 0.77
132 87
0.48 0.74
40 141
0.64
216 185
0.68 0.72
32508
2244
3367 2388 132 0.48 351 2925 121 0.69 Cphysio: costs physiotherapy Ch : costs of health care consumption * All prices in 2004 euros in the Netherlands
The difference in effect, expressed in QALYs, between the two treatment options was rather large in the “Welte’s model prediction”, namely 0.21 QALYs in favour of the physiotherapeutic treatment. In the “all study prediction” the difference was 0.04 in favour of the physiotherapy group. In the sensitivity analyses the differences in QALYs ranged from -0.26 to 0.11. In the Dutch study the multidisciplinary treatment was more effective, but also more expensive. The ICER was favourable for the multidisciplinary treatment, but this was mainly caused by a small difference in costs. In the next step the “all studies prediction” and the “Welte’s model prediction” were compared to the Dutch study. The difference in effect was high, namely -0.04 for the “all studies prediction” and -0.21 for the “Welte’s model prediction” versus 0.03 for the Dutch study. The cost differences in the predictions were larger than in
38
Assessment of Welte’s model the Dutch results. For the “all studies prediction” the difference in costs was €-5266 in favour of the multidisciplinary treatment and in the “Welte’s model prediction” the difference was €2490, whereas in the Dutch study it was €233. The main reason for the differences in costs between the predictions and the Dutch results was the higher costs of the multidisciplinary treatment in the predictions, whereas in the “all studies prediction” the costs of sick leave in the physiotherapy group were much higher. Table 5b Results of the two predictions and the Dutch study Cmdt* Predictions (base case) All studies prediction (group 1) Welte’s model prediction (group 2) Sensitivity analysis All studies prediction (group 1)
Welte’s model prediction (group 2)
high
low high
low
Dutch study Van der Roer [12] Cmdt: costs multidisciplinary treatment Csl: costs of sick leave E: effect of treatment
Cphysio* Csl*
Ch*
MDT physio MDT physio
1804 3367 -
303 351
2388 9186 2388 2925
216 185 132 121
MDT
4442
-
2533
303
physio MDT physio MDT
100 4442
833 111 -
32508 2244 1537 2533
356 76 83 132
physio
-
463
3150
171
MDT physio
1257 -
111
2244 2698
132 83
MDT physio
779 -
ΔC -5266 2490
E
ΔE 0.67 0.72 0.48 0.69
-0.04 -0.21
0.88 -26.419 685 3323 741
0.77 0.48 0.64 0.48 0.74 0.48 0.64
0.11 -0.16 -0.26 -0.16
2806 307 233 0.03 312 2933 412 Cphysio: costs physiotherapy Ch : costs of health care consumption * All prices in 2004 euros in the Netherlands
The results in Figure 2 indicate the differences in total costs of the two treatment groups between the two predictions and the Dutch study. The highest correspondence concerning the total costs for the multidisciplinary treatment is between the “all studies prediction” and the Dutch study. The total costs by the “Welte’s model prediction” are just outside the confidence interval of the Dutch study. For physiotherapy, the results are different. In this case the total costs of the physiotherapy group by the “Welte’s model prediction” is almost comparable with the total costs in the Dutch study. The total costs by the “all studies prediction” are considerable higher than of the “Welte’s model prediction” and the Dutch study.
39
Chapter 3
12000 10000 8000 6000 4000 2000 0 MDT
MDT
MDT
physio
physio
physio
all studies prediction
Welte's model prediction
Dutch study
all studies prediction
Welte's model prediction
Dutch study
Figure 2 Plot of the total costs of the two predictions and the Dutch study
Discussion Model of Welte The two predictions differ in both the costs and effect estimations of the multidisciplinary treatment and physiotherapy. Using Welte’s model yield better results for the cost prediction than when the foreign results are applied straightforward in the decision country, but the effectiveness prediction was less accurate. Because of the differences between the “all studies prediction” and the “Welte’s model prediction”, it can be concluded that Welte’s model does influence the final results. The differences between the “all studies” and the “Welte’s model prediction” are caused by both the general and specific knock-out criteria. Seven studies were deleted by the general knock-out criteria and mainly by the third criterion (five out of seven studies) and one study by the specific knock-out criteria. The “Welte’s model prediction” was better in the costs estimations than the “all studies prediction”, because the estimation was more alike the Dutch results. However, the “all studies prediction” had the highest correspondence with the Dutch results concerning the effects estimation. In this case the general knock-out criteria had the most influence on the transferability of studies. It seems that if a study has a good methodological quality, the chance increases that the study is transferable. Another finding is that the model focuses mainly on the transferability of costs.
40
Assessment of Welte’s model Difficulties encountered during the making of the predictions The first difficulty with making the current predictions was the diversity among the multidisciplinary treatments as described in the foreign studies. Therefore, some variation could be observed between the foreign studies and also between the foreign studies and the reference study. This difficulty will occur in almost every treatment, which is caused by small differences in definition and practice variation between settings. The second difficulty occurred with the parameters ‘medicine’ and ‘imaging techniques’. This difficulty is influenced by two problems. The first was the availability of the data on these two parameters and the second is the large practice variation between countries. In the available data it was unclear which drug was prescribed or which imaging technique was used. Therefore it was not possible to value these parameters at the right prices. Furthermore, it is known that large practice variations exist between countries, for example in drug prescriptions and standard of care. As a consequence, it was decided to exclude these parameters from the predictions. The third difficulty is that an additional test of the Welte criteria would have been comparing studies which pass versus those which do not pass the specific knock-out criteria, while excluding all those not passing the general knock-out criteria. A supplementary comparison, in this study, could be solely with the studies that did not pass the specific knock-out criteria. This comparison indicates the importance of the specific knock-out criteria. However, by this case only one study did not pass these criteria. Therefore, the preferred comparison gave no or not much extra information compared with the two current included predictions. Problems and recommendations concerning Welte’s model The main problem of Welte’s model, within this study, is that only the methodological characteristics could be assessed without using extra information outside the articles. A large problem when transferring studies is the complexity of judging the health care and population characteristics. This extra information was not readily available. These characteristics and their corresponding factors are often not stated in the articles. The transferability literature [2-4] reveals that there is enough reason to believe that these factors influence the transferability of economic evaluations. However, in this case the health care and population characteristics were not applied, because of the high similarity between the study countries and the decision country. The population and the health care system corresponded sufficiently between the countries and therefore it was not considered necessary to correct these characteristics. The third general knock-out criterion states that the study should possess an acceptable quality, but it is not clear how the quality should be assessed by Welte [6]. Some common quality criteria for economic evaluations, like perspective and dis41
Chapter 3 count rate, are now used as transferability factors. However, it is known that between countries the guidelines for economic evaluations and the quality criteria differ. By stating general quality criteria this criterion will become clearer. Another problem of Welte’s model is the overlap between some of the factors, for instance between the factors ‘practice variation’ and ‘technology availability’ or ‘medical cost approach’ and ‘absolute and relative prices’. As a consequence, it is harder to assess these factors. This makes it more difficult to use Welte’s model. The last problem deals with the lack of attention for the transferability of effects. Almost all specific knock-out criteria discuss the transferability of cost parameters. Only the criterion ‘health status preference’ focuses solely on the transferability of effects. However, some criteria have an influence on both costs and effects. Furthermore, more attention should be given to how and with which instrument the effects are measured in a study, because this could influence the effect parameter. It is known from the literature that the valuation of health states and the instruments used vary from country to country [51]. Therefore, this should be taken into account when transferring effect data to other countries. This could be a new factor in an improved version of Welte’s model. At this moment Welte’s model is mainly focused on the idea to assess the transferability of whole studies. In the case that a study as a whole is not transferable, it could be that a study section is still usable. Therefore, a second option to improve Welte’s model is to give more attention to the possibility to assess the transferability of a section or sections of a study. By making it easier to assess the transferability of sections of studies more information might be available to calculate a prediction for the decision country. Implications of the results Welte et al. (2004) [6] stated that it is possible to transfer data to other settings, but the results were not compared with data from the decision country. The results of this study indicate that it is feasible to transfer data to the Netherlands. However, more case studies should be subjected to Welte’s model before a final conclusion can be drawn. In this study it was difficult to distinguish the effects of the general knock-out from the effects of the specific knock-out criteria. By this case, it is not clear why most studies passing the general knock-out criteria also passed the specific knock-out criteria. It is not clear whether this is due to this specific case. Therefore, this needs to be clarified by applying Welte’s model to another case. The results of one case study, as presented in this article, is too limited to draw final conclusions on the functioning of Welte’s model. In addition, Welte’s model is not the only existing model to assess the transferability of economic evaluations. Boulenger et al. [3], Urdahl et al. [9] and Nixon et al. [10] are all published methods that by using a checklist try to assess the transferability of 42
Assessment of Welte’s model studies. By the method of Boulenger et al. the answers to the questions lead to a transferability information score [3]. Nixon et al. have developed a method which is related to that of Boulenger. The economic evaluations are assessed with the help of a questionnaire that is based on the guidelines from BMJ [9]. However, it is hard to determine what these scores indicate, because no standards are available. The method of Urdahl et al. is developed for decision-analytic models to assess whether articles provide enough information to decision makers [9]. A combination of the Welte and Boulenger methods is suggested by Antoñanzas et al. [52]. The principle of general knock-out criteria is adopted from Welte, but the scoring system and the questions are based on Boulenger [52]. Nixon et al. is a supplementary paper on the method of Boulenger whereby some points of criticisms are discussed [53]. However, the interpretation of the scoring remains unclear. Given these recent developments, the next step will be to test the applicability of the methods of Boulenger [3, 53] and Antoñanzas [52]. To improve Welte’s model, additional research on the transferability of effects and on other transferability factors is needed. At the moment it is considered that effects are comparable in all countries, but more research is needed in this field [51]. Furthermore, in the literature [2-4] several transferability factors are listed, but it is yet unknown which factors have the most influence. When this is known, it will be easier to develop a new method for determining the transferability of economic evaluations. Welte’s model could then be used as a template. Welte’s model worked reasonably well in this case, but improvements are necessary to make the model easier to use.
43
Chapter 3
References 1. 2. 3. 4.
5. 6. 7. 8.
9. 10.
11. 12.
13. 14.
15.
16. 17. 18.
19. 20.
Drummond MF, Bloom BS, Carrin G, et al. Issues in the cross-national assessment of health technology. Int J Technol Assess Health Care. 1992; 8(4):671-82. Greiner W, Schöffski O, Graf von der Schulenberg JM. The transferability of international economic health-economic results to national study questions. HEPAC. 2000; 1:94-102. Boulenger S, Nixon J, Drummond MF, et al. Can economic evaluations be made more transferable? Eur J Health Econ. 2005; 4(6):334-46. Drummond MF, Pang F. Chapter 11 Transferability of economic evaluation results. In: Drummond MF, McGuire A, editors. Economic evaluation in health care Merging theory with practice. Oxford: Oxford University Press; 2005. CCOHTA. Guidelines for economic evaluation of pharmaceuticals. Ottawa, Canada: Canadian Coordinating Office for Health Technology Assessment; 1997. Welte R, Feenstra F, Jager H, Leidl R. A decision chart for assessing and improving the transferability of economic evaluation results between countries. Pharmacoeconomics. 2004; 22 (13): 857-76. Barbieri M, Drummond MF, Rutten F, et al. Variability in cost-effectiveness estimates for pharmaceuticals in Western Europe: Lessons for inferring generalizability. Value Health. 2005: 8(1): 10-23. Oostenbrink JB, Bouwmans CAM, Koopmanschap MA, Rutten FFH. Handleiding voor kostenonderzoek. Methoden en standaard kostprijzen voor economische evaluaties in de gezondheidszorg. Diemen: College voor zorgverzekeringen; 2004. Urdahl H, Manca A, Sculpher MJ. Assessing generalisability in model-based model-based economic evaluation studies. A structured review in osteoporosis. Pharmacoeconomics. 2006; 24(12); 1181-97. Nixon J, Pang F. Economic evaluations in Japan: a review of published studies, methodological issues and practice. In: Probabilistic safety assessment and management 5. Vol. 3. Kondo S, Furuta K (eds.) Universal Academy Press Inc.; Tokyo. 2000; 2077-84. Caro J, Klittich W, McGuire A, et al. International economic analysis of primary prevention of cardiovascular disease with pravastatin in WOSCOPS. Eur Heart J. 1999; 20:263-8. Van der Roer N, Van Tulder M, Van Mechelen W, De Vet H. Economic evaluation of an intensive group training protocol compared with usual care physiotherapy in patients with chronic low back pain. Spine. 2008; 33(4): 445-451. Onrust S, Smit F, Willemse G, et al. Cost-utility for older windowed individuals: randomised trial. BMC Health Serv Res. 2008; 8: 128. Van den Hout WB, Peul WC, Koes BW, et al. Prolonged conservative care versus early surgery in patients with sciatia from lumbar disc hernation: cost-utility analysis alongside a randomized controlled trial. BMJ. 2008; 336(7657): 1351-4. Bulthuis Y, Mohammed S, Braakman-Jansen LM, et al. Cost-effectiveness of intensive exercise therapy directly following hospital discharge in patients with arthritis: results of a randomized controlled trial. Arthritis Rheum. 2008; 59(2): 247-54. Zijlstra TR, Braakman-Jansen LM, Taal E, et al. Cost-effectiveness of Spa treatment for fibromyalgia: general health improvement in not for free. Rheumatology. 2007; 46(9): 1454-9. Oude Voshaar RC, Krabbe PF, Gorgels WJ, et al. Tapering off benzodiazepines in long-term users: an economic evaluation. Pharmacoeconomics. 2006; 24(7): 683-94. Korthals-de Bos IB, Gerritsen AA, Van Tulder MW et al. Surgery is more cost-effective than splinting for carpal tunnel syndrome in the Netherlands: results of an economic evaluation alongside a randomized controlled trial. BMC Musculoskelet Disord. 2006; 7: 86. Steenstra IA, Anema JR, Van Tulder MW, et al. Economic evaluation of a multi-stage return to work program for workers on sick-leave due to low back pain. J Occup Rehabil. 2006: 16(4): 557-78. Van den Hout WB, De Jong Z, Munneke M, et al. Cost-utility and cost-effectiveness analyses of a long-term, high-intensity exercise program compared with conventional physical therapy in patients with rheumatoid arthritis. Arthritis Rheum. 2005; 53(1): 39-47.
44
Assessment of Welte’s model 21. Van den Hout WB, Vermeulen HM, Rozing PM, Vliet-Vlieland TP. Impact of adhesive capsulitis and economic evaluation of high-grade and low-grade mobilisation. Aust J Physiother. 2005; 51(3): 1419. 22. Korthals-de Bos IB, Smidt N, Van Tulder MW, et al. Cost effectiveness of interventions for lateral epicondylitis: results from a randomised controlled trial in primary care. Pharmacoeconomics. 2004; 22(3): 185-95. 23. Van Dieten HE, Perez HS, Van Tulder MW, et al. Cost effectiveness and cost utility of acetylcysteine versus dimethyl sulfoxide for reflex sympathetic dystrophy. Pharmacoeconomics. 2003; 21(2): 13948. 24. Van den Hout WB, Van der Linden YM, Steenland E, et al. Single- versus multi-fraction radiotherapy in patients with painful bone metastases: cost-utility analysis based on a randomized trial. J Natl Cancer Inst. 2003; 95(3): 222-9. 25. Van den Hout WB, Tijhuis GJ, Hazes JM, et al. Cost effectiveness and cost utility analysis of multidisciplinary care in patients with rheumatoid arthritis: a randomised comparison of clinical nurse specialist care, inpatient team care, and day patient team care. Ann Rheum Dis. 2003; 62(4): 308-15. 26. Korthals-de Bos IB, Hoving JL, Van Tulder MW, et al. Cost effectiveness of physiotherapy, manual therapy, and general practioner care for neck pain: economic evaluation alongside a randomised controlled trial. BMJ. 2003; 326(7395): 911-6. 27. Goossens MEJB, Evers SMAA. Economic evaluations in back pain interventions. J Occup Rehabil. 1997; 7(1):15-32. 28. Van der Roer N, Goossens MEJB, Evers SMAA, Van Tulder MW. What is the most cost-effective treatment for patients with low back pain? A systematic review. Best Prac Res Clin Rheumatol. 2005; 19(4):671-84. 29. Goossens MEJB, Evers SMAA. Chapter 19 Cost-effectiveness of treatment for neck and low back pain. In: Nachemson AL, Jonsson E, editors. Neck and back pain. The scientific evidence of causes, diagnosis, and treatment. Philadelphia: Lippincot Williams & Wilkins; 2000. 30. Evers SMAA, Goossens MEJB, De Vet HC, et al. Criteria list for assessment of methodological quality of economic evaluations. Consensus on Health Economic Criteria. Int J Technol Assess Health Care. 2005; 21(2):240-5. 31. Walschots J. De wijziging van het referentiejaar van de geharmoniseerde consumentenprijsindex. [Internet] 2006 [cited 2006 December, 13th]; Available from: www.cbs.nl/NR/rdonlyres/9F951B2A14EA-43EC-ACE35003B34651C3/0/2005wijzigingreferentiejaargeharmoniseerdeconsumentenprijsindexart.pdf 32. Cherkin DC, Eisenberg D, Sherman KJ, et al. Randomized trial comparing traditional Chinese medical acupuncture, therapeutic massage and self-care education for chronic low back pain. Arch Intern Med. 2001; 161:1081-8. 33. Wright A, Lloyd-Davies A, Williams S, et al. Individual active treatment combined with group exercise for acute and subacute low back pain. Spine. 2005; 30(11):1235-41. 34. Karjalainen K, Malmivaara A, Mutanen P, et al. Mini-intervention for subacute low back pain. Two years follow-up and modifiers of effectiveness. Spine. 2004; 29(10):1069-76. 35. Karjalainen K, Malmivaara A, Pohjolainen T, et al. Mini-intervention for subacute low back pain. Spine. 2003; 28(6):533-40. 36. Molde Hagen E, Eriksen HR, Ursin H. Does early intervention with a light mobilization program reduce long-term sick leave for low back pain? Spine. 2000; 25(15):1973-6. 37. Molde Hagen E, Grasdal A, Eriksen HR. Does early intervention with a light mobilization program reduce long-term sick leave for low back pain: a 3-year follow-up study. Spine. 2003; 28(20):2309-16. 38. Cherkin DC, Deyo RA, Battie M, et al. A comparison of physical therapy, chiropractic manipulation and provision of an educational booklet for the treatment of patients with low back pain. N Engl J Med. 1998; 339:1021-9. 39. Klaber Moffet J, Torgerson D, Bell-Syer S, et al. Randomised controlled trial of exercises for low back pain: clinical outcomes, costs and preferences. BMJ. 1999; 319:279-83.
45
Chapter 3 40. Torstensen TA, Ljunggren AE, Dyre Meen H, et al. Efficiency and costs of medical exercise therapy, conventional physiotherapy and self-exercise in patients with chronic low back pain. A pragmatic, randomized, single-blinded, controlled trial with 1-year follow-up. Spine. 1998; 23(23):2616-24. 41. Skouen JS, Grasdal A, Haldorsen EMH, Ursin H. Relative cost-effectiveness of extensive and light multidisciplinary treatment programs versus treatment as usual for patients with chronic low back pain on long-term sick leave. Spine. 2002; 27(9):901-10. 42. Brown KC, Sirles AT, Hilger JC, Thomas MJ. Cost-effectiveness of a back school intervention for municipal employees. Spine. 1992; 17(10):1224-8. 43. Fairbank J, Frost H, Wilson-MacDonald J, et al. RCT to compare surgical stabilisation of the lumbar spine with an intensive rehabilitation programme for patients with chronic low back pain: the MRC spine stabilisation trial. BMJ. 2005; 330:1233-9. 44. Rivero-Arias O, Campbell H, Gray A, et al. Surgical stabilisation of the spine compared with a programme of intensive rehabilitation for the management of patients with chronic low back pain: costutility based on a randomised controlled trial. BMJ. 2005; 330: 1239-44. 45. Frost H, Lamb SE, Doll HA, et al. Randomised controlled trial of physiotherapy compared with advice for low back pain. BMJ. 2004; 329(7468):708-13. 46. Rivero-Arias O, Gray A, Frost H, et al. Cost-utility analysis of physiotherapy treatment compared with physiotherapy advice in low back pain. Spine. 2006; 31(12):1381-7. 47. Kääpä EH, Frantsi K, Sarna S, Malmivaara A. Multidisciplinary group rehabilitation versus individual physiotherapy for chronic non-specific low back pain. A randomized trial. Spine. 2006; 31(4):371-6. 48. Skargren EI, Oberg BE, Carlsson PG, Gade M. Cost and effectiveness analysis of chiropractic and physiotherapy treatment for low back and neck pain. Spine. 1997; 22(18):2167-77. 49. UK BEAM Trial Team. Cost-effectiveness of physical treatment for back pain in primary care. BMJ. 2004; 329(7479):1381-6. 50. UK BEAM Trial Team. United Kingdom back pain exercise and manipulation (UK BEAM) randomised trial: effectiveness of physical treatment for back pain in primary care. BMJ. 2004; 329(7479):138895. 51. Brazier J, Ratcliffe J, Salomom JA, Tsuchiya A. Chapter 11 Measuring and valuing health: an international perspective. In: Brazier J, Ratcliffe J, Salomom JA, Tsuchiya A, editors. Measuring and valuing health benefits for economic evaluation: Oxford University Press; 2007. 52. Antoñanzas F, Rodriguiz-Ibeas R, Juarez C, et al. Transferability indices for health economic evaluations: methods and applications. Health Econ. 2009; 18: 629-43. 53. Nixon J, Rice S, Drummond D, et al. Guidelines for completing the EURONHEED transferability information checklist. Eur J Health Econ. 2009; 10: 157-65.
46
Chapter 4
The transferability of valuing lost productivity across jurisdictions. Differences between national pharmacoeconomic guidelines
S Knies, JL Severens, AJHA Ament, SMAA Evers Value in Health 2010; 13(5): 519-527
47
Chapter 4
Abstract Background: For at least two decades there has been an intense debate on whether and how to include the value of lost productivity in economic evaluations. This debate is often reflected in pharmacoeconomic guidelines, which have been developed to indicate the methods and requirements for the design, execution and reporting of economic evaluations in a particular country. Objective: To examine what various national pharmacoeconomic guidelines recommend regarding the identification, measurement and valuation of lost productivity. Methods: First, the theoretical framework on how lost productivity can be identified, measured, and valued is described. Second, a summary sheet has been used to identify various pharmacoeconomic guidelines recommendations regarding the value of lost productivity. Results: Twenty-two of the thirty guidelines identified recommend performing economic evaluations using the societal perspective. However, even if the societal perspective is recommended it is not always clear how the value of lost productivity should be taken into account. Most guidelines recommend including the costs of absenteeism from paid and/or unpaid work. In addition, although no agreement exists on how lost productivity should be valued, none of the guidelines recommended using the US panel approach for the valuation of lost productivity. Discussion: The different recommendations hinder international transferability of the value of lost productivity. This difficulty is mainly caused by different recommendations regarding identification and valuation. These differences result from the debate and lack of consensus on including the value of lost productivity losses in economic evaluations. It will become easier to transfer data across jurisdictions if all data are reported transparently.
48
Lost productivity in national guidelines
Introduction During the last two decades there has been disagreement about whether or not the value of lost productivity should be included in economic evaluations and, if so, how these losses should be valued [1]. One of the areas of discussion is the methodology that has been advocated for the valuation of these losses [1-3]. The US panel states that lost productivity influences the health-related quality of life of people and that consequently the losses should be assessed in the quality-adjusted life-year (QALY) [4], while others state that the lost productivity should be incorporated in the costs [1, 2]. Furthermore, the adequate identification of the value of lost productivity, especially in the short-term, is still an under-researched area. Nevertheless, the importance of correct identification should not be underestimated. Due to the different ideas about identification, measurement and valuation, pharmacoeconomic guidelines differ in their recommendations on this topic [1]. Several countries have developed pharmacoeconomic guidelines [5].National guidelines are developed primarily to indicate the requirements for the design, execution and reporting of the results of economic evaluations in a specific country [5, 6]. These guidelines are utilized to improve the quality of economic evaluations by encouraging good research practice. This should lead to greater standardization, which in turn should increase the comparability of studies and may increase the generalisability of results [6]. Results are considered generalisable if they can be applied to other settings without any adjustments [7]. However, country-specific guidelines may stipulate, in addition to the use and presentation of local data, the use of specific methods as well. As a result, the requirements stated in various national guidelines are not always comparable [7, 8]. Moreover, there are several factors that may cause variations in the cost-effectiveness estimates of health technologies from place to place, and these will hinder the transferability of economic evaluations [7, 9]. Data are considered transferable if they can be adapted to apply to other settings or jurisdictions [7]. Therefore, it can be considered reasonable for national guidelines to stipulate that economic evaluations be relevant to the local context as well [7, 9]. One of the possible differences between national guidelines is the recommended perspective. When performing an economic evaluation, an explicit statement should be given regarding the perspective from which costs and effects are estimated. There is a strong theoretical preference that economic evaluations should be performed from a societal perspective, but many studies are carried out from more narrow perspectives. This theoretical preference for the societal perspective is related to the foundations of economic evaluations in welfare economics, which is concerned with the welfare of society [2, 10]. Therefore an overall assessment of the efficiency of a technology should consider the various consequences from a larger societal perspective and not just for the individuals who are directly involved 49
Chapter 4 [2]. As a consequence, when economic evaluations are carried out from the societal perspective, the value of lost productivity should be included in the analysis, which might not be the case when using a more narrow perspective [2, 3]. See Figure 1, section A ‘Perspective’.
Figure 1 Valuing health related lost productivity 50
Lost productivity in national guidelines The terms ‘production cost’, ‘productivity cost’, ‘production loss’ and ‘productivity loss’ all refer to the monetary valuation of a reduction in productivity. In this respect, Brouwer et al. (1997) define productivity costs as “costs associated with working time lost and replacement costs due to illness, disability and death of productive persons, both paid and unpaid” [11]. In contrast, the term ‘value of lost production’ refers to both the monetary valuation and valuation in effects of a reduction in productivity. Therefore, in this article we will use the term ‘productivity costs’ and ‘(value of) lost productivity’ accordingly. Considering the fact that productivity reduction related to disease can be substantial - for example the costs of lost productivity can exceed health care costs - clear guidance is needed on how to value lost productivity in economic evaluations [12]. When various national guidelines have different recommendations regarding the identification, measurement and valuation of lost productivity, it hinders or makes it harder to transfer data across jurisdictions. In this study thirty national pharmacoeconomic guidelines were compared with each other regarding lost productivity, and a summary sheet was used to identify the recommendations in the various guidelines. Accordingly, the objective of this study is to examine what the existing national pharmacoeconomic guidelines recommend regarding the identification, measurement and valuation of lost productivity. First, the theoretical background of the value of lost productivity is described in three steps within the theoretical framework. Second, the methodology section describes the requirements of the national pharmacoeconomic guidelines and the development of the summary sheet. In the results section the different recommendations of the guidelines regarding lost productivity are summarized, and in the discussion, conclusions are drawn from the results.
Theoretical framework Identification In section B ‘Identification’, of Figure 1, the alternative operationalisations of lost productivity can be found. The value of lost productivity is often divided into paid working time, non-paid working time and leisure time [1, 13, 14]. Lost productivity in paid working time can occur in the following situations: being present at work but working at a reduced capacity due to health problems (presenteeism); or being absent from work (absenteeism). In absenteeism the distinction can be made between short- and long-term absenteeism, where short term absenteeism is being defined as absenteeism shorter than six weeks. In addition, mortality and permanent disability can be categorised as a kind of long-term absenteeism. Moreover, transitions
51
Chapter 4 between these types of reduced productivity are possible [1, 14-16]. This division is also useful for the identification of lost productivity in non-paid labour. One of the most common phenomena of lost productivity is presenteeism in paid working time. There are two situations in which presenteeism may occur: when health problems do not result in absenteeism yet do result in lost productivity, and when health problems cause not only absenteeism but also lost productivity during a period of time before and after absence. Furthermore, compensation mechanisms may limit productivity loss, but it is unclear how effective these mechanisms are. When an employee makes up for lost work by working overtime on his return to the workplace, this may lead to additional costs for the employer or to reduced leisure time. If the lost work is compensated for during normal working hours, this may be carried out during breaks or by working at a faster pace [17]. Identifying the value of lost productivity, in effect using a single effect measure covering both the consequences of morbidity and mortality, obviously leads to using the QALY-concept. Of course, the point of controversy - whether lost productivity should be valued in monetary or effect terms - influences not only the identification, but also the measurement and the valuation of lost productivity [18-20]. Measurement in costs and QALYs Section C ‘Measurement, of Figure 1, shows that, depending on the identification phase, lost productivity can be measured in various ways. The most appropriate method for measuring the value of lost productivity is still under discussion mainly because the adequate measurement of short term lost productivity is still an underresearched area [1, 2]. For paid labour, data from human resource departments may be unreliable and data on presenteeism and compensation mechanisms are mostly not taken into account due to difficulties with measuring these types of lost productivity. Therefore, many economic evaluations utilize patient-reported measures of lost productivity [5]. Most of these instruments assess the reduction in input due to absenteeism or presenteeism. The problem is that hardly any of the existing instruments have been completely validated. Furthermore, large differences in productivity costs can be found depending on the instrument used [21, 22]. At the moment, questionnaires for patient-reported data are an acceptable method for measuring the value of lost productivity; taking into account that, in our opinion, the ideal instrument would capture absenteeism, presenteeism and compensation mechanisms. The use of questionnaire for patient-reported lost productivity is the only method for measuring lost productivity in non-paid labour [5]. The measurement of the QALY may be realised through randomized controlled trials, observational data, uncontrolled experiments and expert opinion, possibly in combination with life expectancy data. The QALY weights must be preferencebased, interval-scaled and measured or transformed into an interval scale in which 52
Lost productivity in national guidelines the score of 0.0 is the reference point for ‘death’ and the score of 1.0 indicates ‘perfect health’ [4]. Table 1 Methods for valuing lost productivity in economic evaluations
Valuation Calculation
Human Capital Friction Cost Method Approach (HCA) (FCM) valuation in monetary way - multiply gross wage - value productivity by number of sick days losses of individuals with (2); estimation of value ill health during friction of all lost production (3) period (2)
Description
- value changes in the amount of time individuals are able to allocate to paid work as a result of illness (2) - measure of potential value of productivity loss due to illness (2)
Background
- based on neoclassical theory (2) - assumed that there is no unemployment (3)
Advantage
- relatively easy method to apply (2, 5) - useful for estimating productivity losses for unpaid labour (3) - overestimation of costs because compensation mechanisms are not taken into account (25) - overestimation of costs by death or disablement (5) - indirect costs for people outside labour force not included (24)
Disadvantage
- friction period: time it takes to replace and to train a replacement worker (2) - assumes that everyone can be replaced (5) - compensation mechanisms included in the valuation of changes in paid working time (2) - developed as alternative for perceived roughness of human capital approach (2) - assumes that absenteeism reduces the effective labour time less than proportionally (24) - more realistic method for quantifying production losses (3)
- rejects the key tenets of conventional microeconomic theory (2); no foundation in economic theory (24) - no overall agreement with assumptions used (23, 24)
US Panel Approach valuation in QALY - productivity losses should be valued through a generic preference-based measure (2) - time costs associated with morbidity assessed within QALY and placed in denominator (23) - separation of impact of illness on quality of life from effects on role function is difficult (23) - monetary valuation of productivity losses results in double counting if QALY is used as measure of benefit (2)
- no double-counting of productivity losses possible, because these losses are included in QALY (2) - underestimation of costs, because net wages and not the gross wages will be incorporated (2); not always link between inability to work and loss of income (2) - not in agreement with common view on the inclusion of costs (5)
53
Chapter 4 Valuation in costs and QALYs Section D ‘Valuation’, of Figure 1, indicates again that lost productivity can be valued in costs and in QALYs. The most frequently used methods for valuing productivity costs in paid labour are the Human Capital Approach (HCA) and the Friction Cost Method (FCM) [2]. The US panel approach is the only method for the valuation of lost productivity in the QALY. An overview of methods is given in Table 1. Previous research has indicated that the application of either the HCA or the FCM leads to different estimates of productivity losses. For example, in a Canadian study by Goeree et al. (1999) it was calculated that the HCA resulted in a sixty-nine times higher estimation than the FCM [26]. In an article by Koopmanschap et al. (2005) several ratios ranging from 1.03 to 3273 were presented, in which the FCM showed lower estimations of the productivity losses than did the HCA (1). Furthermore, Hutubessy et al. (1999) calculated the annual productivity losses of back pain in the Netherlands using both the HCA and FCM. The total costs for the HCA, including both absenteeism and disability, were US $1545 million, while the FCM showed costs of US $842 million [27]. Although it can be considered as a kind of absenteeism, the valuation of lost productivity due to mortality is not often taken into account when calculating lost productivity [2, 28]. Furthermore, in most economic evaluations little attention is paid to presenteeism. However, for some chronic diseases, the value of lost productivity due to presenteeism may be comparable or even higher than the costs of absenteeism and direct health care costs combined [17, 22, 28]. Presenteeism is most frequently mentioned and incorporated by advocates of the FCM [1, 2]. Compensation mechanisms may lead to lower estimates of lost productivity. Therefore, in order to calculate possible cost reductions, one should calculate the costs of compensation and the gains of the reduced value of the lost productivity. The net result of these two parts will be the reduction in costs as a result of compensation [17]. When using the societal perspective, lost productivity in non-paid labour becomes relevant [2]. Two monetary methods for valuing lost productivity in non-paid labour are the opportunity costs method and the shadow price method. In using the opportunity costs method, the input, or the sacrificed time is valued, and with the shadow price method the output, i.e. the commodities not produced, are valued. Shadow prices are often calculated using the wages of household help or by the gross wage-rate of individuals with paid work that closely matches the unpaid work [2, 28]. Opportunity costs are calculated using the value of forgone leisure time or the net wage that would be obtained by an individual if they were in paid employment [2]. According to the US panel, the effects of a health intervention on lost productivity are incorporated in the denominator of the cost-effectiveness ratio [4]. Therefore, the full impact of morbidity changes should be valued using preference-weighted measures of health-related quality of life [4, 20]. Furthermore, changes in life expec54
Lost productivity in national guidelines tancy are also included in the denominator and should therefore not be included in the numerator [4]. However, using the US panel approach, time spent by the patient in receiving treatment should be captured in the numerator by calculating the opportunity costs [4, 20].
Methods The International Society for Pharmacoeconomics and Outcomes Research (ISPOR) presents an overview of pharmacoeconomic guidelines around the world on their website (www.ispor.org/PEguidelines/index.asp). These pharmacoeconomic guidelines may be government regulatory documents, publications, or suggested guidance or best practices for conducting and using economic evaluations in health care and reimbursement decisions. On this webpage a comparative table of thirty-two main features of the guidelines is presented. Furthermore, the hyperlinks or the publication references are given for all guidelines [29]. Only the pharmacoeconomic guidelines that are included on this section of the ISPOR website were used for comparison. Consequently, most guidelines could be found using the hyperlinks or references given in the list of country-specific pharmacoeconomic guidelines on the ISPOR website. Pharmacoeconomic guidelines that could not be obtained from the website (Denmark, Finland and Switzerland) were retrieved by contacting researchers located in the respective countries. The guidelines of Brazil, China, Cuba, the Slovak Republic and South Korea were available only in their national language. In order to retrieve all relevant information from these guidelines, native or fluent speakers were contacted to obtain translations (see acknowledgements). We developed a sheet to systematically summarize the recommendations related to the perspective and identifying, measuring and valuing lost productivity as described in the guidelines. The summary sheet contained questions about lost productivity resulting from absenteeism, as well as lost productivity related to unpaid labour, compensation mechanisms and presenteeism. The summary sheet made it possible to include other remarks related to the value of lost productivity. Each pharmacoeconomic guideline was evaluated using this summary sheet, which will be made available online in the supplementary files.
Results In total thirty national pharmacoeconomic guidelines on how to perform economic evaluations were identified for the comparison. The vast majority of the guidelines, twenty-three, were guidelines from European and Northern American countries. The other seven guidelines were developed in Asia, Oceania or Latin America. The 55
Chapter 4 guideline of China is not included in the comparison, because the researchers contacted did not respond to our request for retrieving the required information from the guideline. Perspective of economic evaluations In total twenty-two of the thirty received guidelines recommended performing economic evaluations using the societal perspective [30-51]. However, the societal perspective is not the preferred perspective in all these guidelines. The guidelines that do not require or suggest the societal perspective often recommend performing economic evaluations from the perspective of the payer or of the health care sector [52-58]. As a result, these guidelines do not mention how the value of lost productivity should be included and were therefore not included in the rest of the comparison. However, even if the societal perspective is recommended, it is not always clear if and how lost productivity should be taken into account. For example, the Cuban guideline indicates that the societal perspective should be used, but the guideline does not indicate which costs should be identified, measured or valued. However, aspects of different costing methods, as for example the HCA, are detailed in the Appendix [40]. In addition, several guidelines that recommend using the societal perspective state that productivity losses should not be included in the base-case analysis [30, 31, 33, 43, 44, 48, 50]. Other guidelines state that the value of lost productivity should be taken into account only if it is relevant to the study question or if it is clear that productivity has changed due to the disease or treatment [32, 37, 42, 44, 45]. Figure 2 shows the process of handling and comparing the pharmacoeconomic guidelines as carried out in study.
Figure 2 Processing of pharmacoeconomic guidelines
56
Lost productivity in national guidelines Identification, measurement and valuation of lost productivity As indicated in the theoretical framework, lost productivity can be related to paid and non-paid working time and to leisure time. The distinctions of different types of lost productivity are not clear in all guidelines. For example, in the Austrian guideline no clear difference is made between short- and long-term absenteeism. Most guidelines, as can be seen in Table 2, recommend including the costs of absenteeism. However, some guidelines simply state that the value of lost productivity should be included in the analysis, but do not indicate which costs should be identified. Table 2 Identification of lost productivity in paid work as indicated in guidelines absenteeism
short
presenteeism mortality
long
unclear* X X
Austria (51) Brazil (38) Cuba (40) Denmark (32) Finland (43) France (34) Germany (41) Hungary (50) Ireland (45) Italy (35) Netherlands (36) Norway (31) Poland (44) Portugal (37) Russia (49)
X X
compensation permanent unclear ** functional impairment X X X
X X X X
X
X X X
X X
X X
X X
X X X
X
Slovak Republic (42) X South Korea (30) X X Spain (47) Sweden (39) Switzerland (48) X Thailand (46) X USA (33) X X * Unclear what kind of absenteeism should be included ** Unclear whether lost productivity should be included
X
X
X X X X
X X
The results shown in Table 2 make clear that, for example, the inclusion of presenteeism and compensation mechanisms is not consistently recommended. However, when looking at the recommendations in detail, several similarities can be identi57
Chapter 4 fied. The Hungarian, Dutch, Norwegian, South Korean and American guidelines all recommend including short- and long-term absenteeism. The guidelines of Austria, Brazil, Finland, France, Germany, Italy, Russia, the Slovak Republic, Switzerland and Thailand state that absenteeism should be included, but do not distinguish between short- and long-term absenteeism. Presenteeism should be included according to the guidelines of Germany, Russia and Switzerland. In addition, the guidelines of Austria, Brazil, the Netherlands, Norway, Russia, South Korea, Switzerland and Thailand recommend including mortality. Only the Austrian guidelines state that compensation mechanisms should be taken into account. The Norwegian guidelines are the only one that state that permanent functional impairment should be included as part of lost productivity. In the guidelines of Cuba, Denmark, Ireland, Poland, Portugal, Spain and Sweden it is not clear how lost productivity should be taken into account. Finnish guidelines indicate that not only should the value of lost productivity of paid work be identified and valued, but also the value of leisure time lost because of disease. However, it is not clearly stated how this should be done. The Russian guidelines recommend including the costs of absence from work for family members and other caregivers. Table 3 Measurement and valuation of lost productivity
Austria (51) Brazil (38) Cuba (40) Denmark (32) Finland (43) France (34) Germany (41) Hungary (50) Ireland (45) Italy (35) Netherlands (36) Norway (31) Poland (44) Portugal (37) Russia (49) Slovak Republic (42) South Korea (30) Spain (47) Sweden (39) Switzerland (48) Thailand (46) USA (33)
58
HCA X X
FCM X
X
X
US panel
Other method
Not clear
X X X X X X X
X X
X X X X
X X X X X X X
Lost productivity in national guidelines Measuring and valuing lost productivity As previously indicated, not all guidelines recommending the societal perspective indicate which productivity losses should be included, and this is also the case for the valuation of lost productivity. In the majority of the guidelines there is no description of how lost productivity should be measured and valued; this is clarified only in the national guidelines from France and South Korea. The French guidelines recommend using surveys to measure lost productivity in economic evaluations. Furthermore, the guidelines of South Korea state that the methodology for measuring the value of lost productivity depends on the cost items and the availability of data. However, questionnaires, databases, surveys and expenditure diaries are all mentioned as suitable methods. The results in Table 3 show that eleven guidelines recommend following the HCA, six guidelines recommend the FCM, and that none of the guidelines recommend the US panel approach. However, in six guidelines it is not clear which method should be used to value lost productivity. Although, for example, the Swiss guidelines do not indicate how lost productivity should be measured and valued, lost productivity is referred to as indirect costs. The Russian and the South Korean guidelines make no mention of the three methods for measuring and valuing productivity losses, but recommend using opportunity costs. The remaining guidelines recommending a societal perspective do not indicate how lost productivity should be valued.
Discussion Our study, examining what various national pharmacoeconomic guidelines recommend regarding the identification, measurement and valuation of lost productivity, clearly indicated differences between the guidelines. It can be concluded that the different recommendations hinder the transferability of data regarding the value of lost productivity. This is mainly caused by differences in the recommendations in the several guidelines. These differences reflect the debate on including the value of lost productivity in economic evaluations. As a result, no consensus exists among researchers, which has led to different recommendations. To begin with, not all guidelines recommend using the societal perspective. The use of the societal perspective is the most comprehensive option when performing economic evaluations, thus taking the value of lost productivity into account. However, the decision for the perspective is not the only choice which is relevant for the value of lost productivity. Although the Canadian guidelines recommend using the perspective of the health care sector, the guidelines include recommendations on the identification and valuation of lost productivity [54]. Furthermore, some guidelines recommending the societal perspective do not specify how the value of lost produc59
Chapter 4 tivity should be included in economic evaluations, while other guidelines have included only a few lines or a small paragraph on the subject. As a result, the information is often not clear or incomplete, leaving substantial degrees of freedom on exactly how to calculate the value of lost productivity. Significant differences exist between the guidelines on all aspects of identification, measurement and valuation of lost productivity. As recommendations on the identification of lost productivity differ greatly, this influences the final estimation. In addition, the different recommendations regarding the valuation of productivity losses will also result in different estimates. Previous research, as indicated in the theoretical framework, has shown that the application of the Human Capital Approach or of the Friction Cost Method leads to different estimates of productivity losses [1, 26, 27]. Furthermore, our results indicate that problems could arise concerning the transferability of data when the guidelines are complied with in all economic evaluations. As a consequence, if there is disagreement between the guidelines on the identification and valuation of lost productivity, it will be difficult to use these results in other countries. In addition, none of the twenty-two guidelines recommending a societal perspective indicate that the US panel approach should be used for valuing lost productivity. Therefore it can be concluded that in all guidelines lost productivity should be valued in costs and not in effects – despite concerns that the monetary valuation of lost productivity might result in double counting. For several reasons, only national pharmacoeconomic guidelines that are listed on the ISPOR website are included in this comparison, meaning that material from textbooks and national submission guidelines were not included. The national pharmacoeconomic guidelines have been developed by national governments, representative organisations of governments or professional organisations, but they could also be publications or documents with suggested guidance or best practices. We decided to use the list of guidelines of the ISPOR website, because we expect that national pharmacoeconomic guidelines are more often utilized as guidance for economic evaluations than are textbooks, particularly for the purpose of policy decision making. Furthermore, national guidelines indicate more clearly the viewpoints of researchers or decision making bodies on how economic evaluations should be performed within a specific jurisdiction than do textbooks that are usually written by researchers without any jurisdiction in mind. Due to the diversity of the recommendations in the guidelines, a lot of variation exists in the design of economic evaluations. The differences are mainly caused by some guidelines' instruction to use specific methods or to perform economic evaluations from a limited and only locally relevant perspective. Therefore, it is advisable that some recommendations in the pharmacoeconomic guidelines become more standardised and comparable. This can be achieved by developing international pharmacoeconomic guidelines. Such international guidelines could address the minimum requirements or minimum package that an economic evaluation 60
Lost productivity in national guidelines should fulfil, and of course national, additional requirements could guide adjustments to specific jurisdictions. One topic that certainly needs to be addressed is the inclusion of the value of lost productivity in economic evaluations. An unequivocal description of how to include the value of lost productivity will benefit the transferability of these data. However, it will be difficult to develop such a guideline, because of the different viewpoints on the requirements of a good economic evaluation. This hampers the possibility, for the time being, of reaching consensus on a European or international level. Nevertheless, several international organisations, like ISPOR and the European network for Health Technology Assessment (EUnetHTA), are paying attention to developing unequivocal methods and guidelines for economic evaluations. Furthermore, more attention should be paid to other suitable solutions for reducing the differences between pharmacoeconomic guidelines. One option is to identify the fundamental differences regarding the identification, measurement and valuation of lost productivity. However, it will be necessary for all guidelines that recommend the societal perspective to indicate clearly if and how lost productivity should be identified, measured and valued. This can be seen as the first step toward finding possible solutions for dealing with these differences. By identifying the fundamental differences it might be easier to come to consensus regarding some key points. Of course, more insight regarding the alternative methods available is warranted through research on the validity and reliability of measuring and valuing lost productivity. In addition, it would be easier to decide if data from other jurisdictions can be transferred if all the data are reported transparently. This would help to assess if data can be used elsewhere. Therefore, it would be advisable to have minimum requirements for the reporting of economic evaluations in journals. These requirements should indicate which parts of economic evaluations should be described in detail. At the same time, there should be some focus on developing general guidelines, and more research should be carried out regarding the fundamental differences in recommendations on including the value of lost productivity. Acknowledgements The authors would like to thank Andrea Peeters for help with the Slovakian guidelines, Isabel Ferreira for help with the Brazilian guidelines, Sang-Il Lee for help with the South-Korean guidelines, and Maryse Severens for help with the Cuban guidelines. Furthermore, we would like to thank ISPOR for their overview of pharmacoeconomic guidelines around the world.
61
Chapter 4
References 1. 2.
3. 4. 5.
6. 7. 8. 9.
10. 11. 12.
13.
14. 15.
16. 17. 18. 19. 20.
Koopmanschap M, Burdorf A, Jacob K, et al. Measuring productivity changes in economic evaluation. Setting the research agenda. Pharmacoeconomics. 2005; 23(1):47-54. Sculpher M. The role and estimation of productivity costs in economic evaluation. In: Drummond MF, MacGuire A, editors. Economic evaluation in health care Merging theory with practice. Oxford: Oxford University Press; 2005. Van Asselt ADI, Dirksen CD, Arntz A, Severens JL. Difficulties in calculating productivity costs: work disability associated with borderline personality disorder. Value Health. 2008; 11(4):637-44. Gold MR, Siegel JE, Russell LB, Weinstein MC. Cost-effectiveness in health and medicine. New York: Oxford University Press; 1996. Oostenbrink JB, Bouwmans CAM, Koopmanschap MA, Rutten FFH. Handleiding voor kostenonderzoek. Methoden en standaard kostprijzen voor economische evaluaties in de gezondheidszorg. Diemen: College voor zorgverzekeringen; 2004. Fox-Rushby J, Cairns J. Economic evaluation: Maidenhead, Berkshire England: Open University Press; 2005. Drummond M, Barbieri M, Cook JR, et al. Transferability of economic evaluations across jurisdictions: ISPOR good research practices task force report. Value Health. 2009; 12(4): 409-418. Hjelmgren J, Berggren F, Andersson F. Health economic guidelines- similarities, differences and some implications. Value Health. 2001; 4(3):225-50. Drummond MF, Pang F. Chapter 11 Transferability of economic evaluation results. In: Drummond MF, McGuire A, editors. Economic evaluation in health care Merging theory with practice. Oxford: Oxford University Press; 2005. Byford S, Raftery J.Economic notes: perspectives in economic evaluation. BMJ. 1998;316(7143):152930. Brouwer WBF, Koopmanschap MA, Rutten FFH. Productivity costs measurements through quality of life? A response to the recommendations of the Washington Panel. Health Econ. 1997; 6: 253-9. Jacob-Tacken KHM, Koopmanschap MA, Meerding WJ, Severens JL. Correcting for compensating mechanisms related to productivity costs in economic evaluations of health care programmes. Health Econ. 2005;14:435-43. Koopmanschap MA, Meerding WJ, Evers SMAA, et al. (PROductivity and DISease Questionnaire (PRODISQ); Een modulaire vragenlijst over de relatie tussen ziekte en productiviteitskosten, Toepasbaar bij economische evaluaties van gezondheidszorgprogramma’s voor patiënten en werknemers. Rotterdam/Maastricht: Instituut voor Medical Technology Assessment, Erasmus Universiteit Rotterdam/Instituut Maatschappelijke Gezondheidszorg, Erasmus Medisch Centrum/Beleid Economie en Organisatie van de Zorg, Universiteit Maastricht 2004. Van Roijen L, Essink-Bot M-L, Koopmanschap MA, et al. Labor and health status in economic evaluation of health care. Int J Technol Assess Health Care. 1996; 12(3):405-16. Patel N, Lofland JH, Pizzi LT. Chapter 4 Health-related productivity. In: Pizzi LT, Lofland JH, editors. Economic evaluation in US health care: principles and applications: Sudbury, Massachusetts; Jones & Bartlett publishers; 2006. Mattke S, Balakrishnan A, Bergamo G, Newberry SJ. A review of methods to measure health-related productivity losses. Am J Manag Care. 2007;13(4):211-7. Brouwer WBF, Van Exel NJA, Koopmanschap MA, Rutten FFH. Productivity costs before and after absence from work: as important as common. Health Policy. 2002; 61:173-87. Johannesson M, Karlsson G. The friction cost method: a comment. J Health Econ. 1997; 16:249-55. Koopmanschap MA, Rutten FFH, van Ineveld BM, van Roijen L. Reply to Johannesson's and Karlsson's comment. J Health Econ. 1997;16:257-9. Weinstein MC, Siegel JE, Garber AM, et al. Productivity costs, time costs and health-related quality of life: a response to the Erasmus group. Health Econ. 1997; 6:505-10.
62
Lost productivity in national guidelines 21. Boonen A, Severens JL. Worker participation in rheumatic disease: the socioeconomic perspective: Arthritis Research Campaign; 2009; 3: 1-10. 22. Escorpizo R, Bombardier C, Boonen A, et al. Worker productivity outcome measures in arthritis. J Rheumatol. 2007;34:1372-80. 23. Luce BR, Manning WG, Siegel JE, Lipscomb J. Estimating costs in cost-effectiveness analysis. In: Gold MR, Siegel JE, Russell LB, Weinstein MC, editors. Cost-effectiveness in health and medicine. New York: Oxford University Press; 1996. p. 176-213. 24. Liljas B. How to calculate indirect costs in economic evaluations. Pharmacoeconomics. 1998; 13(1):17. 25. Brouwer WBF, Koopmanschap MA. The friction-cost method. Replacement for nothing and leisure for free? Pharmacoeconomics. 2005; 23(2):105-11. 26. Goeree R, O'Brien BJ, Blackhouse G, et al. The valuation of productivity costs due to premature mortality: a comparison of the Human-Capital and Friction-Cost Methods for schizophrenia. Can J Psychiatry. 1999;44(5):455-63. 27. Hutubessy RCW, Van Tulder MW, Vondeling H, Bouter LM. Indirect costs of back pain in the Netherlands: a comparison of the human capital method with the friction cost method. Pain. 1999;80(1):201-7. 28 Brouwer W, Koopmanschap M. Hoofdstuk 4 Overige kosten binnen en buiten de gezondheidszorg. In: Rutten-Van Mölken MPMH, Van Busschbach JJ, Rutten FFH, editors. Van kosten tot effecten Een handleiding voor evaluatiestudies in de gezondheidszorg. Maarssen: Elsevier gezondheidszorg; 2000. 29. Tarn TYH, Dix Smith M. Pharmacoeconomic guidelines around the world. ISPOR Connections. 2004; 10(4):5-15. 30. Health Insurance Review Agency. Medical economic evaluation guideline for South-Korea. Seoul, South-Korea; Health Insurance Review Agency 2006. 31. Norwegian Medicine Agency. Norwegian guidelines for pharmacoeconomic analysis in connection with applications for reimbursement. Oslo: Department for Pharmacoeconomics, Ministry of Health and Social Affaires; 2005. 32. Alban A, Gyldmark M, Pedersen AV, Sogaard J. The Danish approach to standards for economic evaluation methodologies. Pharmacoeconomics. 1997; 12(6):627-36. 33. Academy of Managed Care Pharmacy (AMCP) and Foundation for Managed Care Pharmacy (FMCP). The AMCP format for formulary submissions. A format for submission of clinical and economic data in support of formulary consideration by health care systems in the United States. Alexandria, Virginia: AMCP and FMCP; 2005. 34. Boulenger S, Ulmann P. French guidelines for the economic evaluation of health care technologies. Paris: College des economistes de la sante 2004. 35. Capri S, Ceci A, Terranova L, et al. Guidelines for economic evaluations in Italy: recommendations from the Italian group of pharmacoeconomic studies. Drug information journal. 2001;35:189-201. 36. College voor Zorgverzerkeringen. Guidelines for pharmacoeconomic research, updated version. Diemen: College voor Zorgverzekeringen (CVZ); 2006. 37. Da Silva EA, Pinto CG, Sampaio C, et al. Guidelines for economic drug evaluation studies. Lisabon: INFARMED; 1998. 38. de Miello Vianna CM, Caetano R. Diretrizes Metodológicas para Estudos de Avaliação Econômica de Tecnologias para o Ministério da Saúde. Brasilia, Brazil; Ministério da Saúde; 2007. 39. Edling A, Stenberg AM. General guidelines for economic evaluations from the Pharmaceutical Benefits Board. Solna, Sweden: Pharmaceutical Benefits Board; 2003. 40. Galvez Gonzalez AM. Methodological guidelines for health economic evaluations. Havana, Cuba: Ministry of Public Health of Cuba; 2003. 41. Graf von der Schulenberg JM, Greiner W, Jost F, et al. German recommendations on health economic evaluation: Third and updated version of the Hanover Consensus. Value Health. 2008; 11(4):539-44. 42. Ministry of Health. Guidelines for economic evaluations of health care interventions. Bratislava, Slovakia: 2008.
63
Chapter 4 43. Ministry of Social Affairs and Health. Guidelines for preparing a health economic evaluation (unofficial translation) Helsinki, Finland: Ministry of Social Affairs and Health; 2003. 44. Orlewska E, Mierzejewski P. Polish guidelines for conducting pharmacoeconomic analysis. Warsaw: Polish Society for Medical Decision Making; 2000. 45. National Center for Pharmacoeconomics. Irish healthcare technology assessment guidelines. Dublin: National Centre for Pharmacoeconomics; 1999. 46. Riewpaiboon A. Measurment of costs. J Med Assoc Thai. 2008;91(Suppl 2):S28-37. 47. Rovira J, Antoñanzas F. Economic analysis of health technologies and programmes. A Spanish proposal for methodological standardisation. Pharmacoeconomics. 1995; 8(3):245-52. 48. Swiss Federal Office of Social Security. Manual for the Standardisation of Clinical and Economic evaluation of Medical Technology. Bern, Switzerland; Federal Office of Social Security; 1998. 49. Russian Federation Ministry of Health. The standardization system in the Russian federation health care system. Clinico-economic studies. Moscow: Ministry of Health of the Russian Federation; 2002. 50. Szende A, Mogyorosy Z, Muszbek N, et al. Methodological guidelines for conducting economic evaluation of healthcare interventions in Hungary: a Hungarian proposal for methodology standards. Eur J Health Econ. 2002; 3:196-206. 51. Walter E, Zehetmayr S. Guidelines on health economic evaluation. Consensus paper. Vienna: Institut fur Pharmaokonomische Forschung; 2006. 52. Behemane D, Lambot K, Irs A, et al. Baltic guideline for economic evaluation of pharmaceuticals. Pharmacoeconomic analysis; 2002. 53. Bertozzi SM, Mendoza AV, Garduno AH, Barajas ER. Guidelines for economic appraisal studies for updating the Health sector's National Formulary in Mexico: Mexico City: Consejo de Salubridad General, Instituto Nacional de Salud Publica; 2008. 54. Canadian Agency for Drugs and Technologies in Health (CADTH). Guidelines for the economic evaluation of health technologies: Canada. Ottawa: Canadian Agency for Drugs and Technologies in Health; 2006. 55. Cleemput I, Crott R, Vrijens F, et al. Pharmaco-economic guidelines. Brussels: Kenniscentrum voor de gezondheidszorg (KCE); 2008. 56. Grocott R, Schoeler R, Priest V, et al. Prescription for pharmacoeconomic analysis. Methods for costutility analysis. Wellington, New-Zealand; Pharmaceutical Management Agency (PHARMAC); 2007. 57. Longson C, Longworth L, Turner K. Guide to the methods of technology appraisal: National Institute for Health and Clinical Excellence (NICE). NICE, London; 2008. 58. Scottish Medicines Consortium. Scottish Medicines Consortium Economic Guidance. Edinburgh, Scottish Medicines Consortium, Health Technology Board for Scotland; 2002.
64
Lost productivity in national guidelines
Appendix SECTION A General Country: Year: Source or web link: Sponsored or authorized by: SECTION B Perspective Perspective: � mentioned, namely; o Societal o Government o Health care sector o Health care insurer o Health care provider o Employer o Employee o Others, namely ……..
� not mentioned, most likely…..
SECTION C Identification Lost productivity identified: � mentioned, namely; � not mentioned, most likely….. o Short term absenteeism (< 6 weeks) from paid work o Long term absenteeism (> 12 weeks) from paid work o Short term absenteeism (< 6 weeks) from unpaid work o Long term absenteeism (> 12 weeks) from unpaid work o Absenteeism due to mortality o Short term presenteeism (< 6 weeks) from paid work o Long term presenteeism (> 12 weeks) from paid work o Short term presenteeism (< 6 weeks) from unpaid work o Long term presenteeism (> 12 weeks) from unpaid work o Compensation, by…… o Other, ….. o Not relevant due to perspective o Unknown
65
Chapter 4 SECTION D Measurement Measurement of lost productivity: � mentioned, namely; � not mentioned, most likely…… o Questionnaire o Databases o Survey o Expenditure Diary Approach o Other, namely …. o Unknown SECTION E Valuation Methods of valuation of lost productivity and what kind of lost productivity: o Human Capital Approach, by …. o Friction Cost Method, by…. o US Panel Approach, by…. o Opportunity Costs, by … o Shadow Prices, by… o Other, namely….
66
Chapter 5
Lost productivity in four European countries among patients with rheumatic disorders: are absenteeism and presenteeism transferable?
S Knies, MJJM Candel, AE Boonen, SMAA Evers, AJHA Ament, JL Severens Submitted
67
Chapter 5
Abstract From previous research it has become clear that the recommendations regarding lost productivity differ among national pharmacoeconomic guidelines. These differences in guidance result in different ways of identifying, measuring and valuing lost productivity, with consequent difficulties when comparing lost productivity estimates. From a transferability point of view, the question arises whether differences in lost productivity are the result of using different calculation methods (methodological differences) or are due to cultural differences. The objective of this study is to investigate whether the country of residence has a significant influence on the quantity of lost productivity, correcting for confounding factors that might differ between countries, while keeping the methodology the same. This question is investigated by means of an online questionnaire that was filled out by respondents in four European countries. In addition to questions regarding lost productivity, the questionnaire contained questions about patient characteristics, disability insurance, disease characteristics, quality of life and labour characteristics as these factors could also influence lost productivity. The data were analysed by regression analyses, in which different components of lost productivity were the main outcome measure and correction took place for the other variables as between-country differences could be caused by differences on the other variables. The results showed that country sometimes has a significant influence on lost productivity and that other variables also influence lost productivity. Significant differences between countries were found on the variables ‘being absent in the last three months’ and ‘quality of work on the last working day’. However, countries did not differ in terms of the variables ‘number of days absent’, ‘quantity of work on the last working day’ and ‘overall presenteeism on the last working day’. In addition, other included variables also have a statistically significant influence on lost productivity. As a result, transferring lost productivity data between countries is not advisable, it is preferable to measure lost productivity in the country of interest.
68
Measuring lost productivity in four European countries
Introduction National pharmacoeconomic guidelines are used in a growing number of jurisdictions to support the decision making process in the health care sector. These guidelines are used to support the design and execution of economic evaluations [1]. However, carrying out economic evaluations is time consuming and costly. In addition, it requires the availability of trained researchers so that it may not be possible to perform all the evaluations in one’s own jurisdiction. As a result most technologies are evaluated in only a limited number of jurisdictions. Nevertheless, there is pressure for decision makers to transfer economic evaluations data across jurisdictions. This raises the question of whether the results of economic evaluations carried out in other jurisdictions can be transferred without causing problems [2-6]. Due to differences between for instance health care systems, epidemiology of diseases, clinical practice patterns and relative prices, the results of economic evaluations do not travel well across jurisdictions. The ISPOR Task Force on Transferability indicates that data are generalisable if they can be applied without adjustments to other settings. Data are transferable if they can be adapted to apply to other settings than the study country [7]. So far, the majority of research regarding the transferability of cost-effectiveness data has focused solely on the transferability of health care costs. Costs are considered as the outcome where quantities and prices are multiplied. Quantities are often considered transferable, but the prices of the elements not. Prices are frequently mentioned transferability factors, but on the other hand resource use or quantities is considered as a less important transferability factor as it is mentioned less frequently [8]. Until now no research has been carried out on the transferability of lost productivity. It is already clear that the prices of one day of lost productivity need to be adapted as salaries differ between individuals and countries, but it is not clear whether the quantities – number of days - are dependent on country when comparing people with the same disease. Nevertheless, the costs of lost production related to disease can be substantial, to such a degree that these costs can exceed the total costs of health care, for instance in rheumatoid arthritis [9]. It has already been discussed earlier that whether or not lost productivity should be included in economic evaluations is point of debate. As a result national pharmacoeconomic guidelines have different recommendations regarding the identification, measurement and valuation of lost productivity. These different recommendations can result in large differences in lost productivity estimations, which hinder the transferability [10]. Moreover, most transferability research is hampered by differences in methodological guidance between countries. These differences in guidance result in different ways of identifying, measuring and valuing lost productivity, with consequent difficulties when comparing cost and quantity estimates. The question arises whether differences in lost productivity are the result of using different calculation 69
Chapter 5 methods (methodological differences) or are due to other differences between countries [10]. Lost productivity usually develops when someone becomes ill and is therefore no longer able to work or is less productive. Lost productivity consists of two components, namely absenteeism (sickness absence or days off work) and presenteeism (reduced performance at work) [11]. In this article, only the absenteeism of people with a paid job are taken into account and as a consequence absenteeism related to full disability not. However, the development of lost productivity is also influenced by other factors, such as disease characteristics, quality of life and job characteristics. Each factor can affect the development of lost productivity differently, but the influence of the country in which someone is living when corrected for other factors like disease severity has not yet been explored. When lost productivity data differ significantly across countries, the transferability of the data is comprised across countries. The influence of the country can only be investigated by measuring lost productivity using the same method by a comparable patient population at the same time in different countries as disease and disease severity could have a larger influence on lost productivity than country. In addition, the influence of other factors that influence los productivity should be taken into account as ignoring their influence could lead to an overestimation of the influence of country. When after correction for the influence of other factors, still significant differences between countries can be found the conclusion can be drawn that the transferability of lost productivity data is seriously hindered. This study tries to explain which factors influence lost productivity and whether this differs between countries. Theoretical framework In addition to the possible influence of country, several other factors can be identified that influence the development of lost productivity. Figure 1 shows the factors described in the literature that influence the development and magnitude of lost productivity. Lost productivity (P), with absenteeism and presenteeism as its components, is a complex phenomenon that can be caused by physical and psychosocial complaints which in turn may be influenced by a range of factors [12]. In addition, lost productivity can be seen related to the severity of the disease (B) [13, 14]. The factors regarding disease characteristics are made specific for the fact that our study concentrates on rheumatic disorders. Therefore, in the case of rheumatic disorders it is described that especially the factors disease duration and pain are related disease severity and to lost productivity [15]. It is known that different levels of impairment (B) and different levels of quality of life (E) will lead to different levels of observed productivity (P) [16]. When the impairment (B) is limited, individuals may choose to stay at work, even though they are likely to be less productive (presenteeism), and 70
Measuring lost productivity in four European countries
Netherlands, United Kingdom, France, Germany
Country (F)
as the disease progresses, the impairment may increase and the individual may decide to stay at home (absenteeism). When the individual is recovering, there is a point at which the person decides to return to work, while being not fully productive yet [16]. Other research has indicated that, apart from disease and quality of life, absence is influenced by factors at a personal level (A), work related factors (C) and societal factors, like the insurance system (D) [11].
Patient characteristics (A) • age • gender • educational level
Disease characteristics (B) • restricted by rheumatic disorder • years of rheumatic disorder • impact of rheumatic disorder • pain due to rheumatic disorder
Labour characteristics (C) • shift work • temporary contract • number of hours and days contract •occupation • working field • job control • relationship with colleagues • compensation mechanism
Lost productivity (P) -Absenteeism -Absent yes/no -Number of days -Presenteeism -Quality of work -Quantity of work
Disability insurance (D) • requested disability insurance • partly disabled • percentage disabled
Quality of Life (E) • overall general health • utility EQ-5D
Figure 1 Factors that influence lost productivity
There is also an indication that the type of work influences lost productivity and that country (F) influences the duration of absence from work (P) [17]. The relation between work-related factors (C) and reduced performance at work (P) has also been the subject of study. It has been found that low job control, high time demands, high physical and output demands, and high psychosocial load are associated with reduced performance at work [11]. Costs of absenteeism (P) are calculated by mul71
Chapter 5 tiplying the number of absent days with the gross earnings, and this should reflect the costs of lost productivity when individuals are absent from work. The actual costs of lost productivity could be different, as the absence is compensated for (C) which is the case for both short-term and long-term absence. The work could be covered by others or the work is carried out by the individual when returning to work and these compensating mechanisms (C) influence the estimation of the costs of lost productivity (P). Therefore, taking compensating mechanisms into account will lead to lower estimations of the costs of lost productivity [18]. In addition, country (F) also influence the risk of being work disabled (C) [17]. The moment when people become less productive or absent probably depends on a combination of factors such as the type of work (C), type of illness (B), specific health domains affected (E), whether absence has consequences for the productivity of other workers and the financial consequences of being absent or less productive to the individual [14]. Some conflicting results can be found about the influence of gender (A). The research of Laaksonen et al. (2008) in several countries indicated that women have more absenteeism than men. Differences in the working conditions of men and women may provide some explanation for the gender differences, because some working conditions have been associated with lost productivity [13]. However, according to Gimeno et al. (2004) in most countries men have a higher average of absent days than do women [19]. Furthermore, the total societal costs of a disease, including the costs of lost productivity, are not only influenced by patient (A) and disease characteristics (B and E), but also by international differences in medical practice, differences in financing and organising of health care and differences in social security systems (D) [17]. It was also found that the percentage of people on sick leave in southern European is lower than the EU average. One explanation could be that in many countries (F) the income (C) on absence is limited resulting in a loss of income. Furthermore, it seems that in countries where people are fully paid in cases of temporary disability, a higher rate of absence can be observed [19]. At the moment, it is not clear to what extent and in what direction these different factors besides country have an influence on lost productivity, but this question will be explored in this study. Therefore, taking the other factors into account will result in a more accurate estimation of the influence of country. Only when other factors are taken into account the between-country differences within the sample for example the variables age or quality of life will be corrected for. The objective of this study was to investigate whether the country of residence has a significant influence on the quantity of lost productivity, correcting for all possible confounding factors that might differ between countries, while keeping the methodology the same. This leads to the following research question: To what extent is lost productivity that is absenteeism and presenteeism, influenced by differences in country corrected for quality of life, disease characteristics, patient characteristics, labour characteristics and insurance? 72
Measuring lost productivity in four European countries
Methods Population and procedures To investigate if lost productivity differs between countries, data about individual lost productivity were needed. The data were collected by the research organisation TNS NIPO, but the development of the questionnaire and the data-analyses were carried out by the authors. This organisation sent potential eligible respondents in a homogenous disease state an email with a link to an online questionnaire. People were eligible for this research if they had a rheumatic disorder – either self-reported or confirmed by a medical doctor - and were between twenty and sixty-five years of age. The choice was made to include only working age-respondents with the same disease to be sure that the populations in the countries were comparable. Previous research has indicated that musculoskeletal diseases, which have a high prevalence, have a high impact on worker participation and productivity. Therefore, a significant part of the societal costs of reduced productivity are caused by musculoskeletal problems [20]. It is also known that the costs due to lost productivity are an important part of the total costs of rheumatic disorders; e.g. in rheumatoid arthritis, the costs of lost productivity account for 25% to 71% of the total costs of the disease [9, 17]. The age limit was intended to increase the chance that the respondents were employed and neither still studying nor already retired. All potential respondents were members of the patient panels of TNS NIPO, and all these people were willing to fill out questionnaires for a small reward. TNS NIPO gave some points for any questionnaire the respondents filled out and the collected points can be converted into gift vouchers. The respondents could fill the questionnaire out at whatever time suited them the best, but there was a restriction of a total of two hundred respondents per country resulting in a total of eight hundred respondents. From each country a reasonable number of respondents with lost productivity were needed. Enough respondents should have a paid job as only then lost productivity can occur. Since twenty different variables were included in the analyses, a total of two hundred respondents per country were needed. The questionnaire was sent to respondents in four European countries namely France, Germany, the Netherlands and the United Kingdom (UK), being England and Wales. The Netherlands was chosen because it is the country in which the study was initiated. The other three countries were selected because the maximum prices of pharmaceuticals in the Netherlands are determined by taking the average of the prices in four so-called reference countries. These four reference countries are decreed in the law Pharmaceutical Prices in which four neighbouring countries are selected, namely Belgium, Germany, France and United Kingdom [21]. Consequently, these four countries are of interest for the Netherlands. Nevertheless, Belgium was not included in this study as, given the existing panels, it was not possible to include two hundred respondents from both 73
Chapter 5 language regions within Belgium, being Wallonia and Flanders. Respondents from both regions were needed as the legislation and other variables differ between the two regions. Measures The questionnaire was developed to measure the different constructs as displayed in Figure 1. Whenever available, existing validated questionnaires or specific parts of such questionnaires were utilized. Health-related quality of life was measured using the EQ-5D, which is a generic instrument used in economic evaluations to calculate the utility for the health state described with the instrument. The answers on the EQ-5D were utilized to calculate utilities using the British, Dutch, French and German value sets [22, 23]. Patient characteristics, job characteristics and lost productivity were measured using the Productivity and Disease Questionnaire (PRODISQ), which is a modular questionnaire that has been developed for measuring lost productivity for people with paid labour. Presenteeism, as one of the components of lost productivity, was operationalized by making a distinction between the quality and quantity of work on the last working day of the respondent. Respondents could indicate how well and how much work was carried out on their last working day on a ten point scale. Presenteeism occurred whenever the respondent scored lower than ten on the scale. These two presenteeism scales were also combined to create an overall presenteeism score [24, 25]. One of the components of the job characteristics as given in Figure 1 is job control, which consists of job demand and decision latitude. Job demand is related to an aggregate of psychological stressors affecting work, which are often task pressures. Decision latitude can be described as the individual’s potential job-related decision making. The questions on job control were converted into two scales, namely job demand and decision latitude [26]. The questions about the severity of the rheumatic disorder were selected from the Dutch-Arthritis Impact Measurement Scales-2 (Dutch-AIMS2), which is an instrument for assessing the health status of patients with rheumatic disorders. The respondents have to indicate the disease severity and impact and pain of the disease in the last twelve months. One of the questions from this questionnaire allowed for calculating the number of years a respondent had had a rheumatic disorder [27]. The overall general health questions were the first questions from the European Health Status Module; part of the European Health Interview Survey [28]. Overall general health was measured using two questions, namely general health and experienced health. General health could be scored ranging from very good to very poor and the experienced health was scored on a scale ranging from 0 to 100. Countries can differ in two ways, namely in system characteristics and cultural differences. Differences in system characteristics cause differences in the procedures and financial consequences concerning temporary absenteeism and the regulations on 74
Measuring lost productivity in four European countries disability and disability insurance between countries [19]. Because there is no international questionnaire about disability insurance for individuals, these questions were formulated in consultation with experts in the field, after identifying the information needed. Cultural differences could result in different attitudes towards labour and sickness, which can cause differences of opinion on absenteeism and disability. Something else that has to be kept in mind is that the included variables are also correlated with each other, not only the variables which are related to the same box of characteristics, but also variables that belong to other characteristics, for example, severity of disease and health-related quality of life. Original versions of the questionnaires were utilized when they existed in the relevant language, for instance the EQ-5D, and translated from Dutch by professional translators when necessary, for instance for PRODISQ. Statistical analyses To begin with, dummy variables were created for categorical variables with more than two categories. Furthermore, the whole dataset was checked for missing data. Simple imputation methods were used for missing data on the variables ‘educational level’ and on the ‘percentage of disability’. The missing data were imputed by utilizing the answers on related variables, for example whether or not the respondents were partly disabled. After the simple imputation, multiple imputations with five imputations were performed for the variables ‘hours per week of paid labour’ and ‘number of days of paid work’. The results pooled across the five imputed datasets are reported. To investigate whether variables were significantly different between the four countries, one-way ANOVA tests were done for continuous variables 2 and χ -tests were done for categorical variables. Only respondents having a paid job were included in the analyses. Logistic regression analysis was performed to examine the influence of country on being absent or not in the last three months and on presenteeism during the last working day. Linear regression analysis was carried out to investigate the influence of country on the number of absent days in the last three months. In each of these analyses, other variables that could also influence lost productivity according to the theoretical framework were included as additional predictor variables. Multicollinearity was checked by calculating the variance inflation factor (VIF) for each predictor variable. When VIF was above 10, different strategies were used to lower the multicollinearity. Categorical variables with two levels were recoded in 1 versus -1, and categorical variables with more than two levels were recoded using an orthogonal coding scheme [29]. Continuous variables were centred (the total average was deducted from the score of each individual respondent). These strategies were sufficient to decrease the VIF value below the critical value. At first all relevant predictor variables were included in the analysis model. Except for the dummy variables representing the four countries, non75
Chapter 5 significant predictor variables were deleted from the model step by step, each time removing the least significant one, but with a p-value > 0.10. The p-values for the results pooled across multiple imputations were employed. Dummy variables were deleted if, for continuous outcomes, the F-Change, or for binary outcomes, the likelihood ratio of the model with versus the model without dummy variables was not significant. For the reduced model containing only significant predictors, the effects of country were examined for significance. All statistical analyses were performed using SPSS 17.
Results Characteristics of the respondents In Table 1 the characteristics of the whole sample and of the respondents with a paid job in the four included countries are reported. The average age of the respondents in the four countries is between forty-eight and fifty-two and, for respondents with a paid job, between forty-five and fifty years. UK respondents are significantly older than respondents in France and Germany. In addition, the average duration of a rheumatic disorder is between ten and fourteen years, and this average in the Netherlands is significantly higher than in the UK. In the Netherlands and UK the percentage of respondents who consider their own health to be very good or good is higher than in France and Germany. However, the utility scores are significantly lower in the UK than in Germany and France, which conflicts with the UK respondents’ own perception of their health. The higher utility scores in Germany are not in line with the results, which show that the German respondents are significantly more restricted due to their rheumatic disorder than are respondents in the Netherlands and in the UK. The statistically different valuations on the variables between countries by the respondents of their own health, restricted by disease, utility and experienced health do not result in a significant difference between the countries on the variable impact of the rheumatic disorder. Significant differences can be identified in the percentage of respondents who still have paid work. In the Netherlands about seventy-five percent of the respondents work, but the average number of contract hours is the lowest among the four countries. Furthermore, the characteristics of the respondents with a paid job indicate that these are on average younger, and have a better health; they are less restricted by the rheumatic disorder and its duration is shorter.
76
77
Characteristics of all respondents Netherlands UK Number of respondents 230 200 Male (%) 79 (34.3%) 82 (41%) Average age (std) 48 (9.54)2* 52 (10.26)1*,3*, 4* 3*, 4* Own health % very good-good 51.7% 45%3*, 4* Restricted by illness - % seri- 12.2%4* 17.5%4* ously restricted Mean years of rheumatic dis- 13.48 (9.55) 11.42 (9.65) order (std) Mean utility (country specific 0.69 0.55 value set) Mean utility EQ-5D (UK value 0.632* 0.551* set) Mean experienced health 65.09 (21.58)4* 66.58 (22.45)4* scale 0-100 (std) Mean impact of rheumatic 45.74 (20.00) 44.96 (29.57) disorder scale 0-100 (std) Partly disabled (%) 60 (26.1%) 41 (20.5%) Number of people that are 26 (11.3%) 9 (4.5) 100% disabled (%) Last three months on sick leave (%) Mean number of days on sick leave (std) Currently on sick leave (%) Mean contract hours (std) Note 1 p < .05 with Netherlands; 1* p < .01 with Netherlands 2 p < .05 with United Kingdom; 2* p < .01 with United Kingdom 3 p < .05 with France; 3* p < .01 with France 4 p < .05 with Germany; 4* p < .01 with Germany
Table 1 Characteristics of the respondents
-
-
21.90 (26.74)
21 (18.1%)
47 (38.8%)
9 (7.4%) 4 (3.31%)
26.52 (29.78) 19.81 (25.63)
42 (32.6%)
12 (9.3%) 1 (.78%)
33 (14.3%) 20 (10%) 31 (15.5%) 48 (24%) 28.74 (10.08)2*, 3*,4* 33.18 (10.67)1* 33.85 (7.73)1* 33.21 (10.34)1*
11.40 (17.17)
57 (32.9%)
-
-
5 (4.3%) 0
28 (16.2%) 4 (2.3%)
32 (16%) 15 (7.5%)
35 (17.5%) 2 (1%)
42.98 (27.34) 42.40 (25.59)
41.94 (30.86)
43.46 (29.91)
0.64
43.30 (26.51) 46.03 (24.73)
0.64
73.84 (19.82)4* 67.75 (19.42) 61.55 (19.19)1,2*
0. 66
65.51 (20.3)4* 57.14(20.37)1*, 2*, 3* 67.88(21.13)4
0.66
0.60
0.772*, 3*
0.61
0.674*
0.72
0.74
0.63
0. 664*
10.98 (7.72)
12.17 (9.88)
12.86 (9.45)2
13.68 (11.87) 11.71 (8.63)
9.77 (8.36)1
Germany 121 (60.5%)1* 47 (38.8%) 46 (9.51)2* 31.4%1*,2* 20.7%1,2*
Germany 200 72 (36%) 47 (9.64) 2* 25.0%1*,2* 29.0%1*, 2*, 3*
Characteristics of respondents with a paid job Netherlands UK France 173 (75.2%)2*, 4* 116 (58%)1* 129 (64.5%) 71 (41.0%) 47 (40.5%) 41 (31.8%) 47 (9.40) 50 (10.36)3*,4* 45 (8.93)2* 57.2%3*,4* 59.5%3*,4* 31.0%1*,2* 9.2%4 6.0%4* 16.3%
France 200 62 (31%) 48 (10.20)2* 29.0%1*, 2* 17.0%4*
Chapter 5 Absenteeism in the last three months The four countries differ in terms of being absent or not from work in the last three months. As can be seen in Table 2, respondents living in the UK have been absent significantly less often than respondents in the Netherlands, but the numbers of people being absent in France and Germany were also lower than in the Netherlands, although not significantly. Furthermore, the results show that persons who are seriously restricted or somewhat restricted are more often absent than persons who are not restricted. The B-value of 1.85 and the Odds Ratio of 6.25 indicate that as the variable increases, the odds of being absent in the last three months increase. The number of contract hours is also related to being absent. Respondents with a higher number of contract hours have a higher rate of being absent. However, older respondents and respondents with a fixed contract are absent less often. 2 This model has a R of 0.17, meaning that 17% of ‘being absent’ is explained by the model. Table 2 Results of logistic regression on being absent in the last three months B Country UK versus the Netherlands France versus the Netherlands Germany versus the Netherlands Patient characteristics Age (years) Disease characteristics Seriously restricted versus not restricted Somewhat restricted versus not restricted Labour characteristics Temporary contract (1: yes, 2: no) Number of contract hours (hours) Quality of life General Health (1: very good- 5 very poor) Note R2 = 0.17 (Nagelkerke) Model χ2 = 69.28. * p > .05. ** p > .001
Std. error
Odds Ratio
-.85 -.50 -.18
.31 .29 .27
.43* .61 .84
-.03
.01
.97*
1.85 .82
.40 .30
6.25** 2.27*
-.76 .03
.37 .01
.47* 1.03*
.26
.15
1.30
Number of days absent in the last three months The F-Change of the model with versus the model without country is not significant (F-Change = 0.742), indicating that the model without country, Model 2, is more appropriate. Hence country has no significant influence on the number of days of being absent in the last three months. From the B-value in the first regression model it can be seen that the variables seriously restricted and whether work will be compensated by others lead to respectively 24 and 10 days more absent. The ad2 justed R is 0.282 for Model 2, without dummy variables for country, implying that 28.2% of the ‘number of days absent’ is explained by this model (see Table 3).
78
Measuring lost productivity in four European countries
Table 3 Results of linear regression analysis on number of days absent B Model 1 Country 0.21 UK versus the Netherlands 5.40 France versus the Netherlands 5.66 Germany versus the Netherlands Patient characteristics Gender (1: male, 2: female) -7.88 Disease characteristics Years of rheumatic disorder -0.46 24.61 Seriously restricted versus not restricted 8.13 Somewhat restricted versus not restricted Labour characteristics Shift work (1: yes, 2: no) -8.07 Decision latitude (1: never- 4: always) -2.64 10.58 Compensation by others (0: no, 1: yes) Disability insurance 8.23 Requested disability insurance (1: yes, 2: no) Quality of life 4.31 General health (1: very good- 5: very poor) Note R2 = .331; adj. R2 = .279 for Model 1; * p > .05; ** p > .001
Std. Error
Beta
5.81 4.98 4.39
.00 .09 .10
3.45
-.15*
0.19 6.82 5.69
-.17* .43** .16
4.04 1.58 4.08
-15* -.12 0.19*
4.32
0.14
2.49
0.14
Model 2 Patient characteristics Gender (1: male, 2: female) Disease severity Years of rheumatic disorder (continue) Seriously restricted versus not restricted Somewhat restricted versus not restricted Labour characteristics Shift work (1: yes, 2: no) Decision latitude (1: never- 4: always) Compensation by others (0: no, 1: yes) Disability insurance Requested disability insurance (1: yes, 2: no) Quality of life General health (1: very good- 5: very poor) Note R2 = .321; adj. R2 = .282 for Model 2; * p > .05; ** p > .001
B
Std. Error
Beta
-7.83
3.42
-.15*
-.47 24.05 7.05
.18 6.71 5.57
-.17* .42** .14
-8.53 -2.26 9.62
3.64 1.51 4.02
-.16* -.10* .17*
8.85
4.25
.15*
5.62
2.28
.18*
The variables gender, years of rheumatic disorder, the degree to which the respondent is restricted by the disease, shift work, decision latitude in the work of the respondent, compensation by others, disability insurance requested or not and, general health explain the number of working days lost due absenteeism. On average, men, respondents who never requested disability insurance and who work in shift have a higher number of days absent than do women and respondents who requested disability insurance with regular working hours. The variable ‘years of rheumatic disorder’ has a negative correlation with the dependent variable, meaning that a respondent who has suffered from a rheumatic disorder for many years
79
Chapter 5 has a lower number of absent days than does a respondent who has had a rheumatic disorder for fewer years. Furthermore, high decision latitude, meaning one has considerable freedom to make one’s own decisions in their work, is associated with a smaller number of days being absent. The degree of restriction due to the rheumatic disorder is positively correlated with the dependent variable. Respondents who are seriously restricted are on average a larger number of days absent than are respondents who are not restricted because of their rheumatic disorder. Having poor general health or respondents whose work was taken over by others when absent, being compensated by others, had a higher number of absent days. Presenteeism Overall presenteeism is significantly influenced by a number of variables. The model 2 has a R of 0.16, thus 16% of the overall presenteeism is explained by the model. Poor general health significantly increases the possibility of presenteeism at work. In addition, a larger number of contract hours and a high job demand are also positively related to presenteeism. However, having a rheumatic disorder for a higher number of years have a negative relation with regard to presenteeism, meaning a decreased possibility of presenteeism at work. When a respondent has high decision latitude at work this also decreases the possibility of presenteeism. Regarding overall presenteeism the variable country has no statistical significant influence. In addition, having a temporary contract, a larger number of contract hours and a high job demand are also positively related to presenteeism. Being partly disabled and having a rheumatic disorder for a higher number of years have a negative relation with regard to presenteeism, meaning a decreased possibility of presenteeism at work. When a respondent has high decision latitude at work this also decreases the possibility of presenteeism. Regarding overall presenteeism the variable country has no statistical significant influence. The statistical model explains 17% of the quality-related presenteeism. The possibility of quality-related presenteeism is significantly higher in France and Germany in comparison with the Netherlands. In Germany in particular, there is a higher chance that the quality of the work is lower than normal in comparison with the Netherlands. Furthermore, the number of contract hours increases the possibility of presenteeism. However, some other variables are negatively related to the occurrence of presenteeism. A better experienced health, a high utility score and high decision latitude decrease the possibility that the quality of work on the last working day was lower than on a normal working day.
80
Measuring lost productivity in four European countries Table 4 Results of logistic regression analyses on presenteeism Presenteeism Disease characteristics Years of rheumatic disorder Labour characteristics Temporary contract (1: yes, 2: no) Decision latitude (1: never- 4: always) Job demand (1: never- 4: always) Number of contract hours (hours) Disability Insurance Partly disabled (1: yes, 2: no) Quality of life Experienced health (0: worst possible – 100: best possible) General health (1: very good- 5: very poor) Note R2 = .16 (Nagelkerke) Model χ2 = 69.71 * p > .05, ** p > .001 Quality presenteeism Country UK versus the Netherlands France versus the Netherlands Germany versus the Netherlands Patient characteristics Age (years) Labour characteristics Relation with colleagues (0: very bad – 10 very good) Decision latitude (1: never- 4: always) Number of contract hours (hours) Disability Insurance Partly disabled (1: yes, 2: no) Quality of life Experienced health(0: worst possible – 100: best possible) Utility EQ-5D (0: worst-1: best possible health) Note R2 = .17 (Nagelkerke) Model χ2 = 70.90 * p .> .05, ** p > .001 Quantity presenteeism Disease characteristics Impact disorder (0: worst possible – 100: best possible) Years of rheumatic disorder Labour characteristics Temporary contract (1: yes, 2: no) Number of contract hours (hours) Disability insurance Partly disabled (1: yes, 2: no) Quality of life General health (0: worst possible – 100: best possible) Note R2 = .15 (Nagelkerke) Model χ2 = 60.85 * p .> .05, ** p > .001
B
Std. Error
Odds Ratio
-.03
.01
.97*
.57 -.27 .31 .03
.30 .09 .17 .01
1.77 .76* 1.36* 1.03*
-.88
.35
.41*
-.01 .58
.01 .15
.99 1.79**
B
St. Error
Odds Ratio
.22 .65 1.04
.28 .26 .27
1.24 1.91* 2.84**
-.02
.01
.98
-.08 -.19 .03
.05 .09 .01
.92 .83* 1.03*
-.57
.33
.57
-.02 -1.02
.01 .49
.98* .36*
B
St. Error
Odds Ratio
.01 -.03
.00 .01
1.01* 1.03*
.82 .03
.31 .01
2.27* 1.03*
-1.21
.33
.30**
.59
.13
1.80**
Being partly disabled leads to a reduction in the quantity of work on the last working day. The country someone is living in does not have a significant influence on 81
Chapter 5 the quantitative dimension of presenteeism. When the rheumatic disorder has a high impact on the respondent’s life, and when having the disorder for a longer period, then presenteeism is less likely in the sense that less work is done. Furthermore, having poor general health, a fixed contract, and a high number of contract hours result in a lower quantity of work, thus less work was carried out on the last 2 working day than on average. The R of the model is 0.15, meaning that 15% of the quantitative dimension of presenteeism is explained by the statistical model.
Discussion The results show that country has a statistically significant influence on the dependent lost productivity variables. In these respondents with rheumatic disorders, not only disease characteristics and quality of life, but also the country of residence influence lost productivity. Significant differences can be found between the Netherlands, the UK, France and Germany on the variables ‘being absent in the last three months’ and ‘quality of work on the last working day’. Between-country differences could not be found in terms of the variables ‘number of days absent’, ‘overall presenteeism’ and ‘quantity of work on the last working day’. Therefore, it can be concluded that country has a significant influence on lost productivity, even when corrected for the other variables that influence lost productivity. Therefore, we conclude that due to the significant differences between countries it is not advisable to transfer lost productivity data between countries without adaptation, because the transferability of the data is hindered by significant differences between countries. It was already clear that wages are different across countries, but our results indicate that the quantity part of lost productivity also differ across countries, even after correcting for other between-country differences. However, the results did not clarify if the between-country differences are the consequence of differences in system characteristics or of cultural differences. In addition to country some other variables included in the theoretical framework had a statistically significant influence on lost productivity. Although these variables all belong to characteristics presented in this framework, which variables are significant differs slightly among the dependent variables. However, several variables are statistically significant in more than one analysis. The variables ‘severity of the disease’ and ‘shift work’ are statistically significant related to absenteeism, but not for presenteeism. In addition, the variables experienced health, utilities, partly disabled, and relation with colleagues are significant for presenteeism, but not for absenteeism. However, a number of variables are included in the statistical models for both absenteeism and presenteeism related outcome measures. Age, years of rheumatic disorder, decision latitude, temporary contract and number of contract hours are all statistically significant in both absenteeism and presenteeism related 82
Measuring lost productivity in four European countries models. The overall results indicate that a variety of variables have a statistically significant influence on lost productivity. Furthermore, only a part of the lost productivity could be explained by the models. The statistical models explained the lost productivity from 15% up to 28%. This indicates that other factors which were not included in the theoretical model and the analyses also influence lost productivity. It could be that compensation mechanisms have an influence on presenteeism. This was not taken into account in this study as the compensation mechanisms were only included for absenteeism. In addition, coping strategies of the respondents with their disease could probably also influence the development and magnitude of lost productivity. Respondents with more adequate coping strategies could have less lost productivity. However, it is unclear which other factors have a significant influence on either the development or magnitude of lost productivity. The theoretical framework indicates, according to the literature which variables have influence on lost productivity. In particular, the influence of country on lost productivity was not clear and this influence was investigated in this study. The variables included in the theoretical framework as described in the introduction can be seen as a starting point, because all elements have a statistical influence on lost productivity. In addition, in international studies, country should be included in the theoretical framework, because country has been found to have a statistically significant influence on some components of lost productivity. Limitations of the study The study presented in this article has several limitations, mostly related to the study sample. In order to create a sample with a homogeneous disease state, the sample included only respondents with a rheumatic disorder. Including patients from a more general population with different disease states might have introduced bias. However, it is not clear if the diagnosis of the rheumatic disorder was confirmed by a medical doctor for all respondents. It is possible that respondents with only a self-reported rheumatic disorder were included in the sample. The choice for rheumatic disorders could also have influenced the results in other ways, because it is possible that the diagnoses and acceptance of rheumatic disorders differ across countries. The results presented are therefore applicable only to this population and our findings need to be confirmed in other disease areas. Moreover, respondents living in four European countries were included. In the United Kingdom, France and Germany a total of two hundred respondents per country and in the Netherlands two hundred thirty respondents were included in the sample, resulting in a total of eight hundred thirty respondents. In the analyses only respondents with a paid job were included, resulting in a total of five hundred thirtynine eligible respondents. This number of respondents was large enough to perform all statistical analyses and to identify statistically significant differences. The number 83
Chapter 5 of countries however, was limited to four Western European countries, but these countries are considered to be the reference countries for the pharmaceutical prices for the Netherlands. However, it is not clear if the results found in this study can be generalised to other Western European countries. The social security system is well developed in these four countries, which is not always the case in other countries. As a consequence, our results are probably also not useful for other European countries or countries in other continents due to differences in labour markets and due to differences between social security systems. Furthermore, including more countries will explain whether between countries differences in lost productivity can be found which will strengthen the evidence. In addition, the study questionnaire was developed using existing validated questionnaires or specific parts of such questionnaires. Unfortunately, no international questionnaires about disability insurance for individual respondents were available. As a consequence, the questions concerning disability insurance had to be specially formulated for this research and these remain not validated. But more important, other influential factors that so far remain unknown are not part of the theoretical model. The variables included in the framework were relevant and sometimes sta2 tistically significant, but the R of the models was at the most 0.28, meaning that a substantial proportion of the variability in our data cannot be explained. Subsequently, except from the possible influence of compensation mechanisms by presenteeism and coping strategies, other factors that influence lost productivity have, to our knowledge, not been identified. Implications of results The results show that country has a relevant and statistically significant influence on lost productivity. This means that between-country differences can be found regarding lost productivity. Therefore, lost productivity data are not comparable across countries; this hinders the transferability of lost productivity data. Therefore, data regarding lost productivity and productivity costs cannot be transferred between jurisdictions without problems. It is not yet clear how the lost productivity data can be adapted in a valid manner. However, only respondents with a rheumatic disorder from only four European countries were included. It is advisable to carry out more research to investigate whether lost productivity – especially quantity - differs between other countries and among other patient groups.
84
Measuring lost productivity in four European countries
References 1.
Tarn, T. Y. H., & Dix Smith, M., Pharmacoeconomic guidelines around the world. ISPOR Connections, 2004; 10(4): 5-15. 2. Drummond, M. F., Bloom, B. S., Carrin, G., Hillman, A. L., Hutchings, H. C., Knill-Jones, R. P., et al., Issues in the cross-national assessment of health technology. International Journal of Technology Assessment in Health Care, 1992; 8(4): 671-682. 3. Greiner, W., Schöffski, O., & Graf von der Schulenberg, J. M., The transferability of international economic health-economic results to national study questions. Health Economics in Prevention and Care, 2000; 1, 94-102. 4. Mulligan, J.-A., & Fox-Rushby, J., (2005). Chapter 18 Transferring cost-effectiveness data across space and time. In J. Fox-Rushby & J. Cairns (Eds.), Economic evaluation: Open University Press. 5. Späth, H. M., Carrère, M. O., Fervers, B., & Philip, T., Analysis of the eligibility of published economic evaluations for transfer to a given health care system. Methodological approach and application to the French health care system. Health Policy, 1999; 49(3): 161-177. 6. Welte, R., Feenstra, F., Jager, H., Leidl, R., A Decision Chart for Assessing and Improving the Transferability of Economic Evaluation Results Between Countries. Pharmacoeconomics, 2004; 22(13): 857876. 7. Drummond, M., Barbieri, M., Cook, J. R., Glick, H., Lis, J., Malik, F., et al., Transferability of economic evaluations across jurisdictions: ISPOR good research practices task force report. Value in Health, 2009; 12(4): 409-418. 8. Goeree, R., Burke, N., O'Reilly, D., Manca, A., Blackhouse, G., Tarride, J-E., Transferability of economic evaluations: approaches and factors to consider when using results from one geographic area for another. Current Medical Research and Opinion, 2007; 23(4): 671-82. 9. Franke, L. C., Ament, A. J. H. A., Van de Laar, M. A.F.J., Boonen, A., Severens, J.L., Cost-of-illness of rheumatoid arthritis and ankylosing spondylitis. Clinical and experimental rheumatology, 2009; 27 (Suppl. 55): S118-S123. 10. Knies, S., Severens, J. L., Ament, A. J. H. A., Evers, S. M. A. A., The transferability of valuing lost productivity across jurisdictions. Differences between national pharmacoeconomic guidelines. Value in Health, 2010; 13(5): 519-527. 11. Van den Heuvel, S. G., Geuskens, G. A., Hooftman, W. E., Koppes, L. L. J., Van den Bossche, S. N. J., Productivity Loss at Work; Health-Related and Work-Related Factors. Journal of occupational rehabilitation, 2009; 12. Duijts, S. F. A., Kant, Y., Swaen, G. M. H., Van den Brandt, P. A., Zeegers, M. P. A., A meta-analysis of observational studies identifies predictors of sickness absence. Journal of clinical epidemiology, 2007; 60, 1105-1115. 13. Laaksonen, M., Martikainen, P., Rahkonen, O., Lahelma, E., Explanations for gender differences in sickness absence: evidence from middle-aged municipal employees from Finland. Occupational and Environmental Medicine, 2008; 65, 325-330. 14. Lamers, L. M., Meerding, W. J., Severens, J. L., Brouwer, W. B. F., The relationship between productivity and health-related quality of life: an empirical exploration in persons with low back pain. Quality of life research, 2005; 14, 805-813. 15. Kobelt, G., Woronoff, A.-S., Richard, B., Peeters, P., Sany, J., Disease status, costs and quality of life of patients with rheumatoid arthritis in France: the ECO-PR Study. Joint Bone Spine, 2008; 75, 408-415. 16. Brouwer, W. B. F., Meerding, W. J., Lamers, L. M., Severens, J. L., The relationship between productivity and health-related QOL. Pharmacoeconomics, 2005; 23(3): 209-218. 17. Boonen, A., Van der Heijde, D., Landewe, R., Spoorenberg, A., Schouten, H., Rutten-Van Mölken, M., et al., Work status and productivity costs due to ankylosing spondylitis: comparison of three European countries. Annals of rheumatic disorders, 2002; 61, 429-437.
85
Chapter 5 18. Severens, J. L., Laheij, R. J. F., Jansen, J. B. M., Van der Lisdonk, E. H., Verbeek, A. L. M., Estimating the cost of lost productivity in dyspepsia. Alimentary Pharmacology and Therapeutics, 1998; 12: 919923. 19. Gimeno, D., Benavides, F. G., Benach, J., Amick III, B. C., Distribution of sickness absence in the European Union countries. Occupational and Environmental Medicine, 2004; 31, 867-869. 20. Boonen, A., Severens, J. L. (2009). Worker participation in rheumatic disease: the socioeconomic perspective. In A. Keat (Ed.), Reports on the rheumatic diseases series 6: Arthritis Research Campaign. 21. De Wolf, P., Brouwer, W. B. F., Rutten, F. F. H., Regulating the Dutch pharmaceutical market: improving efficiency or controlling costs? International Journal of Health Planning and Management, 2005; 20, 351-374. 22. Chevalier, J., De Pouvourville, G., Valuing EQ-5D using Time Trade-Off in France. Value in Health, 2009; 12(7): A224. 23. Szende, A., Oppe, M., Devlin, N. (2007). EQ-5D value sets: Inventory, Comparative Review and User Guide. Dordrecht: Springer 24. Koopmanschap, M. A., PRODISQ: a modular questionnaire on productivity and disease for economic evaluation studies. Expert review of pharmacoeconomics and outcome research, 2005; 5(1): 23-28. 25. Koopmanschap, M. A., Meerding, W. J., Evers, S., Severens, J., Burdorf, A., & Brouwer, W. (2004). (PROductivity and DISease Questionnaire (PRODISQ); Een modulaire vragenlijst over de relatie tussen ziekte en productiviteitskosten, Toepasbaar bij economische evaluaties van gezondheidszorgprogramma’s voor patiënten en werknemers. Rotterdam/Maastricht: Instituut voor Medical Technology Assessment, Erasmus Universiteit Rotterdam/Instituut Maatschappelijke Gezondheidszorg, Erasmus Medisch Centrum/Beleid Economie en Organisatie van de Zorg, Universiteit Maastricht 26. Karasek, R., Baker, D., Marxer, F., Ahlbom, A., Theorell, T., Job decision latitude, job demands and cardiovascular disease: a prospective study of Swedish men. American journal of public health, 1981; 71, 694-705. 27. Riemsma, R. P., Taal, E., Rasker, J. J., Houtman, P. M., Van Paassen, H. C., & Wiegman, O. Evaluation of a Dutch version of the AIMS2 for patients with rheumatoid arthritis. British Journal of Rheumatology, 1996; 35, 755-760. 28. Eurostat. (2006). European Health Interview Survey (EHIS) Questionnaire. In E. U. F/5 (Ed.): European Commission Eurostat. 29. Kirk, R. E. (1982). Experimental design: procedures for the behavioral sciences. Belmont (CA): Wadsworth.
86
Chapter 6
Utilities of the EQ-5D: transferable or not?
S Knies, SMAA Evers, MJJM Candel, JL Severens, AJHA Ament Pharmacoeconomics 2009; 27(9): 767-779
87
Chapter 6
Abstract Background: Within the framework of economic evaluations, the transferability of utility scores between jurisdictions remains unclear. The EQ-5D is a generic instrument for measuring health-related quality of life in economic evaluations; which can be used for comparing utility scores across countries. At present, the EQ-5D has several national value sets or tariffs. Nevertheless, utility estimates from foreign studies are often used directly for cost effectiveness estimates, without adapting by applying the appropriate national value set. It is unclear if this practice is advisable, due to dissimilarities between the national value sets. Objective: To examine the effects of differences in national EQ-5D value sets on absolute and marginal utilities of health states, and determine to what degree these differences can be explained by methodological factors. Methods: First, the relative importance of the EQ-5D domains for the utility estimates was compared across the 15 value sets. Second, two hypothetical health states for a hypothetical depressed patient and a hypothetical pain patient (21232 and 33321) were selected for additional analysis, by comparing the utilities as scored by the value sets. The marginal influence of a one level deterioration in a domain of these health states on the utility estimate was then determined. Third, the differences between the value sets were examined in more detail by using multilevel analysis to examine the role of methodological differences in the valuation studies. Results: Differences can be perceived between the national value sets of the EQ-5D in the preferences for the domains. The utilities of the two hypothetical health states show that the value sets differ substantially. Furthermore, the differences between the marginal values of the deteriorations are large, which can be explained partly by the type of valuation method. Other methodological differences also influence the value sets. Conclusion: All results indicate that the differences between the EQ-5D value sets are considerable and should not be ignored. The differences can largely be explained by methodological differences in the valuation studies. The remaining differences may reflect cultural dissimilarities between countries. Therefore, further research should focus on investigating the transferability of utilities across countries or to agree on a standard to perform valuation studies. For the time being, transferring utilities from one country to another without any adjustment is not advisable.
88
Transferability of EQ-5D utilities
Introduction Healthcare providers and payers are increasingly interested in using the results of economic evaluations to guide their decision making [1]. Due to the rapid international spread of new health technologies, there is a need to undertake, or at least interpret, economic evaluations on the international level [2]. Nevertheless, findings of economic evaluations may not be easily transferable due to differences in healthcare and economic systems, although data are transferable if they can be adapted to apply to other settings or jurisdictions [3 ,4]. In the International Society for Pharmacoeconomics and Outcomes Research (ISPOR) task force report on transferability, [4] different national guidelines were reviewed with regard to their statements about transferability. All guidelines recognized that several factors influence the transferability of economic evaluations. It is generally assumed that costs always differ between countries and therefore, cost data should always be adjusted [3,5]. Most guidelines recognized the differences in clinical effectiveness parameters between countries and that these can lead to differences in economic evaluations. It is suggested that country-specific estimates of baseline risk should be used, but that treatment effects from clinical trials might be more transferable. However, there is no unanimous agreement on this. Moreover, less than 40% of the guidelines make any recommendations about the transferability of health-state valuations or utility estimates across countries. The remaining guidelines recommend using value sets from the country of interest [5]. The EQ-5D, a generic instrument for measuring health-related quality of life (HRQOL) in economic evaluations, was developed by the EuroQol group in order to compare utilities across countries [6]. At the moment, seventeen national EQ-5D value sets (previously referred to as tariffs) are available, but only a limited number of comparisons have been carried out. The conclusions of these comparisons were that the dissimilarities could be caused by cultural dissimilarities, differences in population preferences or dissimilarities in the methodology used in the valuation process [6-9]. Levy et al. [10] indicated that when measurement methods to derive utilities are replicated exactly, only small differences across jurisdictions emerge in absolute utility scores. Since methodological differences were eliminated, the remaining differences were probably cultural differences. Nevertheless, utilities from foreign studies are often used directly, without adapting the results by using the appropriate national value set. Due to dissimilarities between the value sets it is unclear if this practice is advisable. However, the interpretation of dissimilarities between the utility values of health states is complex. More clarity is needed on the influence of methodological dissimilarities, before the cultural differences can be determined. Therefore, the objective is to examine the effects of differences in national EQ-5D value sets on both absolute and marginal utili-
89
Chapter 6 ties of health states, and to determine to what degree the differences can be explained by methodological factors. National EQ-5D value sets The EQ-5D consists of five domains: mobility, self-care, usual activities, pain/discomfort and anxiety/depression. Each domain has three levels, so that a total of 243 possible health states can be defined. Each state is described in the form of a five-digit code using three levels. Level one means no problems, level two indicates moderate problems and level three means severe problems in that domain. In general, it is assumed that health utilities are additive and that, consequently, the health utility of someone declines when their health deteriorates [9]. With the EQ-5D, the calculation of health utilities is performed using an additive formula including coefficients when reporting moderate or severe problems in one of the domains, a constant as an extra disutility associated with any deviation from full health and the coefficient ‘N3’ whenever reporting severe problems (level three) on at least one domain [9,11]. In general, it is assumed that the utility scores fall within the 0.0 (dead) to 1.0 (perfect health) value scale. However, people could indicate that certain health states are worse than dead and, in that situation, the utility score will be below 0.0 [12]. The original EQ-5D instrument included utility scores derived from a population sample in the UK in the early 1990s [12]. Because using values derived in one country may misrepresent the values in another country, the EuroQol group has provided different value sets for different countries [7,13,14]. Two valuation methods, time trade-off (TTO) and visual analogue scale (VAS), have been used to develop the value sets. For the valuation of the health states, a selection is made from the 243 possible health states. The selected health states are then valued by a sample of the general population. The TTO valuation study is carried out in the following way: people are asked to imagine that they will be in a health state for 10 years (t) and are then asked to consider a number of shorter periods in full health. When the respondents are unable to choose between the 10 years in the state and a given duration in full health (x), the value of the state is given as x/t [15]. In the VAS valuation study, the respondents are asked to value the health states under the assumption that each health state lasts for 1 year. The collected data are then rescaled from ‘best imaginable health’ = 100 and ‘worst imaginable health’ = 0 to a scale where health state 11111 = 1 and dead = 0 [9]. Finally, a regression model is applied to derive the coefficients for the value set. However, the selection and number of health states and of the study population vary between the valuation studies. Furthermore, the two valuation methods can also result in differences between the value sets. It can be concluded that, in developing the national value sets,
90
Transferability of EQ-5D utilities various design characteristics were used, which resulted in methodological differences among the value sets [9]. Seven countries performed a TTO valuation study, namely Denmark, Germany, Japan, the Netherlands, Spain, Zimbabwe and the UK as given in Table 1 [9]. In addition, eight VAS valuation studies have been carried out, namely in Belgium, Denmark, Finland, Slovenia, Spain, the UK and New Zealand. A European value set has also been constructed using data from eleven valuation studies in six countries, namely Germany, Finland, the Netherlands, Spain, Sweden and the UK. In Table 2, all additive VAS value sets are given [9].
Methods The analyses are based on the value sets that are presented in Szende et al., [9] published on behalf of the EuroQol group. All the calculations were carried out with the official formulas of the EuroQol group. Three kinds of analyses were performed. The first was based on the coefficients in Tables 1 and 2. The second was based on two health states and focused on the changes at the margin in utilities caused by possible deteriorations in these health states. The third analysis focused on explaining the difference in value sets by methodological differences among the valuation studies. For the first analysis, the value sets were compared with each other by ranking the coefficients of level two and level three for all domains. The coefficients of level two and three were subtracted from the utility score for perfect health. A high coefficient results in a high utility loss when the health-state description of a patient scores on that level. By comparing the coefficients in the different value sets, the relative importance of the coefficients in all domains was determined. Then, the differences between the rankings of all value sets combined were examined by calculating Spearman’s correlation coefficient. The correlation between the rankings of the national value sets was calculated with this coefficient. In the second analysis, two health states were selected for additional analysis. These states (21232 and 33321) are part of the common core states that are often included in valuation studies [9]. Furthermore, the selected health states are more severe and can clearly indicate the differences between value sets. For example, health state 21232 describes a depressed patient, who has moderate problems regarding mobility, no problems with self-care, but some problems performing the usual activities. Moreover, this patient will experience extreme pain and discomfort and some anxiety or depression. In health state 33321, a pain patient will have extreme problems with mobility, self-care and the usual activities. Besides these problems, the pain patient will have some pain or discomfort, but no anxiety or depression. The impact of the deterioration of these two health states in one domain on 91
Chapter 6 the resulting utilities was calculated. In this analysis, one of the domains from the original health state deteriorates one level, going from 21232 to 31232. In this way, the marginal value of a decline in the health state can be analysed, which may help to identify the magnitude of the differences between two health states as scored with a specific value set. Value sets that used similar methodologies in the valuation study and countries with both TTO and VAS value sets were compared with each other in subgroup analyses. In accordance with Marra et al., [28] 0.05 is the minimally important difference for the EQ-5D. Since the differences in value sets lead to differences in the utilities and marginal utilities of health states, in the third analysis we examine to what extent these differences in value sets can be explained by methodological differences among the valuation studies. The units of analysis were the separate value sets as obtained for each country using a specific methodology. Since the study design consists of two levels, with value sets at the lowest level and countries at the highest level, multilevel analysis was carried out employing the software MlWin 2.02 [29]. The individual coefficients of the value sets were the dependent variables for the analyses. A separate multilevel analysis was carried out for each of the twelve coefficients of the value set. The following five methodological factors were included as independent variables each time: (i) valuation method used; (ii) N3 variable included or not in the analysis to derive the value set; (iii) number of states included in valuation process; (iv) the way the questionnaires were administered; and (v) the number of people included in the valuation process. The dependent variable N3 or N3 penalty value is a continuous variable that indicates the value of the coefficient N3, and the independent variable N3 is a dichotomous variable that indicates if the coefficient N3 is present or not. A random intercept in the multilevel model reflected the differences between countries not explained by the independent variables included. Since the value sets are treated as population parameters in calculating the utilities, no random term was included in the multilevel analysis at the lowest level. The multilevel analyses were performed for each coefficient of the value sets to identify which factor has an influence on the value of that coefficient. For reasons of power, factors with a p-value