***China***.book Page 371 Monday, April 29, 2002 9:06 AM
Technology transfer
29
Transferring Scientific Knowledge to Farmers Rob W. Fitzpatrick,* Jim W. Cox,* Bruce Munday,† John Bourne‡ and Chunsheng Hu§
Abstract This study describes the development of a systematic approach to identifying important soil morphological and vegetation field indicators. The objective was to use the indicators to target land management in degraded landscapes in a specific region. The authors linked soil–landscape features to the main soil and water processes operating within the landscape. In Australia, they used this information to develop a set of field indicators (e.g. soil colour) within a user-friendly soil classification key that was linked to land-use options to form the basis of a manual. Information written in this format helped farmers and regional advisers to identify options for remediation of waterlogged and saline areas and to improve planning at property and catchment scales. The authors identified a series of steps to be taken in producing the manual. Steps 1 to 5 describe the soil layers and construct them in toposequences, which are then used to map soil types in key surrounding areas. Steps 6 to 9 involve the local community in developing the manual. This chapter describes how manuals were produced for two badly degraded areas in southern Australia (the Mount Lofty Ranges in South Australia and an area in western Victoria) and suggests how they can be applied elsewhere. Descriptive soil information and pictures taken along toposequences are used to identify key soil features. The use of coloured cross-sectional diagrams and photographs of soil and vegetation helps local groups to understand complex scientific processes and terminology, and see how best management practices can be used to advantage. A similar approach using indicators such as soil colour and morphology was developed in Luancheng County on the North China Plain. Scientists in this region linked their data to farmers’ observations to provide a set of indicators to help farmers manage their land more effectively.
* CSIRO Land and Water, PMB 2, Glen Osmond, SA 5064, Australia. Email:
[email protected] † PO Box 375, Mount Torrens, SA 5244, Australia. ‡ Primary Industries and Resources, South Australia, PO Box 752, Murray Bridge, SA 5253, Australia. § Shijiazhuang Institute of Agricultural Modernization, Chinese Academy of Sciences, 286 Huaizhong Road, Shijiazhuang, Hebei 050021, PRC. Fitzpatrick, R.W., Cox, J.W., Munday, B., Bourne, J. and Chunsheng Hu. 2002. Transferring scientific knowledge to farmers. In: McVicar, T.R., Li Rui, Walker, J., Fitzpatrick, R.W. and Liu Changming (eds), Regional Water and Soil Assessment for Managing Sustainable Agriculture in China and Australia, ACIAR Monograph No. 84, 371–384.
371
***China***.book Page 372 Monday, April 29, 2002 9:06 AM
Technology transfer
MUCH has been published on the general application of soil indicators and tests, and on the causes and remediation of land degradation in Australia (e.g. Hunt and Gilkes 1992; Charman and Murphy 1991; Dalgliesh and Foale 1998; Moore 1998; NSW DLWC 2000). Most of these publications provide a good general overview of the major issues but are not designed to address landuse and degradation issues for a specific region, although there are exceptions like SoilPak (McKenzie 1998), which is specific for irrigated cotton in New South Wales. The objective of the studies described in this paper was to develop some tools to communicate scientific knowledge to farmers and regional advisers in order to help them to identify land degradation in specific regions. In Australia, the approach was to produce a manual to help landholders to identify and remedy degradation. The study focused initially on two regions in southern Australia where dryland salinity and waterlogging cause major land degradation— the Mount Lofty Ranges of South Australia and an area in southwestern Victoria. In Luancheng County on the North China Plain, the approach was to show farmers how they could better manage their lands using easily observable soil indicators.
372
Field indicators linked to landform elements help landholders and regional advisers to identify areas of soil degradation. Indicators used for characterising ‘soil quality’ can be descriptive or analytical (Fitzpatrick et al. 1999). Standard descriptive soil indicators such as visual indicators (e.g. colour) and consistency are often used by farmers, regional advisers and scientists in the field to identify and report attributes of soil quality (Fitzpatrick 1996). For example, soil colour can provide a simple means to recognise or predict salt-affected, waterlogged wetlands caused by poor drainage (Fitzpatrick et al. 1996), providing an alternative to the difficult and expensive process of documenting watertable depths to estimate water duration in soils (Cox et al. 1996). Visual indicators may be obvious (e.g. white salt accumulations on soil surfaces) or subtle (e.g. subsoil mottling patterns). Analytical indicators include electrical conductivity (salinity) and dispersion (sodicity). Combining descriptive and analytical indicators can provide vital information about soil–water processes to improve land management and remediation of degraded land (Fitzpatrick et al. 1994). The challenge is to communicate this information to landholders and agricultural advisers.
***China***.book Page 373 Monday, April 29, 2002 9:06 AM
Technology transfer
Fitzpatrick et al. (1994, 1998) have previously shown that complex scientific processes and terminology can be effectively communicated to local groups using coloured cross-sectional diagrams and photographs of soil and vegetation. By combining this approach with community advice, the authors developed easy-to-follow manuals that incorporated soil–landscape and vegetation keys. The manuals could be used as a simple decisionmaking tool for land management based on recommendations in the scientific literature.
Developing a Manual: a Systematic Approach Used in Australia Topography strongly affects the physical and chemical characteristics of soils, because landform influences the flow of water both through and over the soil surface. For example, excessive runoff on sloping ground reduces plant growth by decreasing the availability of soil water, increasing erosion (leading to reduced soil depth) and causing loss of nutrients. On flat land at the bottom of slopes, severe waterlogging can have a pronounced effect on plant production. A specific type of landscape or catchment is generally characterised by a particular succession of soils down the slope of the toposequence, associated with changes in soil moisture (Milne 1934; Sommer and Schlichting 1997). To understand the lateral linkages and relationships between soil profiles down landscape slopes, we developed a systematic approach for studying the morphological (e.g. colour and textural patterns), chemical and mineralogical characterisics of soils and their underlying weathered bedrock or saprolite (Fritsch and Fitzpatrick 1994; Fitzpatrick et al. 1996). We linked these soil–landscape features to the main soil and water processes operating within the landscape and developed a set of field indicators, described in easy-to-follow practical manuals. The manuals help farmers and regional advisers to identify options for remediation of waterlogged and saline catchments and to improve planning at the property and catchment level.
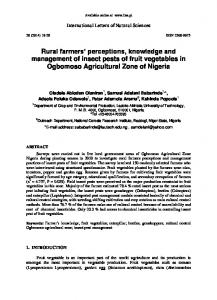
Box 1 shows the sequence of steps used to develop the manuals. Steps 1 to 5 describe the soil layers and construct them in toposequences, which are then used to map soil types in key surrounding areas. Steps 6 to 9 involve the local community in developing the manual. Figure 1 summarises the steps involved. The steps were identified and evaluated during work at a study site in the Mount Lofty Ranges of South Australia (Fitzpatrick et al. 1997) and in western Victoria (Cox et al. 1999). Both regions have 500–600 mm annual rainfall; in both, the problem of land degradation is worsening and farmers are concerned about the rapid increase in saline scalds. Figure 2 shows the location and some characteristics of the Mount Lofty Ranges. Figures 3–5 show some of the tools used in developing and applying the manual: Figure 3 shows an example of a key; Figure 4 shows how major soil types are linked to on-farm management options; Figure 5
Figure 1. Flow diagram showing the main steps involved in developing a pictorial manual to aid property and catchment planning.
373
***China***.book Page 374 Monday, April 29, 2002 9:06 AM
Technology transfer
Box 1. Steps in developing an Australian manual This box summarises the main steps involved in developing a pictorial manual to aid property and catchment planning. These steps are described in detail below and summarised in Figure 1.
Step 1. Select representative focus catchments and landscape sequences Two tasks are required for this step: •
•
Collate soil, geological and climatic information. Using published broad-scale (e.g. regional) soil, geological and climatic maps such as the one shown in Figure 2a; the first task is to select a representative focus catchment such as the one shown in Figure 2b (Fitzpatrick et al. 1997).
•
Describe soil horizons and classify soil profiles. Identify standard soil horizons in order to classify the soils according to soil taxonomy (Soil Survey Division Staff 1998) or the Australian Soil Classification System (Isbell 1996).
Step 3. Group and map similar soil features in the toposequence This step requires two tasks: •
Reconnaissance survey soil in the focus catchment. Establish the most common succession of soil types within the representative catchment, using aerial photographs, road cuttings (if available), random soil augering and soil pits along toposequences. Then select a suite of the most commonly found soils along an idealised toposequence (X–Y shown in Figure 2b).
Group similar soil features into fewer soil layers using structural analysis. Structural analysis of the soil involves three stages: –
use nested or concordant relationships to group soil features, and discordant relationships to separate them;
–
draw boundaries around similar features between the soil profiles to link them down the toposequence, and map them at toposequence scale in cross-sections (Boulet et al. 1982) (Note: soil horizons are not used to demarcate these boundaries because the features used to define soil horizons are too strictly grouped to allow accurate lateral linking between profiles along toposequences); and
–
group similar soil features into a smaller number of soil layers based on concordant and discordant relationships.
Step 2. Describe in detail soils along the selected toposequence This step requires two tasks: •
Describe soil layers in detail. This step involves three stages: –
identify and photograph the complete sequence of soil profiles down the toposequence (X–Y, Figures 2b and c);
–
identify and describe, by depth interval only, all similar soil features (i.e. soil components with similar consistency, colour, textural and structural patterns, and chemical and mineralogical properties) using conventional soil description handbooks (e.g. McDonald et al. 1990; Soil Survey Division Staff 1993); and
–
374
draw boundaries around the similar soil features within the soil profiles and record them (Boulet et al. 1982; Fritsch et al. 1992, Fritsch and Fitzpatrick 1994).
•
Display the combined soil layers of the toposequence graphically in cross-section. Using computer software, display the soil layers graphically in cross sections down toposequences (Rinder et al. 1994). The colour patterns down the X–Y toposequence in Figure 2c display the soil layers.
Step 4. Match soil layers to hydrological processes •
Field monitoring and laboratory analyses. Monitor rainfall, watertable fluctuations (in piezometers and dipwells), soil water content, soil redox (Eh electrodes) and chemical changes (e.g. electrical conductivity, cations and anions) (Cox et al. 1999; Fitzpatrick et al. 1996). To select representative sites and determine soil depths where field instrumentation should be placed, monitoring
***China***.book Page 375 Monday, April 29, 2002 9:06 AM
Technology transfer
Box 1. (cont’d) must focus on identifying changes in soil layers along the entire length of the toposequence. •
Link soil and hydrological processes to soil layers. Link soil and hydrological processes (e.g. water flow paths and salinity) to each soil layer displayed in cross-sections. In Figure 2c hatching represents soil salinity and arrows indicate water flow.
Step 5. Develop vegetation and soil–landscape keys •
•
technical experts, including pasture agronomists, salt land agronomists, livestock advisers, specialists in woody perennial revegetation, soils and drainage specialists, and key community members. Summarise management options in a box above a colour photograph of the soil type located along the generalised toposequence. This process is illustrated in Figure 4.
Step 7. Draft the manual •
Develop easy-to-follow vegetation keys. Photograph and list groups of plants that identify high, moderate and low levels of salting (e.g. Matters and Bozon 1995). Also record features such as plant density, vigour, health and abundance for each category of plant. Develop simple soil–landscape keys. Identify up to 10 soil types that best represent the soils in the study region (which could contain 100 or more soil series), based on topography, simple morphological features and chemical tests. Construct a taxonomic key to enable the reader to easily identify these soil types. The key comprises a colour photograph of the typical soil type, an indication of where the soil is usually found (e.g. crest, mid-slope, lower slope, footslope) and drainage characteristics (well drained, poorly drained). Each soil layer (e.g. top, bottom layer 1, bottom layer 2) is clearly demarcated using a thick black dotted line. Alongside each layer, easily observable (e.g. colour, white salt crystals, vegetation) or measurable (e.g. soil consistency and dispersion) features can be recorded. The key is ordered so that the reader moves systematically through the identification of the soils in a stepwise progression, answering ‘yes’ or ‘no’ to the question of whether the features shown for each soil are present. Selected portions from a key are shown in Figure 3.
Step 6. Link major soil types to on-farm management options For each soil type, identify appropriate management options based on input from a wide range of
Develop a framework. Set up a framework for the spiral-bound manual, including: –
soil keys based on colour photographs of soils and plants;
–
an idealised cross-section of a toposequence sketched in colour compiled from the features found in most of the major toposequences of the region (Figs. 2 and 4); and
–
recording sheets for use in the field.
Figure 5 illustrates a recording sheet. •
Consult with community groups. Work with potential users of the manual to obtain feedback.
Step 8. Produce the final manual Revise the manual in the light of feedback from potential users. Recommendations following the field trials described above included expanding the number of photographs of indicator plants, using high-grade graphics for production of all photographs and constructing a water-resistant summary sheet or insert. The quality of the diagnostic photographs was improved so that that they could be more easily recognised by landholders, and the text was revised with input from both the Northern Hills Soil Conservation Board and local officers of Primary Industries and Resources South Australia.
Step 9. Obtain aerial photographs Obtain aerial photographs for the paddocks (fields) and overlay with clear plastic, on which field observations and management options can be marked. Figure 6 illustrates aerial photographs for the selected catchment.
375
***China***.book Page 376 Monday, April 29, 2002 9:06 AM
Technology transfer
shows one of the recording sheets used in the field. At present, salinity affects only about 1500 ha in the Mount Lofty Ranges but it has a serious impact on Adelaide’s water resource and the expanding wine grape industry. A similar approach was subsequently used in Luancheng County, on the North China Plain. The Overview provides some background information about the study areas in
China and Australia; Figures 1 and 2 of the Overview show their location. The Northern Hills Soil Conservation Board, in South Australia’s Mount Lofty Ranges, expressed an interest in developing a manual based on recommendations in the scientific literature and incorporating a soil–landscape and vegetation key
Figure 2. Diagram showing (a) a regional map of the Mount Lofty Ranges with generalised rainfall, geology, and soil pattern, (b) selected focus catchment, (c) toposequence with soil features and water flow paths and three selected soil profiles (modified from Fitzpatrick et al. 1997).
376
***China***.book Page 377 Monday, April 29, 2002 9:06 AM
Technology transfer
(Fitzpatrick et al. 1994). The board thought that the key described in this work used too much scientific terminology and could be improved if it were made more practical and written in a language and style that would engage landholders. Although the board accepted the need for a simple decision-making tool, it wanted to avoid the approach of ‘glossy’ booklets that are seldom used because they are written in obscure language, involve impractical tests or advocate unrealistic options. The board also required the manual to be ‘road tested’ to demonstrate that it would provide accurate interpretation and lead to realistic management options.
Applying the manual to a farm To use the manual on a particular property, a landholder selects several transects across a
paddock (usually down a slope) likely to have waterlogging or salinity problems, and marks them on a plastic overlay on an aerial photograph of the property. Starting at the top of the hillslope (observation point a1, Fig. 5), observations are made on the recording sheet at several points down the slope (observation points a2 – a7, Fig. 5). Where needed, soil samples are collected for measuring dispersion and pH in the field, using methods described in the manuals. From the information on the recording sheet, the boundaries between soil types and the soil type number (1 – 7) are marked (Fig. 6a), making use of the landholder’s personal knowledge of the paddock, contours and vegetation differences to improve the accuracy of the boundaries. Finally,
Figure 3. Examples of two pages from the taxonomic key for identifying soil features that indicate degrees of waterlogged and saline conditions, and management options (modified from Cox et al. 1999). Magnified areas appear in bold text to give an indication of the nature of the key.
377
***China***.book Page 378 Monday, April 29, 2002 9:06 AM
Technology transfer
management options associated with each of the soil types listed in the key are selected and recorded using a set of symbols (Fig. 6b).
Evaluating the manual in the field Members of the Woorndoo Landcare Group in western Victoria tested the key developed for their area. Some profiles were found to lie between one
standard profile in the key and the next, a situation that has implications for determining appropriate management options. The group had a preconception about the sequence of soils they would find in the landscape, based on surface features such as slope, but discovered that their estimate of the location of profiles was often inaccurate.
Figure 4. Sequence of soils down a slope to a lake (two of the seven soils are illustrated) with brief summaries of management options associated with each of the soil types (modified from Cox et al. 1999).
378
***China***.book Page 379 Monday, April 29, 2002 9:06 AM
Technology transfer
Figure 5. Three sections from the field recording sheet, which consists of three A4 pages (modified from Cox et al. 1999).
Figure 6. (a) Soil type number marked and boundaries demarcated along a single transect on a portion of an aerial photograph, (b) management decisions marked on the aerial photograph showing perennial pastures, fencelines and areas to plant with salt-tolerant shrubs and trees (modified from Cox et al. 1999).
379
***China***.book Page 380 Monday, April 29, 2002 9:06 AM
Technology transfer
Developing Indicators at an Appropriate Scale: the Chinese Approach
Chunsheng 1999). Box 2 shows how indicators were selected and verified to assess soil health on the NCP.
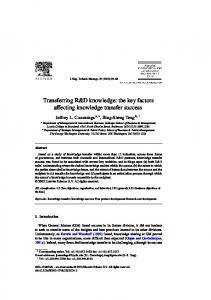
Indicators are measurable attributes of the environment that can be monitored via field observation, field sampling, remote sensing or the compilation of existing data. Each indicator describes a particular function of the environment and can signal desirable or undesirable changes that have occurred or that may occur in the future (Walker and Reuter 1996). Different users have different concerns and objectives, and different indicators may be required for different scales of land use (farmland, county, region). For example, soil colour, soil texture and leaf colour are suitable indicators for farmers but measured data may be more useful for people working on a county scale. Figure 7 shows how soil colour and texture are suitable soil health indicators for farmers. Chinese scientists have developed a set of indicators at farm scale based on measurements of soil properties (Hu Chunsheng and Wang Zhiping 1999; Hu
Discussion
Huang (yellow)
Grey-yellow soil
Hui (grey)
Yellow sandy soil Hei (black)
Sha (sandy) Hei-jia soil Jia (buried soil layer)
Jian (calcareous concretion)
Sha-jian soil
Figure 7. Example of soil classification used by Chinese soil scientists (right) and equivalent categories recognised by farmers (left).
380
The key was a crucial component of the Australian manual. Local advisory officers from Primary Industries and Resources South Australia (PIRSA) and members of the community-based Northern Hills District Soil Conservation Board tested the key developed for the case study area in the Mount Lofty Ranges. A typical subcatchment on a local property was selected at random, and groups of advisory officers each completed separate transects down a toposequence. Surface observation down one transect suggested saline conditions because saline-tolerant plant species dominated much of the area. By exposing the soil profile at a number of points along the transect (Fig. 6a) and comparing it to the standard profiles outlined in the key, it became clear that waterlogging was the major problem, with salinity present only in the lowest part of the subcatchment. Along a second transect there were no plant indicators of saline conditions, and the area was not saline. The group was surprised to find that the profile at the top of the transect was waterlogged rather than well drained, meaning that the pasture species being grown at this location was not ideal. Trialling the manual in the case study areas confirmed the value of the key. It also emphasised the need to look beyond surface soil and plant factors, and to consider additional soil observations and measurements to better understand and manage local situations. Combining the manual with observations of subsurface soil features can improve management decisions. For example, the pasture species most appropriate for well-drained areas on upper and mid-slopes would be different from those selected for areas that are periodically waterlogged, but it would be difficult to distinguish well-drained areas from waterlogged areas by surface observation alone. Similarly, surface
***China***.book Page 381 Monday, April 29, 2002 9:06 AM
Technology transfer
Box 2. Selecting key indicators to assess soil health on the North China Plain At the farmland scale, the main soil indicators should include soil colour, texture, bulk density, field capacity, wilting point, total organic material, total nitrogen, available phosphorus and available potassium. Morphological properties such as soil colour, soil texture and the structure of soil profiles are very useful indicators for farmers to assess the health of the land. In Luancheng County on the piedmont plain of Mount Taihang, farmers can identify six categories of soil that can be used to indicate the degree of soil fertility, the soil tilth index, the degree of porosity and the degree of conservation of soil water and nutrients. These categories are: •
Huang (yellow soil colour), which is associated with good water drainage and good tilth;
•
Hei (black soil colour), associated with a high organic matter content;
•
Hui (grey soil colour), associated with an even higher soil organic matter content than Hei;
•
Sha (sand), associated with good drainage capacity but a low nutrient content and a poor ability to conserve soil water and nutrients;
•
Jia, which is soil with a ‘buried’ soil layer, indicating clay, with poor-quality tilth restricting
Table 1.
the growth of seedlings but suitable for older shoots; and •
Jian, which is soil with calcareous concretion or a calcium horizon, which restricts root growth.
These categories are the easiest and most practical way for farmers to assess soil health. Soil in Luancheng County is typical cinnamon soil with a thin humus layer and middle or thick solum. The buried layer, clay course, calcareous concretion layer, sand soil layer and ploughed layer are the standard diagnostic horizons for soil species classification. Soils can be divided into 17 soil types. The boxes on the right side of Figure 7 show four examples of the soil classification used by soil scientists; those on the left indicate the equivalent categories recognised by farmers.
Case study: grey–yellow soil From the name of the soil, farmers can judge that this kind of soil has good soil structure, tillage properties and moisture capacity, but that there is a plough pan with high bulk density where the soil becomes lighter in colour (Tables 1 and 2). Measurement of root density, consistency and texture confirms farmer perceptions based on soil colour.
Morphology and root density of grey–yellow soil in Luancheng County. Root density (cm/cm3)
Layer
Thickness (cm)
Consistency
Colour
Texture
Corn
Wheat
A1
0–17
Soft
Grey brown
Sandy loam
3.49
1.12
A1B
17–30
Very hard
Light brown
Sandy loam
1.63
0.48
B1
30–65
Firm
Dark brown
Loam
0.51
0.26
B2
65–90
Firm
Dark brown
Loam
0.34
0.25
BK
90–145
Very hard
Light yellow
Light clay
0.16
0.12
B3
145–170
Very hard
Gray yellow
Light clay
0.18
–
BC
170–190
Very hard
Light yellow
Medium clay
–
–
381
***China***.book Page 382 Monday, April 29, 2002 9:06 AM
Technology transfer
Box 2 (cont’d) Table 2.
Physical indicators of grey–yellow soil in Luancheng County.
Thickness (cm)
Field capacity (%)
Wilting point (%)
Plant available water (%)
Bulk density (g/cm3)
Total porosity (%)
Air-filled porosity (%)
A1
0–17
36.35
9.63
26.73
1.41
46.42
10.07
A1B
17–30
34.86
11.37
23.49
1.51
42.62
7.76
B1
30–65
33.25
13.92
19.33
1.47
44.14
10.89
B2
65–90
34.28
13.91
20.37
1.51
42.62
8.34
BK
90–145
34.36
12.95
21.41
1.54
41.48
7.12
B3
145–170
38.98
13.87
25.11
1.64
37.68
1.42
BC
170–190
38.05
16.44
21.61
1.59
39.58
1.53
Layer
(reverse interceptor) drains are sometimes installed to remove water to improve pasture establishment (e.g. Cox and McFarlane 1995); in sodic subsoils they are likely to fail due to dispersion of soil particles, but this condition is difficult to determine simply from surface soil observations. The manual helps users to make good decisions, improves their understanding of the processes of dryland salinity and waterlogging, and offers solutions to improve the quality of their properties. Where the manual has been applied in the Mount Lofty Ranges area, degraded saline wet areas have been rehabilitated and erosion has been halted through measures such as realigning fencelines and revegetation. The manual developed for the Mount Lofty Ranges has been used as a standard text in the small farms land management course that is run four times a year by the local soil board. Bruce Munday, a farmer near Mount Torrens, during an interview with Pyper and Davidson (2001), stated:
382
The publication of the CRC–CSIRO manual on waterlogged, saline and acid sulfate soils in the Mount Lofty Ranges has also made land management that much easier for farmers … The manual is very much a do-it-yourself kit that has enabled us to manage these things properly, rather than by trial and error ... Trial and error has always been a great standby for farmers, but it sometimes has dire consequences.
Conclusions We have summarised a set of procedures for identifying the best set of soil–landscape and vegetation field indicators for a region. Farmers, catchment groups and natural resource management agencies can use the approach to achieve the following outcomes. •
Knowledge of soil and hydrological processes and production systems can be brought together and used as the basis for recommendations for appropriate management options.
***China***.book Page 383 Monday, April 29, 2002 9:06 AM
Technology transfer
•
Viable land-use options and management systems (including mosaic farming) that are more resource efficient than current ‘trial and error’ practices can be adopted.
•
Significant impetus for land-use change based on sound scientific knowledge and community involvement and an understanding of community needs.
•
Effective extension mechanisms that can be used to transcend institutional boundaries (e.g. the Commonwealth Scientific and Industrial Research Organisation (CSIRO); PIRSA; catchment boards; Landcare groups). The mechanisms provide a model for other multiagency interdisciplinary research.
Acknowledgments The research was funded in part ACIAR, Land and Water Australia, the National Landcare Program and the Natural Heritage Trust. We are grateful to members of the Tungkillo Landcare Group for their assistance. Scientists who contributed substantially to the study include Dr E. Fritsch (ORSTOM), Dr P. Self, Mr G. Rinder, Dr D. Reuter, Ms MaryAnne Fiebig (CSIRO) and Dr H. Cadman (Biotext).
References Boulet, R., Humbel, F.X. and Lucas, Y. 1982. Analyse structural et cartographie en pédologie: II Une méthode d’analyse prenant en compte l’organisation tridimensionnelle des couvertures pédologiques. Cahiers ORSTOM, série Pédologie 19, 323–339.
The following procedures are used to identify the best set of soil–landscape and vegetation field indicators:
Charman, P.E.V. and Murphy, B.W. (eds). 1991. Soils: their properties and management—a soil conservation handbook for New South Wales. Sydney University Press and Oxford University Press.
•
Cox, J.W., Fritsch, E. and Fitzpatrick, R.W. 1996. Interpretation of soil features produced by ancient and modern processes in degraded landscapes: VII. Water duration. Australian Journal of Soil Research, 34, 803–824.
identifying easily recognised landform elements and soil morphological features, such as soil colour and consistency, down an idealised slope sequence (toposequence);
Cox, J.W. and McFarlane, D.J. 1995. The causes of waterlogging in shallow soils and their drainage in southwestern Australia. Journal of Hydrology, 167, 175–94.
•
using an idealised toposequence to encompass a compilation of the main features present within most of the major toposequences of a specific region;
Cox, J.W., Fitzpatrick, R.W., Mintern, L., Bourne, J. and Whipp, G. 1999. Managing waterlogged and saline catchments in south-west Victoria: a soil–landscape and vegetation key with on-farm management options. Woorndoo Land Protection Group Area Case Study. Melbourne, CSIRO Publishing, Catchment Management Series No. 2.
•
linking the soil and vegetation indicators to a pictorial soil–landscape and vegetation key and thereby matching to locally practised on-farm management options;
Dalgliesh, N. and Foale, M. 1998. Soil matters: monitoring soil water and nutrients in dryland farming. Toowoomba, Queensland, Agricultural Production Systems Research Unit.
•
•
using, where needed, simple tests for soil electrical conductivity (salinity), dispersion (sodicity) and pH (acidity); and packaging information in an easy-to-follow pictorial manual with input from Landcare groups.
The approach has generic application.
Fitzpatrick, R.W. 1996. Morphological indicators of soil health. In: Indicators of Catchment Health: a technical perspective, eds J. Walker and D.J. Reuter. Melbourne, CSIRO Publishing, 75–88. Fitzpatrick, R.W., Cox, J.W. and Bourne, J. 1997. Managing waterlogged and saline catchments in the Mt. Lofty Ranges, South Australia: a soil–landscape and vegetation key with on-farm management options. Melbourne, CSIRO Publishing, Catchment Management Series No. 1. Fitzpatrick, R.W., Cox, J.W. and Bourne, J. 1998. Soil indicators of catchment health: tools for property planning. In: Proceedings of the International Soil Science Society Congress, Montpellier, France. Montpellier, International Soil Science Society, Symposium No. 37, CD-ROM, 8.
383
***China***.book Page 384 Monday, April 29, 2002 9:06 AM
Technology transfer
Fitzpatrick, R.W., Cox, J.W., Fritsch, E. and Hollingsworth, I.D. 1994. A soil-diagnostic key for managing waterlogging and dryland salinity in catchments in the Mt Lofty Ranges, South Australia. Soil Use and Management, 10, 145–152. Fitzpatrick, R.W., Fritsch, E. and Self, P.G. 1996. Interpretation of soil features produced by ancient and modern processes in degraded landscapes. V. Development of saline sulfidic features in non-tidal seepage areas. Geoderma, 69, 1–29. Fitzpatrick, R.W., McKenzie, N.J. and Maschmedt, D. 1999. Soil morphological indicators and their importance to soil fertility. In: Soil Analysis: an interpretation manual, eds K. Peverell, L.A. Sparrow and D.J. Reuter. Melbourne, CSIRO Publishing, 55–69 Fritsch, E. and Fitzpatrick, R.W. 1994. Interpretation of soil features produced by ancient and modern processes in degraded landscapes. I. A new method for constructing conceptual soil–water–landscape models. Australian Journal of Soil Research, 32, 889–907 (colour figures 880–885). Fritsch, E., Peterschmitt, E. and Herbillon, A.J. 1992. A structural approach to the regolith: identification of structures, analysis of structural relationships and interpretations. Sciences Géologiques, 45(2), 77–97. Hunt, N. and Gilkes, R. 1992. Farm monitoring handbook. Perth, University of Western Australia. Hu Chunsheng. 1999. Physical and chemical indicators of soil health diagnostics and its application. Eco-Agriculture Research (in Chinese ), l.7(3). Hu Chunsheng and Wang Zhiping. 1999. The soil nutrient balance and fertilizer use efficiency in farmland ecosystems in Taihang Mountain Piedmont. Progress in Geography, 17 (supp.), 131–138.
384
McDonald, R.C., Isbell, R.F., Speight, J.G., Walker, J. and Hopkins, M.S. 1990. Australian Soil and Land Survey Field Handbook, 2nd edn. Melbourne, Inkata Press, 87–183. McKenzie, D. 1998. SOILpak for cotton growers, 3rd edn. Orange, New South Wales Agriculture. Milne, G. 1934. Some suggested units of classification and mapping particularly for east African soils. Soil Research, 4(2), 183–198. Moore, G (ed). 1998. Soil Guide: A handbook for understanding and managing soils. Perth, Agriculture Western Australia, Bulletin No. 4343. NSW DLWC (New South Wales Department of Land and Water Conservation). 2000. Soil and Landscape Issues in Environmental Impact Assessment, 2nd edn. Sydney, NSW Department of Land and Water Conservation, Technical Report No. 34. Pyper, W., Davidson, S. 2001. Bubble bubble—Uncovering the true nature and severity of acid sulfate soil in inland Australia. Ecos, 106, 28–31. Rinder, G., Fritsch, E., Fitzpatrick, R.W. 1994. Computing procedures for mapping soil features at sub-catchment scale. Australian Journal of Soil Research, 32, 909–913 (colour figures 886–887). Soil Survey Division Staff. 1993. Soil Survey Manual. United States Department of Agriculture Handbook No. 18. Washington DC, US Government Printing Office. Soil Survey Division Staff. 1998. Keys to Soil Taxonomy, 8th edn. Washington DC, US Government Printing Office.
Isbell, R.F. 1996. The Australian soil classification system. Melbourne, CSIRO Publishing.
Sommer, M. and Schlichting, E. 1997. Archetypes of catenas in respect to matter—a concept for structuring and grouping catenas. Geoderma, 76, 1–33.
Matters, J. and Bozon, J. 1995. Spotting Soil Salting: a Victorian field guide to salt indicator plants. Victoria, Department of Natural Resources and Environment.
Walker, J. and D.J. Reuter (eds). 1996. Indicators of catchment health—A technical perspective. Melbourne, CSIRO Publishing.