Transformation model selection by multiple hypotheses testing Prof. Dr.-Ing. Rüdiger Lehmann University of Applied Sciences Dresden Faculty of Spatial Information Friedrich-List-Platz 1 D-01069 Dresden Tel +49 351 462 3146 Fax +49 351 462 2191 mailto:
[email protected]
Abstract Transformations between different geodetic reference frames are often performed such that first the transformation parameters are determined from control points. If in the first place we do not know which of the numerous transformation models is appropriate then we can set up a multiple hypotheses test. The paper extends the common method of testing transformation parameters for significance, to the case that also constraints for such parameters are tested. This provides more flexibility when setting up such a test. One can formulate a general model with a maximum number of transformation parameters and specialize it by adding constraints to those parameters, which need to be tested. The proper test statistic in a multiple test is shown to be either the extreme normalized or the extreme studentized Lagrange multiplier. They are shown to perform superior to the more intuitive test statistics derived from misclosures. It is shown how model selection by multiple hypotheses testing relates to the use of information criteria like AICc and Mallows’ Cp, which are based on an information theoretic approach. Nevertheless, whenever comparable, the results of an exemplary computation almost coincide. Keywords: Coordinate transformation; Hypothesis test; Affine transformation; Similarity transformation; Gauss-Markov model with constraints; Normalized Lagrange multiplier; Studentized Lagrange multiplier; Akaike information criterion; Mallows’ Cp
1 Introduction Today, geodetic information is often expressed with respect to various geodetic reference frames. To convert such information (like coordinates of points) from one frame to another, coordinate transformations are widely needed and applied in all branches of the modern geodetic profession. Those fields of application range from satellite navigation (e.g. Zhang et al. 2012) to cadastral surveying (e.g. Deakin 1998, 2007) and to photogrammetry (e.g. Goktepe and Kocaman 2010). The most important theoretical and practical problems in these fields are solved. Nonetheless, there are many new developments regarding the computation of coordinate transformation parameters from a set of points with given coordinates in two different reference frames, known as control points (synonymously referred to as identical or homologous points):
1
Postprint of Journal of Geodesy (2014) 88(12)1117-1130, DOI:10.1007/s00190-014-0747-3
There are new results regarding the transformation accuracy. Lehmann (2010) analyzes why and under which conditions the accuracy of transformed points is optimal in the barycenter of the control points. Nowadays, the adjustment of transformation parameters is often computed by robust methods (Kampmann 1996, Kanani 2000, Carosio et al. 2006, Ge et al. 2013). Here it is shown that outliers in coordinates of control points are less influential to the transformation parameters. A more recent development is the total least-squares approach (Schaffrin and Felus 2008, Mahboub 2012). Here, errors are not only assigned to the coordinates of control points, but also to the elements of the system matrix. However, based on the example of a planar similarity transformation Neitzel (2010) shows that the total least-squares solution can be obtained easily from a rigorous evaluation of the Gauss–Helmert model.
In the following we restrict ourselves to three-dimensional (3D) reference frames. In geodesy, we use a variety of 3D transformation models. The most important are (Andrei 2006):
translation (three parameters) rotation (three parameters) rotation and translation (six parameters) rotation, one scalation and translation (similarity transformation, seven parameters) rotation, two scalations and translation (eight parameters) rotation, three scalations and translation (nine parameters) affine transformation (twelve parameters)
Even more complex transformation models are used in geodesy, e.g. transformations using thin plate splines (Donato and Belongie 2002). Alternatively we find piecewise approaches (Lippus 2004), where the region covered by control points is partitioned. In each partition the transformation model is computed independently and later the pieces are glued together into a single transformation. In this paper, we are concerned with the following problem: Given a sufficiently large number of control points, which transformation model should be selected. This problem belongs to a class of problems, which is often referred to as model section (Burnham and Anderson 2002). Often a strong preference for a transformation model can be deduced from the relationship between the reference frames. For example, if they are strictly related by a conformal mapping then the similarity transformation is a proper choice. But often there is no such preference, and the proper model must be selected by means of the control points. If one model contains some extra parameters with respect to the other, like rotation and translation versus similarity transformation, the standard geodetic approach is to test statistically, if the additional parameters are significant, i.e. if the estimated values of these parameters are significantly different from zero. This test is often called v-test in geodesy (Teunissen 2000). Such an approach is e.g. used in Andrei (2006). In the case of the rotation and translation versus the similarity transformation the task would be to test if the scale parameter is significantly different from unity, which can be done by the v-test. But often this is not possible because one model is set up with completely different parameters than another. For example, the parameters of the spatial affine transformation are generally not scales and rotation angles. Therefore, a comparison to the similarity transformation cannot be done by testing the significance of some extra parameters. Making the v-test applicable would require (if possible at all) an
2
Postprint of Journal of Geodesy (2014) 88(12)1117-1130, DOI:10.1007/s00190-014-0747-3
unnatural change of parameterization. In other cases we must select one out of more than two transformation models. In our paper we basically follow the hypothesis testing approach, but extend it, such that not only parameters themselves can be tested, but also constraints on parameters. It will turn out that this case arises e.g. in the problem of transformation model selection. Moreover, it is necessary to understand that we are performing a multiple hypotheses test, which adheres to other laws than the classical hypothesis test (Miller 1981). This is not always properly understood and leads to misconceptions. For example, the significance test of the transformation model parameters performed by Ziggah et al. (2013) should have been such a multiple test. Other approaches to model selection used in statistics are based on information criteria (Burnham and Anderson 2002). The idea is that more complex models can generally fit the data better, but this may result in overfitting, i.e. unduly complex models partly fit the observation errors. Therefore, pure goodness of fit is not a valid criterion for model selection, but a penalty term for model complexity needs to be introduced. The most important information criteria are
Akaike information criterion (AIC), see Akaike (1974), its alternate version (AICc, which means AIC with a correction for small data sets), Bayesian information criterion (BIC) and Mallows’ Cp , see Mallows (1973).
Given a set of candidate models for the data, the preferred model is the one with the minimum AIC or AICc or BIC value, or the one with Cp value approaching the number of model parameters. The AICc has been used for the transformation model selection by Felus and Felus (2009) because it is recommended for small sets of observations. We will return to this approach in Sect. 8. The paper is organized as follows: after introducing transformation equations and constraints for common spatial coordinate transformations we set up a Gauss-Markov model(GMM) with constraints and solve the model selection problem by a multiple hypotheses test. Following Lehmann and Neitzel (2013) it is shown that the proper test statistics for such a test are the extreme normalized or externally studentized Lagrange multipliers (LMs, also known as correlates in geodesy). We emphasize that the use of normalized LMs as test statistics in geodesy goes back to Teunissen (1985). In a numerical example, it is shown how these tests work and how they are superior to more intuitively defined test statistics. Finally, we comment on the relationship of this model selection strategy in relation to information criteria, exemplified for AICc.
2 Transformation equations and constraints Given a number of points with coordinates in two different spatial reference frames (known as control points), the problem is to find a good model for the transformation between these two frames. The given coordinates may be affected by random observation errors with known stochastic properties. We start from the 3D affine transformation, which obeys the following system of equations: 𝑡1 𝑡11 𝜉𝑏 (𝜂𝑏 ) = (𝑡2 ) + (𝑡21 𝑡3 𝑡31 𝜁𝑏
3
𝑡12 𝑡22 𝑡32
𝑡13 𝜉𝑎 𝜉𝑎 𝑡23 ) (𝜂𝑎 ) =: 𝑡 + 𝑇 (𝜂𝑎 ) 𝑡33 𝜁𝑎 𝜁𝑎
Postprint of Journal of Geodesy (2014) 88(12)1117-1130, DOI:10.1007/s00190-014-0747-3
(1)
Here 𝜉𝑎 , 𝜂𝑎 , 𝜁𝑎 denote the coordinates of a point in the initial reference frame and 𝜉𝑏 , 𝜂𝑏 , 𝜁𝑏 denote the coordinates of the same point in the target reference frame. This transformation model has twelve transformation parameters 𝑡1 , 𝑡2 , 𝑡3 , 𝑡11 , … , 𝑡33 . All other relevant models can be derived therefrom by imposing constraints on these twelve parameters as follows: A nine parameter transformation is derived by imposing orthogonality of the rows of 𝑇. In other words, the elements of 𝑇 need to fulfill the following three constraints (e.g. Andrei 2006, chapter 2): 𝑡11 𝑡21 + 𝑡12 𝑡22 + 𝑡13 𝑡23 = 0 𝑡11 𝑡31 + 𝑡12 𝑡32 + 𝑡13 𝑡33 = 0 𝑡21 𝑡31 + 𝑡22 𝑡32 + 𝑡23 𝑡33 = 0
(2) (3) (4)
In this special case we can express (1) as µ1 𝜉𝑏 (𝜂𝑏 ) = 𝑡 + ( 0 𝜁𝑏 0
0 µ2 0
0 𝜉𝑎 0 ) 𝑅 (𝜂𝑎 ) µ3 𝜁𝑎
(5)
where 2 2 2 µ1 = √𝑡11 + 𝑡12 + 𝑡13 2 2 2 µ2 = √𝑡21 + 𝑡22 + 𝑡23 2 2 2 µ3 = √𝑡31 + 𝑡32 + 𝑡33
are scale factors and 𝑅 is a rotation matrix (orthogonal matrix with determinant 1). A way of expressing this transformation by nine parameters is by 𝑡1 , 𝑡2 , 𝑡3 , µ1 , µ2 , µ3 and by three Eulerian rotation angles. Another nine parameter transformation can be defined by requiring the columns of 𝑇 to be orthogonal, rather than the rows. Here the diagonal matrix of scale factors and 𝑅 are interchanged. Both transformations are essentially different. An eight parameter transformation is practically less important. It is motivated by the fact that horizontal coordinates are sometimes determined by different technologies than vertical coordinates. Therefore, the scales in horizontal directions may be equal, i.e. µ1 = µ2 , while µ3 is kept as an independent parameter (e.g. Andrei 2006, chapter 3): µ1 𝜉𝑏 (𝜂𝑏 ) = 𝑡 + ( 0 𝜁𝑏 0
0 µ1 0
0 𝜉𝑎 0 ) 𝑅 (𝜂𝑎 ) µ3 𝜁𝑎
(6)
The specialization from (5) to (6) is equivalent to the constraint µ1 = µ2 , but since we want to impose this constraint on the model (1), it must be expressed in terms of the transformation parameters of this model: 2 2 2 2 2 2 𝑡11 + 𝑡12 + 𝑡13 − 𝑡21 − 𝑡22 − 𝑡23 =0
Also in (6) the diagonal matrix of scale factors and 𝑅 may be interchanged, yielding a different transformation model with eight parameters.
4
Postprint of Journal of Geodesy (2014) 88(12)1117-1130, DOI:10.1007/s00190-014-0747-3
(7)
The seven parameter similarity transformation (in geodesy also known as spatial Helmert transformation) is obtained by requiring all scales to be equal, i.e. µ ≔ µ1 = µ2 = µ3 . The system of transformation equations now reads (e.g. Andrei 2006, section 1.2): 𝜉𝑏 𝜉𝑎 (𝜂𝑏 ) = 𝑡 + µ𝑅 (𝜂𝑎 ) 𝜁𝑏 𝜁𝑎
(8)
Here µ and 𝑅 can obviously be interchanged without changing the transformation. In order to restrict the eight parameter transformation (6) to the similarity transformation (8), a further constraint must be added. There are several equivalent possibilities, how such a constraint could read. We favor the following: 2 2 2 2 2 2 2 2 2 )/2 𝑡31 + 𝑡32 + 𝑡33 − (𝑡11 + 𝑡12 + 𝑡13 + 𝑡21 + 𝑡22 + 𝑡23 =0
(9)
The reason is that this constraint makes sense even without (7): µ3 equals the quadratic mean of µ1 and µ2 , or equivalently, µ23 equals the mean of µ12 and µ22 . This is instructive even if µ1 and µ2 are different: A transformation using (9) without (7) deforms a sphere to an ellipsoid with one axis length being the quadratic mean of the other two axis lengths. The spatial rotation and translation is obtained by requiring µ = 1: 𝜉𝑏 𝜉𝑎 (𝜂𝑏 ) = 𝑡 + 𝑅 (𝜂𝑎 ) 𝜁𝑏 𝜁𝑎
(10)
In order to restrict the similarity transformation (8) to this transformation, we favor the following form of the constraint µ = 1: 2 2 2 2 2 2 2 2 2 𝑡31 + 𝑡32 + 𝑡33 + 𝑡11 + 𝑡12 + 𝑡13 + 𝑡21 + 𝑡22 + 𝑡23 =3
(11)
The reason is that this constraint makes senses even without (7) and (9): The quadratic mean of µ1 , µ2 and µ3 equals unity, or equivalently the mean of µ12 , µ22 and µ23 equals unity. This is instructive even if µ1 , µ2 , µ3 are different: A transformation using (11) without (7) and (9) deforms a sphere to an ellipsoid such that the space diagonal of the bounding cuboid preserves length. The pure spatial rotation is derived by additionally requiring that 𝑡1 = 0, 𝑡2 = 0, 𝑡3 = 0 The pure spatial translation is obtained by requiring 𝑅 to be the unit matrix. This could be achieved by additionally imposing the constraints 𝑡11 = 1, 𝑡22 = 1, 𝑡33 = 1 (Remember that a rotation matrix with 1,1,1 on the main diagonal is uniquely determined as the unit matrix.) But since such transformation models are rarely used in geodesy, the last two sets of constraints will not be used in the sequel. If we want to decide if the general transformation like the affine transformation (1) is the correct model or a more special one like the similarity transformation (8), then we have to decide, whether the constraints restricting the generality of (1) to (8) are compatible with the given coordinates of the control points or not.
5
Postprint of Journal of Geodesy (2014) 88(12)1117-1130, DOI:10.1007/s00190-014-0747-3
Due to inevitable observation errors we can in general not expect the estimated parameters to fulfill such constraints exactly. But if the constraints show only small misclosures then we may assume that the special model is sufficient to represent the relationship between both reference frames. It remains to be shown how smallness of misclosures or a similar criterion is to be defined.
3 Gauss-Markov model The general transformation problem can be formulated as a non-linear Gauss-Markov model (GMM) 𝑌 = 𝒜(𝑋) − 𝑒
(12)
where 𝑌 is a 𝑛-vector of given coordinates of control points and 𝑋 is a 𝑢-vector of unknown transformation model parameters, augmented by some unknown true values of coordinates (see below). 𝒜 is a known nonlinear operator mapping from the 𝑢-dimensional parameter space to the 𝑛-dimensional observation space. 𝑒 is an unknown random 𝑛-vector of normally distributed observation errors. The associated stochastic model reads: 𝑒 ∼ 𝑁(0, 𝜎 2 𝑃−1 )
(13)
𝑃 is a known 𝑛 × 𝑛-matrix of weights (weight matrix). 𝜎 2 is the a priori variance factor, which may be either known or unknown. It is also customary to formulate coordinate transformations as a Gauss-Helmert model. But this model can be transformed into the GMM by the simple variable substitution given in (Koch 1999 p. 212). When testing the compatibility of constraints for parameters, it is better to restrict ourselves to GMM because then we can immediately use the results given by Lehmann and Neitzel (2013). For the 3D affine transformation (1) the non-linear observation equations associated with a control point having six observed coordinates read 𝜉𝑎 = 𝜉𝑎𝑡𝑟𝑢𝑒 − 𝑒𝜉𝑎 𝜂𝑎 = 𝜂𝑎𝑡𝑟𝑢𝑒 − 𝑒𝜂𝑎 𝜁𝑎 = 𝜁𝑎𝑡𝑟𝑢𝑒 − 𝑒𝜁𝑎 𝑡𝑟𝑢𝑒 𝜉𝑏 = 𝑡1 + 𝑡11 ⋅ 𝜉𝑎 + 𝑡12 ⋅ 𝜂𝑎𝑡𝑟𝑢𝑒 + 𝑡13 ⋅ 𝜁𝑎𝑡𝑟𝑢𝑒 − 𝑒𝜉𝑏 𝜂𝑏 = 𝑡2 + 𝑡21 ⋅ 𝜉𝑎𝑡𝑟𝑢𝑒 + 𝑡22 ⋅ 𝜂𝑎𝑡𝑟𝑢𝑒 + 𝑡23 ⋅ 𝜁𝑎𝑡𝑟𝑢𝑒 − 𝑒𝜂𝑏 𝜁𝑏 = 𝑡3 + 𝑡31 ⋅ 𝜉𝑎𝑡𝑟𝑢𝑒 + 𝑡32 ⋅ 𝜂𝑎𝑡𝑟𝑢𝑒 + 𝑡33 ⋅ 𝜁𝑎𝑡𝑟𝑢𝑒 − 𝑒𝜁𝑏
(14)
Let there be given 𝑝 control points. Then 𝑛 = 6𝑝 and the vector of observations reads 𝑌 = (… , 𝜉𝑎 , 𝜂𝑎 , 𝜁𝑎 , 𝜉𝑏 , 𝜂𝑏 , 𝜁𝑏 , … )𝑇
(15)
Also 𝑢 = 3𝑝 + 12 and the vector of GMM parameters reads 𝑋 = (… , 𝜉𝑎𝑡𝑟𝑢𝑒 , 𝜂𝑎𝑡𝑟𝑢𝑒 , 𝜁𝑎𝑡𝑟𝑢𝑒 , … , 𝑡1 , 𝑡2 , 𝑡3 , 𝑡11 , 𝑡12 , … , 𝑡32 , 𝑡33 )𝑇 Note the difference between transformation parameters and GMM parameters. The latter set also comprises the unknown true values of coordinates in the initial frame.
6
Postprint of Journal of Geodesy (2014) 88(12)1117-1130, DOI:10.1007/s00190-014-0747-3
(16)
𝒜 is clearly a non-linear operator here. (The affine transformation model would be immediately linear only if all 𝜉𝑎 , 𝜂𝑎 , 𝜁𝑎 could be treated as error-free.) In the sequel we exclude singular configurations of the control points (like coplanarity), such that all parameters can be uniquely determined in the unconstrained GMM. The 𝑚 constraints restricting the general transformation model to the special one can be formulated as ℬ(𝑋) = 𝒷
(17)
where ℬ is a generally non-linear operator mapping the unknown GMM parameter vector 𝑋 to a known 𝑚vector 𝒷. In fact, due to the non-linearity of the constraints (2),(3),(4),(7),(9),(11) the operator ℬ related to the affine transformation problem is non-linear. If the special transformation does not describe the relationship between the reference frames correctly then we get true misclosures 𝑊 ∶= ℬ(𝑋) − 𝒷
(18)
After computing an estimate 𝑋̂ of the parameters of the unconstrained GMM we can insert 𝑋̂ into the constraints and come up with estimated misclosures: ̂ := ℬ(𝑋̂) − 𝒷 𝑊
(19)
̂ ≠ 0 even if 𝑊 = 0 holds. For example, the Due to inevitable observation errors we get in general 𝑊 misclosures related to constraints (2),(3),(4) can be interpreted as the sines of the three shear angles related to the affine transformation.
4 Hypothesis test in the non-linear model In geodesy the decision problem on the proper transformation model is generally posed as a statistical hypothesis test. Opposing the special model represented by the GMM (12),(13) augmented by constraints (17) to a general model represented by the unconstrained GMM is equivalent to opposing the null hypothesis 𝐻0 : 𝑊 = 0
(20a)
𝐻𝐴 : 𝑊 ≠ 0.
(20b)
to the alternative hypothesis
If 𝐻0 is to be rejected then we decide on the general model, otherwise the special model is used for the transformation between the given reference frames. The standard solution of the testing problem in classical statistics goes as follows (e.g. Tanizaki 2004 p. 49 ff): 1. A test statistic 𝑇(𝑌) is introduced, which is known to assume extreme values if 𝐻0 does not hold true. 2. Under the condition that 𝐻0 holds true, the probability distribution of 𝑇(𝑌) is derived, represented by a cumulative distribution function (CDF) 𝐹(𝑇|𝐻0 ). 3. A probability of type I decision error α (significance level) is suitably defined (say 0.01 or 0.05 or 0.10).
7
Postprint of Journal of Geodesy (2014) 88(12)1117-1130, DOI:10.1007/s00190-014-0747-3
4. For one-sided tests a critical value 𝑐 is derived by 𝑐 = 𝐹 −1 (1 − 𝛼|𝐻0 ) where 𝐹 −1 denotes the inverse CDF (also known as quantile function) of 𝑇|𝐻0 . (For two-sided tests two critical values are needed, but this case does not show up in this investigation.) 5. The empirical value of the test statistic 𝑇(𝑌) is computed from the given observations 𝑌. If 𝑇(𝑌) > 𝑐 then 𝐻0 must be rejected, otherwise we fail to reject 𝐻0 . In principle we are free to choose a test statistic. Even heuristic choices like ̂‖ 𝑇(𝑌) ≔ ‖𝑊
(21)
with some suitable norm ‖∙‖ are conceivable. Although the statistical power (probability of rejection of 𝐻0 when it is false) of such a test might not be optimal or even poor. Consider for example the problem of opposing the affine transformation model (1) with the nine parameter ̂ would be the vector of sines of the shear angles computed from estimated transformation model (6). 𝑊 ̂ , 𝑡12 ̂ , … , 𝑡̂32 , 𝑡̂33. A possible test statistic would be the RMS or maximum affine transformation parameters 𝑡11 absolute value of these estimated misclosures. In some instances the misclosure is directly interpreted as a deviation of a parameter from a fixed value: Consider for example the problem of opposing the similarity transformation model (8) with the rotation and translation model (10). The effective constraint is µ = 1 here, and we can test if the estimated parameter µ̂ in (8) is significantly different from unity. It is here equivalent to (21) because µ̂ − 1 is nothing but the estimated misclosure (19) of the related constraint µ = 1. In geodesy we most often apply the likelihood ratio (LR) test (e.g. Tanizaki 2004 p. 54 ff). The rationale of the LR test is provided by the famous Neyman–Pearson lemma (Neyman and Pearson 1933), which demonstrates that under various assumptions such a test has the highest power among all competitors. It is often applied even if we cannot exactly or only approximately make these assumptions in practice because we know that the power is still larger than for rival tests (Teunissen 2000, Kargoll 2012). Moreover, we can oppose the general model to a set of special models in parallel. This is equivalent to opposing 𝐻0 in (20a) to a set of multiple alternative hypotheses 𝐻𝐴1 , 𝐻𝐴2 , …. , 𝐻𝐴𝑚 . Each of them proposes that only a subset of constraints is violated, or equivalently, a subset of elements of 𝑊 is non-zero. In this way we come up with a multiple hypotheses test. It is performed by testing 𝐻0 vs. 𝐻𝐴1 , 𝐻0 vs. 𝐻𝐴2 ,…, 𝐻0 vs. 𝐻𝐴𝑚 , and 𝐻0 is rejected if and only if it is rejected in any of the 𝑚 tests. However, theses tests are not performed with quantile probability 𝛼, but 𝛼/𝑚. The rationale for this is that the producers risk must be portioned to 𝑚 alternative hypotheses. Nonetheless, this treatment is fully valid only if the 𝑚 test statistics are statistically independent, which is often violated. Lehmann (2012) shows how to improve this in the case of geodetic outlier detection. A recommendable textbook on this topic is (Miller 1981). Consider for example the case that we want to test if
𝐻0 : the rotation and translation (10) is the correct model or 𝐻𝐴1 : the similarity transformation model (8) or 𝐻𝐴2 : the eight parameter transformation model (6) or 𝐻𝐴3 : the nine parameter transformation model (5) or 𝐻𝐴4 : the affine transformation model (1).
8
Postprint of Journal of Geodesy (2014) 88(12)1117-1130, DOI:10.1007/s00190-014-0747-3
We set up the observation equations of the affine transformation and augment the resulting GMM by the constraints (2),(3),(4),(7),(9),(11). 𝐻𝐴1 is then the hypothesis that (11) is in conflict with the observations and the rest of the constraints. 𝐻𝐴2 is then the hypothesis that (9) and (11) are in conflict with the observations and (2),(3),(4),(7). 𝐻𝐴3 is now the hypothesis that (7),(9),(11) are in conflict with the observations and (2),(3),(4) and finally 𝐻𝐴4 is the hypothesis that all six constraints are in conflict with the observations (i.e. they produce true misclosures 𝑊 ≠ 0).
5 Linearization In general non-linear models the desired CDF 𝐹(𝑇|𝐻0 ) cannot be analytically derived. Not even the CDF of 𝑋̂ can be analytically derived here. A numerical technique for deriving such distributions is the Monte Carlo method, but it is often computationally costly. The family of normal distributions enjoys the famous property of constituting a family of stable distributions, i.e. linear combinations of normal random variables are also normally distributed. Therefore, in a linear ̂ etc. are known to be normal too. model, where 𝒜, ℬ are linear operators, the distributions of 𝑋̂, 𝑊 However, if the non-linear model is somehow close to a linear model, then the relevant distributions are still somehow close to normal. (Otherwise the representation of the solution by the estimate 𝑋̂ and possibly a covariance matrix associated with it would be meaningless.) The common procedure in this case is to introduce approximate parameters 𝑋 0 , e.g. by solving 12 selected affine transformation equations neglecting observation errors. Then we get with 𝑥 ≔ 𝑋 − 𝑋 0 , 𝑦 ≔ 𝑌 − 𝒜(𝑋 0 ), 𝑏 ≔ 𝒷 − ℬ(𝑋 0 ) the linearized GMM 𝑦 = 𝐴𝑥 − 𝑒
(22)
𝐵𝑇 𝑥 = 𝑏
(23)
with linearized constraints
𝐴 and 𝐵𝑇 denote the Jacobian matrices of 𝒜 and ℬ at 𝑋 0 . Transposition of 𝐵 is introduced here to come close to the standard geodetic notation, also used by Lehmann and Neitzel (2013). The linearized true misclosures now read 𝑤 ≔ 𝐵𝑇 𝑥 − 𝑏
(24)
In a 3D affine transformation it is customary to use 0 0 0 0 )𝑇 𝑋 0 : = (… , 𝜉𝑎 , 𝜂𝑎 , 𝜁𝑎 , … , 𝑡10 , 𝑡20 , 𝑡30 , 𝑡11 , 𝑡12 , … , 𝑡32 , 𝑡33
(25)
0 0 0 0 where 𝑡10 , 𝑡20 , 𝑡30 , 𝑡11 , 𝑡12 , … , 𝑡32 , 𝑡33 are computed from four selected control points (not coplanar).
The resulting linearized observation equations (14) and linearized constraints (2),(3),(4),(7),(9),(11) in the form of (22),(23) are built of:
9
Postprint of Journal of Geodesy (2014) 88(12)1117-1130, DOI:10.1007/s00190-014-0747-3
⋮ 0 0 0 0 0 0 𝑦 = 𝜉𝑏 − 𝑡10 − 𝑡11 ⋅ 𝜉𝑎 − 𝑡12 ⋅ 𝜂𝑎 − 𝑡13 ⋅ 𝜁𝑎 0 0 0 0 𝜉𝑏 − 𝑡2 − 𝑡21 ⋅ 𝜉𝑎 − 𝑡22 ⋅ 𝜂𝑎 − 𝑡23 ⋅ 𝜁𝑎 0 0 0 𝜉𝑏 − 𝑡30 − 𝑡31 ⋅ 𝜉𝑎 − 𝑡32 ⋅ 𝜂𝑎 − 𝑡33 ⋅ 𝜁𝑎 ( ) ⋮
𝐴=
(
⋯1 0 0 ⋯0 1 0 ⋯0 0 1 0 0 0 ⋯ 𝑡11 𝑡12 𝑡13 0 0 0 ⋯ 𝑡21 𝑡22 𝑡23 0 0 0 ⋯ 𝑡31 𝑡32 𝑡33
⋯ ⋯ ⋯ ⋯ ⋯ ⋯
⋮ 000 0 0 0 0 0 0 0 0 0 000 0 0 0 0 0 0 0 0 0 000 0 0 0 0 0 0 0 0 0 1 0 0 𝜉𝑎 𝜂𝑎 𝜁𝑎 0 0 0 0 0 0 0 1 0 0 0 0 𝜉𝑎 𝜂𝑎 𝜁𝑎 0 0 0 0 0 1 0 0 0 0 0 0 𝜉𝑎 𝜂𝑎 𝜁𝑎 ) ⋮
0 0 0 0 0 0 −𝑡11 𝑡21 −𝑡12 𝑡22 −𝑡13 𝑡23 0 0 0 0 0 0 −𝑡11 𝑡31 −𝑡12 𝑡32 −𝑡13 𝑡33 0 0 0 0 0 0 −𝑡21 𝑡31 −𝑡22 𝑡32 −𝑡23 𝑡33 𝑏= 0 0 0 0 0 )2 0 )2 2 2 2 2 (𝑡21 ) + (𝑡22 ) + (𝑡23 ) − (𝑡11 ) − (𝑡12 − (𝑡13 0 0 0 0 0 0 0 0 )2 0 )2 2 2 2 2 2 2 ((𝑡11 ) + (𝑡12 ) + (𝑡13 ) + (𝑡21 ) + (𝑡22 ) + (𝑡23 ) )/2 − (𝑡31 )2 − (𝑡32 − (𝑡33 0 )2 0 )2 0 )2 0 )2 0 )2 0 )2 0 )2 0 )2 0 )2 − (𝑡12 − (𝑡13 −(𝑡21 − (𝑡22 − (𝑡23 −(𝑡31 − (𝑡32 − (𝑡33 ( 3−(𝑡11 )
0 0 0 0 0 0 ⋯ 0 𝑡21 𝑡22 𝑡23 𝑡11 𝑡12 0 0 0 0 ⋯ 0 𝑡31 𝑡32 𝑡33 0 0 0 0 0⋯0 0 0 0 𝑡31 𝑡32 𝐵𝑇 = 0 0 0 0 0 0 ⋯ 0 2𝑡11 2𝑡12 2𝑡13 − 2𝑡21 − 2𝑡22 0 0 0 0 0 0 ⋯ 0 −𝑡11 −𝑡12 − 𝑡13 − 𝑡21 − 𝑡22 0 0 0 0 0 2𝑡12 2𝑡13 2𝑡21 2𝑡22 ( 0 ⋯ 0 2𝑡11
0 𝑡13 0 0 0 0 0 0 0 𝑡11 𝑡12 𝑡13 0 0 0 0 𝑡33 𝑡21 𝑡22 𝑡23 0 − 2𝑡23 0 0 0 0 0 0 0 − 𝑡23 2𝑡31 2𝑡32 2𝑡33 0 0 0 0 2𝑡23 2𝑡31 2𝑡32 2𝑡33 )
(26)
(27)
(28)
(29)
6 Hypothesis test in the linearized model The problem is now to identify constraints which in the linearized GMM with constraints are in conflict with the observations and the rest of the constraints, indicating that the transformation model is too special. The standard approach is to test, if all constraints are in conflict with the observations. The hypotheses to be tested here, read 𝐻0 : 𝑤 = 0 versus 𝐻𝐴 : 𝑤 ≠ 0
(30)
In the case developed in the last section this would mean to discriminate between the two models of the rotation & translation (𝐻0 is true) and of the affine transformation (𝐻𝐴 is true). As Lehmann and Neitzel (2013) have shown, it is possible to identify also conflicting subsets of constraints. If e.g. only the last three constraints (7),(9),(11) are conflicting then the nine parameter transformation would
10
Postprint of Journal of Geodesy (2014) 88(12)1117-1130, DOI:10.1007/s00190-014-0747-3
be the transformation model of choice. This is equivalent to eliminating the conflicting constraints. Since we have more than two options how to build subsets of constraints, this requires a multiple test. The most appealing layout of such a multiple test would be to test if an individual constraint is in conflict with the observations and the rest of the constraints. The drawback is that eliminating one of the first five constraints, the resulting transformation does not have a name in geodesy. However, this does not mean that it is excluded to apply such a transformation practically. Since a priori we do not know which of the considered six constraints is the best candidate for elimination, we need to test the compatibility of all individual constraints in parallel. Following Lehmann and Neitzel (2013) the test statistic of such a test derived from the classical likelihood ratio is -
either the extreme normalized Lagrange multiplier (LM) 𝑇5′′ = max | 𝑖=1,…,𝑚
-
𝑘̂𝑖′ 𝜎𝑘̂ ′ 𝑘̂′
|
(31)
𝑖 𝑖
or the extreme externally studentized Lagrange multiplier (LM)
𝑇6′′
𝑘̂𝑖′ = max | ′′ | 𝑖=1,…,𝑚 𝜎 ̂𝑘̂′ 𝑘̂′
(32)
𝑖 𝑖
𝑇5′′ should be used if the a priori variance factor 𝜎² is known and 𝑇6′′ should be used otherwise. For convenience, the notation of (Lehmann and Neitzel 2013, eqs. 5.13, 5.14, 5.75, 5.76) is adopted here as follows: 𝑘̂𝑖′ denotes the estimate of the LM related to the 𝑖-th constraint, when solving the fully constrained GMM, 𝜎𝑘̂ ′ 𝑘̂ ′ denotes the standard deviation of this value using the a priori variance factor 𝜎² and 𝜎̂𝑘̂′′′ 𝑘̂′ 𝑖 𝑖
𝑖 𝑖
denotes the standard deviation of 𝑘̂𝑖′ using an estimate 𝜎̂𝑖′′ ² of 𝜎². This estimate denotes the common best quadratic unbiased estimate, but in the semi-constrained GMM. This means that for computing the estimate 𝜎̂𝑖′′ ² of 𝜎² the 𝑖-th constraint must be dropped. From (Lehmann and Neitzel 2013, eqs. 5.53-5.56) the following distributional results can be adopted: 𝑘̂𝑖′ 𝜎𝑘̂ ′ 𝑘̂ ′ 𝑖 𝑖 𝑘̂𝑖′ 𝜎𝑘̂ ′ 𝑘̂ ′ 𝑖 𝑖 𝑘̂𝑖′ 𝜎̂𝑘̂′′′ 𝑘̂′ 𝑖 𝑖 𝑘̂𝑖′ 𝜎̂𝑘̂′′′ 𝑘̂′
|𝐻0 ~𝑁(0,1) |𝐻𝐴 ~𝑁(𝜆𝑖 , 1) |𝐻0 ~𝑡(𝑛 − 𝑢 + 𝑚 − 1) |𝐻𝐴 ~𝑡′(𝑛 − 𝑢 + 𝑚 − 1, 𝜆𝑖 )
(33a) (33b) (34a) (34b)
𝑖 𝑖
Here 𝑡(𝑓) and 𝑡′(𝑓, 𝜆) denote the central and non-central Student’s t-distribution with 𝑓 degrees of freedom and non-centrality parameter 𝜆. Both in (33b) and (34b) the non-centrality parameter 𝜆𝑖 reads 𝑤𝑖 √𝑞𝑘̂′ 𝑘̂′
𝑤𝑖 𝜎𝑘̂ ′ 𝑘̂ ′
𝑖 𝑖 = 𝜎 𝜎2 Postprint of Journal of Geodesy (2014) 88(12)1117-1130, DOI:10.1007/s00190-014-0747-3
𝜆𝑖 =
11
𝑖 𝑖
(35)
Practically, the true misclosure 𝑤𝑖 in the 𝑖-th constraint is unknown, and perhaps also the a priori variance factor 𝜎². The cofactor 𝑞 ̂ ′ ̂ ′ of 𝑘̂𝑖′ is always known. 𝑘𝑖 𝑘𝑖
After choosing a probability of type I error 𝛼, a critical value must be taken from either of the distributions (33a) or (34a), but with quantile probability 𝛼/𝑚 in both cases, because the actual test statistics in the multiple test are the extreme LMs 𝑇5′′ or 𝑇6′′ (see section 4) . If the critical value is exceeded by the related test statistic 𝑇5′′ in (31) or 𝑇6′′ in (32) then we are inclined to reject 𝐻0 : 𝑤 = 0. This means here that the rotation & translation transformation model is not adequate. We should now drop the constraint, at which the maximum in (31) or (32) is attained. Not unlike the common practice in geodesy when dealing with extreme normalized or studentized residuals in outlier detection, it is possible to iterate the procedure, until no further conflicting constraint can be identified.
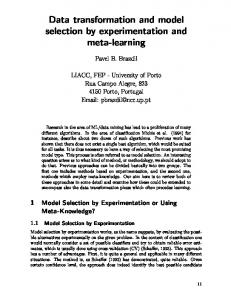
7 Example: 3D transformation based on six control points 7.1 Null hypothesis is true We illustrate and investigate the procedure in a setup of six control points forming a flattened octahedron, see Table 1 and Figure 1. The height ℎ of the octahedron will be varied. The true transformation parameters are defined as zero except 𝑡11 = 𝑡22 = 𝑡33 = µ𝑡𝑟𝑢𝑒 . This means that the similarity transformation model (8) is the proper model, except when µ𝑡𝑟𝑢𝑒 = 1. In this case the rotation and translation transformation model (10) is adequate. This setup has 𝑛 = 2 ∗ 3 ∗ 6 = 36 observations. (The frames could also have been rotated or translated with respect to each other without changing the subsequent results because the constraints for “no rotation” and “no translation” are not tested in this section.) A priori we assume not to know which transformation model is adequate. Therefore we use the affine transformation model (1) with 𝑢 = 3 ∗ 6 + 12 = 30 model parameters and try to specialize it by applying 𝑚 = 6 constraints (2),(3),(4),(7),(9),(11) as derived above. This yields a total redundancy of 𝑛 − 𝑢 + 𝑚 = 12. Let us start with the case µ𝑡𝑟𝑢𝑒 = 1. Here 𝐻0 : 𝑤 = 0 is true and should be rejected by the multiple test only with probability 𝛼. Observations (14) are generated in two different ways, by adding pseudo random noise according to (13) with 𝑃 = 𝐼 (identity weight matrix), both with 𝜎² = 10−4 and with 𝜎² = 10−2 . From this we compute the test statistics (31),(32) and compare them with their critical values, deciding if 𝐻0 must be rejected or not. In a Monte Carlo approach we repeat this procedure 106 times and compute the relative frequency of 𝐻0 rejected. This value is expected to be equal to 𝛼 because in this simulation we tacitly know that 𝐻0 is in fact true. The results are given in Table 2. It is seen that relative frequencies for normalized LM are a little bit smaller than expected, for studentized LM a little bit larger. There are three potential causes why these relative frequencies are perhaps not exactly equal to 𝛼: 1. 106 repetitions are not enough. This cause can be ruled out by re-starting the procedure with different pseudo random numbers and comparing the results. If the relative frequencies differ from 𝛼 in the same way then 106 repetitions are enough, otherwise the number must be increased.
12
Postprint of Journal of Geodesy (2014) 88(12)1117-1130, DOI:10.1007/s00190-014-0747-3
2. The original model is non-linear, and consequently the distributional results (33a)-(34b) are at best approximately valid. This cause can be ruled out by re-computing with larger 𝜎², which makes the nonlinearity worse. If the relative frequency now differs substantially more from 𝛼 then the linearization is to blame. This can also be done in the reverse direction. 3. When computing the critical values of (31) or (32), the simple portioning of 𝛼 onto the 𝑚 constraints by using 𝛼/𝑚 as significance level is only valid if all 𝑘̂𝑖′ are statistically independent. This is at best approximately true. Although the results in Table 2 have been computed with two different 𝜎² and at this opportunity also with different pseudo random numbers, the deviation from 𝛼 is practically the same. This proves that cause 3 produces the observed effect. However, at least in this small-scale example, the deviations from α seem to be tolerable. Table 1: True coordinates of control points used in section 7 (flattened octahedron)
A B C D E F
𝜉𝑎𝑡𝑟𝑢𝑒 0 0 100 100 71 71
𝜂𝑎𝑡𝑟𝑢𝑒 0 100 100 0 71 71
𝜁𝑎𝑡𝑟𝑢𝑒 0 0 0 0 −ℎ/2 ℎ/2
ζ
F
C
ξ h
D
η B
A E Figure 1: Configuration of control points used in section 7 (flattened octahedron)
13
Postprint of Journal of Geodesy (2014) 88(12)1117-1130, DOI:10.1007/s00190-014-0747-3
Table 2: Various values of the relative frequency of 𝐻0 rejected, when it is true significance level 𝛼 0.01 0.02 0.05 0.10 significance level 𝛼 0.01 0.02 0.05 0.10
critical value for 𝑇5′′ from (33a) with 𝛼/6 3.19 2.98 2.69 2.45 for 𝑇6′′ from (34a) with 𝛼/6 3.80 3.48 3.06 2.73
ℎ=10 ratio of rejected 𝐻0 𝜎² = 10−4 , 𝜎² = 10−2 0.008 0.009 0.017 0.017 0.043 0.043 0.084 0.083 ratio of rejected 𝐻0 𝜎² = 10−4 , 𝜎² = 10−6 0.012 0.013 0.023 0.024 0.055 0.057 0.107 0.108
ℎ=100 ratio of rejected 𝐻0 𝜎² = 10−4 , 𝜎² = 10−2 0.010 0.009 0.019 0.019 0.049 0.048 0.095 0.094 ratio of rejected 𝐻0 𝜎² = 10−4 , 𝜎² = 10−6 0.013 0.013 0.027 0.026 0.064 0.063 0.123 0.122
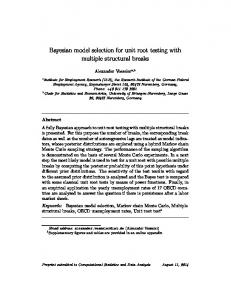
7.2 Null hypothesis is false Next, we consider the case that 𝐻0 is false. The test should now reject 𝐻0 . The ability to reject 𝐻0 when it is false, is known as the power of the test. The power Π is usually smaller, when 𝐻0 is only slightly violated (small true misclosure 𝑤) and larger otherwise. This relationship is called the power function of the test Π(𝑤). More specifically, Π(𝑤) equals the probability that 𝐻0 is rejected by the test as a function of the true misclosure 𝑤. It is computed from the CDF of 𝑇|𝐻𝐴 , see (33b),(34b). Software packages with implemented quantile function of the non-central Student’s t-distribution in (34b) are less widely spread. In MATLAB we find the function nctinv. In our simulation study we are in the position to implement a true misclosure into the model. As a test we implement µ1𝑡𝑟𝑢𝑒 = µ𝑡𝑟𝑢𝑒 = µ𝑡𝑟𝑢𝑒 = µ𝑡𝑟𝑢𝑒 ≠ 1, i.e. a true misclosure 𝑤6 = 3(µ𝑡𝑟𝑢𝑒 )2 − 3 ≠ 0. All other 2 3 constraints remain valid. As a test statistic we again use only the extreme normalized and externally studentized LMs, i.e. we assume not to know which constraint is violated. The results in terms of the two power functions are given in Figure 2. We restrict ourselves to 𝜎² = 10−4 here and to µ𝑡𝑟𝑢𝑒 > 1, i.e. 𝑤6 > 0, because Π(𝑤) does not change when 𝑤 changes sign. Firstly, we observe that the power increases with the significance level 𝛼. This is the typical behavior because a higher 𝛼 means that 𝐻0 is more often rejected and therefore less often falsely accepted. Secondly, we observe that the power increases with the magnitude of the true misclosure |𝑤6 |. This is also expected because a more distinct separation between 𝐻0 and 𝐻𝐴 makes type II decision errors (failures to reject a false 𝐻0 ) less probable. The difference between the power of the test statistics (31),(32) is clearly seen. The normalized LMs require 𝜎² to be known. If 𝜎² is unknown then we must resort to studentized LMs with a significant loss of test power. The reason for this is a typical smearing effect: If constraint (11) is in effect, the inconsistent scales between both coordinate frames are partly interpreted as observation errors, increasing the estimated residuals. In this way the variance factor 𝜎² is mostly overestimated by (𝜎̂ ′′ )². This makes 𝜎̂𝑘̂′′′ 𝑘̂ ′ in (32) too 𝑖 𝑖
large. Consequently, 𝑇6′′ becomes too small, such that it does not exceed its critical value as often as 𝑇5′′ does.
14
Postprint of Journal of Geodesy (2014) 88(12)1117-1130, DOI:10.1007/s00190-014-0747-3
Finally, we see nearly no effect in the power of 𝑇5′′ and 𝑇6′′ , when changing ℎ, and in this way changing the conditioning of the normal system of the GMM. (Note that for ℎ = 0 the system is singular due to a coplanarity of all control points.)
7.3 Using the extreme normalized misclosure as a test statistic Test statistics must not be restricted to likelihood ratios, but could perhaps be defined by plausibility reasoning. See (21) and discussion below. Not uncommon in practical geodesy, such a test statistic could be the extreme normalized or studentized estimated misclosure. In this subsection the extreme normalized estimated misclosure 𝑤 ̂𝑖 𝑇𝑤 ∶= max | | 𝑖=1,…,𝑚 𝜎𝑤 ̂ 𝑖𝑤 ̂𝑖
(36)
is defined as test statistics and will be considered as a substitute for 𝑇5′′ in (31). 𝑇𝑤 uses the estimated misclosures 𝑤 ̂ 𝑖 of the unconstrained solution, which is the affine transformation model (14). A large value of such a test statistic would also indicate an incompatibility of the constraint, for which the maximum in (36) is attained. The critical values of 𝑇𝑤 are the same as of 𝑇5′′ and can be taken from Table 2. The resulting power functions are displayed in Figure 2 and must be compared to that of the test statistic 𝑇5′′ , where 𝜎² has also been used. We see a similar behavior, but recognize a great loss of power, when ℎ is small, i.e. for nearly illconditioned normal systems. Here the misclosure is subject to a smearing effect: Incompatible scales of the coordinate frames produce large magnitudes of misclosures not primarily in 𝑤 ̂6, but the effect also smears over to other misclosures, such that 𝑇𝑤 often falls below the critical value.
15
Postprint of Journal of Geodesy (2014) 88(12)1117-1130, DOI:10.1007/s00190-014-0747-3
Figure 2: Power functions related to the test statistics (31),(32),(36) for the example of section 7
16
Postprint of Journal of Geodesy (2014) 88(12)1117-1130, DOI:10.1007/s00190-014-0747-3
7.4 Identification of the conflicting constraints If the test statistic exceeds the critical value, then we are inclined to reject 𝐻0 . This means that the model of rotation & translation is too special for the description of the relationship between the control points. The next step would be to identify the constraint in conflict with the observations and the rest of the constraints. We can only hope that this is the constraint, for which the maximum in (31),(32) or (36) is attained. Now, we investigate if this is true. Firstly, note that in this respect there is no difference between normalized and studentized LMs (and also not between normalized and studentized misclosures, although the latter values have not been used here). The reason is that these values differ only in the way that 𝜎̂𝑘̂′′′ 𝑘̂′ is computed with the estimated variance 𝑖 𝑖
factor 𝜎̂², while for 𝜎𝑘̂ ′ 𝑘̂ ′ the known value 𝜎² is used. Therefore, normalized and studentized values are 𝑖 𝑖
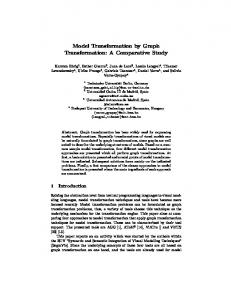
proportional to each other and the maxima in (31) and (32) are attained at the same index 𝑖. Consequently, studentized values are disregarded below. We use the computation of the last section for ℎ = 30 only. The relative frequencies, how often the maxima of (31) and (36) are attained at a certain constraint, are displayed in Figure 3, regardless of their value, i.e. if they exceed any critical value or not. In this way the investigation becomes independent of α. We expect those maxima to be attained mostly at 𝑖 = 6, which is the index of the violated constraint (11). If this violation is only weak, i.e. 1 < µ𝑡𝑟𝑢𝑒 < 1.0001 here, then these maxima are not attained primarily at 𝑖 = 6. But unsurprisingly, the stronger (11) is violated, the more often the maxima are attained at 𝑖 = 6. At a value of µ𝑡𝑟𝑢𝑒 at which 𝐻0 is almost certainly rejected (µ𝑡𝑟𝑢𝑒 > 1.0004), we almost certainly accept the correct 𝐻𝐴 . Comparing left and right part of Figure 3 we see that for LMs we get the correct result more often than for misclosures, which confirms that LMs are the superior test statistics. For 𝑇5′′ the maximum in (31) is oftentimes attained at 𝑖 = 5, such that the constraint (9) is sometimes wrongly identified as conflicting. For misclosures we find wrong identifications in all five other constraints.
Figure 3: Relative frequencies of rejection of a constraint, for which the maximum in (31), left subplot, and (36), right subplot, is attained. Note that the curves for constraints 1-4 are practically overlapping
17
Postprint of Journal of Geodesy (2014) 88(12)1117-1130, DOI:10.1007/s00190-014-0747-3
8 The use of information criteria 8.1 Comparison to Akaike information criterion As an alternative to transformation model selection by hypothesis testing we employ the AICc information criterion as proposed by Felus and Felus (2009). It is defined as (Burnham and Anderson 2002) 𝐴𝐼𝐶𝑐 = 𝑛 ∙ log(WSSR) +
2(𝑢 − 𝑚)𝑛 𝑛−𝑢+𝑚−1
(37)
where as before 𝑛, 𝑚 and 𝑢 are the number of observations, constraints and GMM parameters, respectively, and WSSR is the weighted sum of squared residuals in the GMM. The first summand measures goodness of fit and the second is a penalty term for model complexity. The model with the smallest AICc must be selected. Note that the standard formulae for AIC and AICc do not involve constraints. But it is clear that the number of constraints 𝑚 must be subtracted from the number of parameters 𝑢 to get the number of effective parameters 𝑢 − 𝑚 as a measure of model complexity. We apply this criterion to the example of section 7. Note that AICc and similar criteria do not use a possibly known variance factor 𝜎 2 . Therefore, we can fairly compare AICc only to 𝑇6′′ in (32). In the following we restrict ourselves to AICc computed for
the rotation and translation model, i.e. 𝑚 = 6, denoted as 𝐴𝐼𝐶𝑐(0) all six transformation models with 𝑚 = 5, denoted as 𝐴𝐼𝐶𝑐(1) … 𝐴𝐼𝐶𝑐(6), and the eight parameter transformation model, i.e. 𝑚 = 4, denoted as 𝐴𝐼𝐶𝑐(7), as an example of an, in any case, overfitting model.
First of all, if µ𝑡𝑟𝑢𝑒 = 1 then the rotation and translation is the proper model, and we expect 𝐴𝐼𝐶𝑐(0) < 𝐴𝐼𝐶𝑐(𝑖), 𝑖 > 0 to show this. In the range of 10 < ℎ < 100 this happens with a relative frequency of 0.94…0.95. This can be seen in Figure 4 for ℎ = 30. It means that the AICc effectively relates to a significance level 𝛼 ≈ 0.05 (although it is of course not a hypothesis test). If µ𝑡𝑟𝑢𝑒 ≠ 1 then we expect that 𝐴𝐼𝐶𝑐(6) falls below 𝐴𝐼𝐶𝑐(0). For each model we display the relative frequency of selection according to AICc in Figure 4 together with the relative frequency of selection according to the hypothesis test based on 𝑇6′′ in (32). By 𝑇6′′ (0), 𝑇6′′ (1) … 𝑇6′′ (6) we mean the relative frequencies of selection of the rotation and translation model and the six models with 𝑚 = 5, respectively, analogous to the notation of AICc. First of all, it is striking how close the corresponding curves in Figure 4 are. Thus, AICc almost coincides with 𝑇6′′ at a significance level 𝛼 = 0.05. The small difference is in favor of 𝑇6′′ . (Remember that here 𝑇6′′ (6) selects the appropriate model.) In compliance with the results of section 7.3, the almost only other model with 𝑚 = 5 selected here is the model without constraint (9). It is wrongly selected here, but this happens only in rare cases. It is interesting to note that not only the model selections show equal frequencies in Figure 4, but also coincide very well. For example, for µ𝑡𝑟𝑢𝑒 = 1.0004 the relative frequency of coincident model selections, may be right or wrong, is 0.985. Here we have restricted ourselves to ℎ = 30 because the same figure for ℎ = 10 or ℎ = 100 would be nearly indistinguishable from Figure 4. Summarizing, we can say that model selection by AICc is very much the same as by extreme studentized LMs 𝑇6′′ with significance level 𝛼 = 0.05 here. This is appreciated by users uncertain about the choice of any 𝛼, because AICc does not require such a choice. Also no critical value must be computed. This is welcome, if the distribution of the test statistic is analytically intractable or unknown. On the other hand, if for example a
18
Postprint of Journal of Geodesy (2014) 88(12)1117-1130, DOI:10.1007/s00190-014-0747-3
user wants to have the model with less parameters supported more than AICc does, then she/he cannot simply choose a smaller 𝛼. Possibly, another information criterion like BIC can be employed.
Figure 4: Relative frequencies of selection of a model according to the AICc (37) [solid curves] and the hypothesis test based on extreme studentized LMs 𝑇6′′ (32) with significance level α=0.05 [dotted curves]
8.2 Comparison to Mallows’ Cp Another common information criterion is Mallows’ Cp (Mallows 1973). So far it is less popular in geodesy, at least under this name, but has been employed e.g. by Mahboub (2014). It is derived from an advanced statistic as 𝐶𝑝 =
𝑊𝑆𝑆𝑅 𝑊𝑆𝑆𝑅 − (𝑛 − 2(𝑢 − 𝑚)) = − (𝑛 − 2𝑝) 2 𝜎 𝜎2
(38)
with notation as in (37). In the same way as for AIC and AICc, the standard formula for Cp does not involve constraints. But it is clear that the number of constraints 𝑚 must be subtracted from the number of parameters 𝑢 to get the number of effective parameters 𝑢 − 𝑚, for which often the symbol 𝑝 = 𝑢 − 𝑚 is used. The expectation of 𝐶𝑝 is known to be equal to 𝑝, possibly plus a positive bias term due to lack of fit. Therefore, the model with the smallest value of 𝐶𝑝 , which is somehow close to 𝑝, is selected. Unlike AIC and AICc, Mallows’ Cp is also able to use 𝜎 2 , should it be known. Therefore it is interesting to compare it to 𝑇5′′ in (31). We repeat the computations of the last subsection, coming up with Cp(0)…Cp(7) instead of AICc(0)…AICc(7) and 𝑇5′′ (0) … 𝑇5′′ (6) instead of 𝑇6′′ (0) … 𝑇6′′ (6). To start with, we naively base the model selection on Mallows’ Cp in such a way that each time the model with 𝐶𝑝 closest to 𝑝 is selected. The results are disappointing: For µ𝑡𝑟𝑢𝑒 = 1 Mallows’ Cp selects the correct model only with a relative frequency of 0.06. Instead the overfitting eight parameter transformation model is wrongly selected most often. The reason is that in any case the values of 𝐶𝑝 scatter perfectly around 𝑝, but the overfitting models show smaller scattering, such that there is a bigger chance to get a value of 𝐶𝑝 closer to 𝑝. For µ𝑡𝑟𝑢𝑒 = 1.0004 Mallows’ Cp most often selects the correct model, but by far not as often as the other methods. This shows that it is crucial not to select the model “with 𝐶𝑝 closest to 𝑝”, as done before, but “with the smallest value of 𝐶𝑝 , which is somehow close to 𝑝”. We must therefore define a permissible interval of values close to 𝑝. The disadvantage is that it may happen that none of the values of 𝐶𝑝 falls into this interval.
19
Postprint of Journal of Geodesy (2014) 88(12)1117-1130, DOI:10.1007/s00190-014-0747-3
Some investigation using the numerical example at hand shows that the interval [𝑝 − 7, 𝑝 + 7] is optimal. It is the smallest interval, which ensures that with a relative frequency of 0.95 at least one 𝐶𝑝 is permissible. It is therefore used below. The results are displayed in Figure 5. While model selection based on 𝑇5′′ shows almost the same, but slightly superior results as on 𝑇6′′ (compare with Figure 4), the results with Mallows’ Cp are worse. For µ𝑡𝑟𝑢𝑒 = 1 Mallows’ Cp selects the correct model only with a relative frequency of 0.87 (curve Cp(0) in Figure 5). This is much better than in the naïve approach, but not as good as for the other methods. The latter also applies to the cases with µ𝑡𝑟𝑢𝑒 > 1: For example, for µ𝑡𝑟𝑢𝑒 = 1.0004 Mallows’ Cp selects the correct model only in one out of two cases (curve Cp(6) in Figure 5). In one out of three cases constraint (9) is wrongly identified as conflicting (curve Cp(5) in Figure 5). This shows that Mallows’ Cp is not a good alternative to multiple hypotheses testing. One reason could be that here 𝑝 = 𝑢 − 𝑚 is not varying much, only from 24 to 26. Therefore, Mallows’ Cp may be tried again in cases where in one system all coordinates of control points are considered as error-free quantities, such that 𝑝 = 𝑢 − 𝑚 shows a stronger relative variation, here from 6 to 8.
Figure 5: Relative frequencies of selection of a model according to Mallows’ Cp (38) [solid curves] and the hypothesis test based on extreme normalized LMs 𝑇5′′ (31) with significance level α=0.05 [dotted curves]
9 Conclusions In geodesy we oftentimes need to transform points between two different coordinate frames. We are routinely faced with the situation that we do not know which transformation model should be selected. It is good tradition in geodesy to base such a decision on a statistical hypothesis test. If we consider more than two models then the test must be a multiple hypotheses test. It is often not possible to simply test the significance of parameters because all considered models may have a different set of parameters. For example, there is no natural implementation of a scale parameter into the spatial affine transformation. Therefore, it is better to start with a general transformation model and try to specialize it by adding constraints. The compatibility of those constraints needs to be tested. Such a test can be intuitively based on the estimated misclosures of the constraints in the unconstrained model. From (Lehmann and Neitzel 2013) we know that better test statistics should be based on the Lagrange multipliers (LMs, also known as correlates in geodesy) of the constrained solution. They should assume the form of
20
Postprint of Journal of Geodesy (2014) 88(12)1117-1130, DOI:10.1007/s00190-014-0747-3
either the extreme normalized or the extreme externally studentized LM. The second test statistic comes into effect if the a priori variance factor is unknown. We worked out an example of a 3D coordinate transformation based on six control points. Here it is shown that the LM-based test statistics have more statistical power than those based on the estimated misclosures. This advantage is most drastic if the configuration of the control points is poor. Moreover, in a multiple test the test statistics based on LMs more often identify the correct alternative model. They can be recommended, not only to problems with transformations, but to all geodetic adjustment problems posed as a Gauss Markov models with constraints. For transformation model selection the AICc and Mallows’ Cp are considered as an alternative to the multiple hypotheses test. It turns out that in the exemplary case the AICc almost always selects the same model as the extreme externally studentized LM does. This is remarkable because the theoretical background is different. Mallows’ Cp was also successfully applied, but here the results are inferior to the other methods. This may be due to the fact that there is only a small difference in the number of parameters of the models to be selected.
References Akaike H (1974) A New Look at the Statistical Model Identification. IEEE Transactions on Automatic Control, 19:716-723.
Andrei CO (2006) 3D affine coordinate transformations. Masters of Science Thesis in Geodesy No. 3091. School of Architecture and the Built Environment Royal Institute of Technology (KTH) Stockholm, Sweden Burnham KP, Anderson DR (2002) Model Selection and Multimodel Inference: A Practical-Theoretic Approach, 2nd ed., Springer New York, ISBN 0-387-95364-7 Carosio A, Piras M, Salvini D (2006) The Forward Search Method Applied to Geodetic Transformations. Studies in Classification, Data Analysis, and Knowledge Organization, 2006, Part III, 181-188. DOI 10.1007/3-540-35978-8_21 Deakin RE (1998) 3D coordinate transformations. Surveying and Land Information Systems 58(4):223-234 Deakin RE (2007) Coordinate Transformations for Cadstral Surveying. School of Mathematical and Geospatial Sciences, RMIT University, pp 1-33 Donato G, Belongie S (2002) Approximate Thin Plate Spline Mappings. Lecture Notes in Computer Science 2352, Springer Berlin Heidelberg pp 21-31. DOI 10.1007/3-540-47977-5_2 Felus YA, Felus M (2009) On Choosing the Right Coordinate Transformation Method. Proc FIG Working Week 2009: Surveyors Key Role in Accelerated Development. Eilat, Israel, 3-8 May 2009 Ge Y, Yuan Y, Jia N (2013) More efficient methods among commonly used robust estimation methods for GPS coordinate transformation. Survey Review 45(330):229-234. DOI 10.1179/1752270612Y.0000000028 Goktepe A, Kocaman E (2010) Analysis of camera calibrations using direct linear transformation and bundle adjustment methods. Scientific Research and Essays 5(9):869-872 Kampmann G (1996) New Adjustment Techniques for the Determination of Transformation Parameters for Cadastral and Engineering Purposes. Geomatica 50(1):27-34
21
Postprint of Journal of Geodesy (2014) 88(12)1117-1130, DOI:10.1007/s00190-014-0747-3
Kanani E (2000) Robust Estimators for Geodetic Transformations and GIS. PhD thesis, Institut für Geodäsie und Photogrammetrie, ETH Zürich Kargoll B (2012) On the Theory and Application of Model Misspecification Tests in Geodesy. Deutsche Geodätsche Kommission Reihe C, Nr. 674, München Koch KR (1999) Parameter Estimation and Hypothesis Testing in Linear Models. 2nd ed., Springer Berlin. ISBN 978-3-662-03976-2 Lehmann R (2010) Im Schwerpunkt der Anschlusspunkte – Zur Genauigkeit geodätischer Koordinatentransformationen (In the barycentre of the control points – on the accuracy of geodetic coordinate transformations). Allgemeine Vermessungsnachrichten 4/2010. VDE-Verlag Offenbach Lehmann R (2012) Improved critical values for extreme normalized and studentized residuals in GaussMarkov models. J Geod 86(12):1137–1146 Lehmann R, Neitzel F (2013) Testing the compatibility of constraints for parameters of a geodetic adjustment model. J Geod 87: 555-566. DOI 10.1007/s00190-013-0627-2 Lippus J (2004) Transformation of coordinates using piecewise conformal mapping. Journal of Geodesy, 78(12):40-46. DOI 10.1007/s00190-003-0364-z Mahboub V (2012) On weighted total least-squares for geodetic transformations. J Geod 86(5):359-367. DOI 10.1007/s00190-011-0524-5 Mahboub V (2014) Variance component estimation in errors-invariables models and a rigorous total least squares approach. Stud. Geophys. Geod. 58 (2014), 17-40, DOI: 10.1007/s11200-013-1150-x Mallows CL (1973) Some Comments on CP. Technometrics 15(4):661-675. DOI 10.2307/1267380 Miller RG (1981) Simultaneous statistical inference. Springer-Verlag New York Inc. ISBN 0-387-90548-0 Neyman J, Pearson ES (1933) On the Problem of the Most Efficient Tests of Statistical Hypotheses. Philosophical Transactions of the Royal Society A: Mathematical, Physical and Engineering Sciences 231(694–706):289–337. DOI:10.1098/rsta.1933.0009 Neitzel F (2010) Generalization of total least-squares on example of unweighted and weighted 2D similarity transformation. Journal of Geodesy 84(12):751-762. DOI 10.1007/s00190-010-0408-0 Schaffrin B, Felus YA (2008) On the multivariate total least-squares approach to empirical coordinate transformations. Three algorithms. J Geod 82(6):373-383. DOI 10.1007/s00190-007-0186-5 Tanizaki H (2004) Computational Methods in Statistics and Econometrics. Marcel Dekker New York. ISBN-13: 978-0824748043 Teunissen PJG (1985) Quality control in geodetic networks. In: E.W. Grafarend and F. Sanso (eds.) Optimization and Design of Geodetic Networks, pp 526–547, Springer Berlin Heidelberg New York Teunissen PJG (2000) Testing theory; an introduction. Series on mathematical geodesy and positioning, 2nd ed., Delft University of Technology, The Netherlands. ISBN 90-407-1975-6 Zhang P, Xu C, Hu C, Chen Y (2012) Coordinate transformations in satellite navigation systems. In Advances in Electronic Engineering, Communication and Management Vol. 2 pp 249-257, Springer Berlin Heidelberg. DOI 10.1007/978-3-642-27296-7_40 Ziggah YY, Youjian H, Amans ChO, Fan DL (2013) Determination of GPS Coordinate Transformation Parameters of Geodetic Data Between Reference Datums-A Case Study of Ghana Geodetic Reference Network. International Journal of Engineering Sciences & Research Technology 2(4):956-971
22
Postprint of Journal of Geodesy (2014) 88(12)1117-1130, DOI:10.1007/s00190-014-0747-3