International Journal of
Molecular Sciences Article
Transgenic Strategies for Sparse but Strong Expression of Genetically Encoded Voltage and Calcium Indicators Chenchen Song 1 , Quyen B. Do 1 , Srdjan D. Antic 2 and Thomas Knöpfel 1,3, * 1 2 3
*
Laboratory for Neuronal Circuit Dynamics, Imperial College London, London W12 0NN, UK;
[email protected] (C.S.);
[email protected] (Q.B.D.) Institute for Systems Genomics, Stem Cell Institute, UConn Health, Farmington, CT 06030-3401, USA;
[email protected] Centre for Neurotechnology, Institute of Biomedical Engineering, Imperial College London, London SW7 2AZ, UK Correspondence:
[email protected]; Tel.: +44-(0)-207-594-6898
Received: 15 June 2017; Accepted: 4 July 2017; Published: 7 July 2017
Abstract: Rapidly progressing development of optogenetic tools, particularly genetically encoded optical indicators, enables monitoring activities of neuronal circuits of identified cell populations in longitudinal in vivo studies. Recently developed advanced transgenic approaches achieve high levels of indicator expression. However, targeting non-sparse cell populations leads to dense expression patterns such that optical signals from neuronal processes cannot be allocated to individual neurons. This issue is particularly pertinent for the use of genetically encoded voltage indicators whose membrane-delimited signals arise largely from the neuropil where dendritic and axonal membranes of many cells intermingle. Here we address this need for sparse but strong expression of genetically encoded optical indicators using a titratable recombination-activated transgene transcription to achieve a Golgi staining-type indicator expression pattern in vivo. Using different transgenic strategies, we also illustrate that co-expression of genetically encoded voltage and calcium indicators can be achieved in vivo for studying neuronal circuit input–output relationships. Keywords: genetically encoded; voltage indicator; intersectional; transgenic; inducible expression; controlled recombination
1. Introduction To understand the dynamic interactions of neuronal circuits, covering large neuronal populations across multiple spatially distant brain regions, is a key focus in systems neuroscience. Recent progress in genetically encoded voltage and calcium indicators (GEVIs and GECIs respectively) now provides powerful tools toward this goal by allowing longitudinal monitoring from the same neuronal populations of defined cell classes [1–5]. GECIs (e.g., GCaMPs) have now been employed as a mainstream tool in systems neuroscience, yet calcium imaging provides only a surrogate and incomplete readout of neuronal activity. In contrast, by directly monitoring changes in membrane potential, GEVIs provide unparalleled opportunity to directly readout neuronal activity, including subthreshold fluctuations and hyperpolarisation. Developments in the generation of Cre-dependent transgenic mice provides genetic approaches that achieve strong, cell type-specific expression of optical indicators in the mammalian brain, while bypassing the limitations of invasive gene expression techniques like electroporation and viral injections [6,7]. In combination with the use of the very strong tetracycline-responsive promoter element (TRE), modular intersectional transgenic strategies have been developed to achieve optimal cell class-specific indicator expression patterns [8]. Int. J. Mol. Sci. 2017, 18, 1461; doi:10.3390/ijms18071461
www.mdpi.com/journal/ijms
Int. J. Mol. Sci. 2017, 18, 1461
2 of 11
GECIs can be targeted cytosolically to report changes in intracellular calcium concentrations, and since cell bodies contribute to a large fraction of the cytosol, GECI signals predominantly appear as “sparkling” cell bodies. GECI signals from dendrites and axons (“neuropil signals”) are often left unconsidered in densely labelled tissue, as they cannot be easily allocated to individual neurons. In contrast, GEVI expression needs to be strictly targeted to the plasma membrane to sense transmembrane voltage transients, and because membrane of the soma is only a small fraction of total membrane, the membrane-limited signals of GEVIs arise predominantly from dendritic and axonal membranes. For this reason, it is very difficult to attribute optical voltage signals from intermingled processes of many neurons to individual neurons. This problem could be resolved to facilitate single-cell resolution voltage imaging by targeting GEVIs sparsely to only a fraction of the neuronal population of interest. Conceptually, the idea of sparse cellular indicator expression bears resemblance to Golgi staining; a prime histological technique for resolving and segregating individual cells and their processes in a densely populated neuronal network. To achieve a strong cell class-specific but sparse expression of GECIs and GEVIs, we took advantage of the recently developed strategy to control Cre-dependent recombination via the use of a destabilized Cre variant, dCre [6]. This modified recombinase can be stabilized (that is, “de-destabilized”) using the antibiotic trimethoprim (TMP) that has no natural targets in mammals and penetrates the blood brain barrier [9]. Using a mouse line that expresses dCre under Rasgrf2A promoter [6], here we show that titratable recombination probability can be used to achieve strong intensity, but sparsely distributed (Golgi staining-like) indicator expression pattern in cortical layer II/III pyramidal neurons with either GCaMP6f (GECI) [10] or the voltage sensitive fluorescent protein (VSFP) VSFP Butterfly 1.2 (GEVI) [11,12]. The GEVIs used in the present study (from the Förster resonance energy transfer (FRET)-based VSFP Butterfly family containing mCitrine and mKate2 fluorescent protein pair) emit at two wavelengths. The signals in both wavelength bands can be spectrally deconvoluted from the GFP signals of GCaMP6f. We also show that, using these fluorescent proteins, the modular transgenic approach produced dual GEVI/GECI neuronal labelling, shown here in cortical layer II/III pyramidal neurons, which will allow monitoring of concurrent voltage and calcium activity in either the same neuron or in neighbouring neurons. 2. Results 2.1. TMP Dose-Dependent Control of dCre-Mediated Recombination We used a mouse line that carries a transgene cassette where dCre is under transcriptional control of the Rasgrf2 promoter that drives gene transcription in layer II/III neurons [6,13]. These mice were crossed with two mouse lines that carry (i) an expression cassette where the coding sequences for the GECI GCaMP6f is under transcriptional control of both Cre and tTA [8,14], and (ii) a cassette where expression of tTA is driven by the CaMK2A promoter [14]. In the presence of Cre-mediated recombination, these mice express GCaMP6f in layer II/III pyramidal cells [8]. In the absence of TMP treatment, dCre is degraded and Cre-mediated recombination prevented [9]. In the presence of increasing doses of TMP, increasing amounts of dCre are de-destabilised and are available to excise a STOP codon to permit tTA-activated transcription of the GCaMP6f gene (Figure 1a). To test the control of indicator expression probability, animals were treated with different total doses of TMP ranging from 0.005 mg/kg body weight (single intraperitoneal injection) to 750 mg/kg body weight (three daily injections of 250 mg/kg for saturating expression levels). We initially treated animals with total TMP doses of 50, 5 and 0.5 mg/kg body weight (all single injections), and examined indicator expression after a two-week expression period. We observed comparable densities of expressing cells between 50 mg/kg and saturating 750 mg/kg body weight TMP administration (Figure 1(b-i); wide-field epifluorescence microscopy). Surprisingly, the lowest TMP dose used in this
Int. J. Mol. Sci. 2017, 18, 1461 Int. J. Mol. Sci. 2017, 18, 1461
3 of 11
3 of 10
(Figure 1(bi); wide-field epifluorescence microscopy). Surprisingly, the lowest TMP dose used in this initial set of experiments (0.5 mg/kg body weight; Figure 1(b-ii); confocal microscopy) still induced initial set of experiments (0.5 mg/kg body weight; Figure 1(bii); confocal microscopy) still induced indicator expression in the majority of the layer II/III pyramidal cell population (with the expected indicator expression in the majority of the layer II/III pyramidal cell population (with the expected density ofof layer II/III derived from frompublished publishedCUX1 CUX1expression expression patterns [15]). density layer II/IIIpyramidal pyramidal neurons neurons derived patterns [15]).
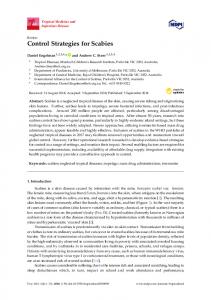
Figure 1. Representative images of adjusted GECI expression probability of layer II/III pyramidal Figure 1. Representative images of adjusted GECI expression probability of layer II/III pyramidal neurons achieved via dose-dependent TMP administration. (a) Transgenic strategy using the neurons achieved via dose-dependent TMP administration. (a) Transgenic strategy using the combination of both Cre-recombinase and transactivator intersectionally controls indicator combination of both Cre-recombinase and transactivator intersectionally controls indicator expression expression in identified cell populations in Ai93 GCaMP6f indicator transgenic mice. The transgenic in strategy identified cellhere populations in Ai93 form GCaMP6f indicator transgenic The promoter transgenic shown uses a destabilized of Cre-recombinase driven bymice. Rasgrf2-2A strategy shown here uses a destabilized form of Cre-recombinase driven by Rasgrf2-2A promoter (Rasgrf2-2A-dCre) that can be “de-destabilized” using TMP to remove the STOP cassette in layer II/III (Rasgrf2-2A-dCre) that can be “de-destabilized” using TMP to remove the STOP cassette in layer neurons. Transactivator expression driven by CaMK2A promoter (CaMK2A-tTA) in pyramidal II/III neurons. Transactivator expression driven by CaMK2A promoter (CaMK2A-tTA) in pyramidal neurons is also required for binding to the TRE promoter in the indicator mice for indicator expression neurons is alsoinrequired for binding to the TRE in the indicator expression (GCaMP6f this transgenic diagram). This promoter combination of indicator dCre andmice tTA for facilitates adjustable (GCaMP6f in this transgenic diagram). This combination of dCre and tTA facilitates adjustable indicator indicator expression probability of layer II/III pyramidal neurons by titratable TMP administration expression probability of layer II/III pyramidal neurons by titratable administration (b) GCaMP6f (b) GCaMP6f expression density remained high with total TMP doseTMP administered at 50 mg/kg body expression remained high epifluorescence with total TMPmicroscopy; dose administered at 50 mg/kg body weight weight (i; density imaged using wide-field solid line marks the pia, dashed line (i, marks imaged using layer wide-field epifluorescence microscopy; solid(ii; lineusing marks the pia, dashed line marks cortical boundaries) and 0.5 mg/kg body weight confocal microscopy, single plane)layer (c) GCaMP6f expression totalbody TMP weight dose administered at 0.005 microscopy, mg/kg body single weightplane) (i), cortical boundaries) and 0.5with mg/kg (ii, using confocal mg/kg expression body weightwith (ii), total and 750 mg/kg weight (iii) resulted in0.03 different (c)0.03 GCaMP6f TMP dosebody administered at TMP 0.005concentrations mg/kg body weight (i), mg/kg levels of GCaMP6f density microscopy). DAPI nuclei-counterstaining shows, in of body weight (ii), andexpression 750 mg/kg body (confocal weight (iii) TMP concentrations resulted in different levels addition to pyramidal neurons, dense cell population including glia, GABAergic interneurons and GCaMP6f expression density (confocal microscopy). DAPI nuclei-counterstaining shows, in addition vessel-related cells. Scalecell barpopulation = 50 µm; stack thicknessglia, = 15GABAergic µm. to blood pyramidal neurons, dense including interneurons and blood vessel-related cells. Scale bar = 50 µm; stack thickness = 15 µm.
Int. J. Mol. Sci. 2017, 18, 1461
4 of 11
These initial results suggested that a TMP dose much lower than 0.5 mg/kg is needed to achieve desirable sparse Golgi-like indicator expression. We therefore administered total TMP dosages ranging from 0.005 to 0.05 mg/kg body weight (distributed over 1–2 injections per animal), and analysed the density of indicator expressing cells with confocal microscopy 1–3 weeks thereafter. In this set of experiments we also counterstained with DAPI, a fluorescent marker of cell nuclei. Notably, DAPI-stained nuclei include, in addition to those representing pyramidal cells, also those of GABAergic cells, glia cells and blood vessel-related cells. We therefore counted the indicator-expressing cells, normalized on the total count of nuclei and then scaled to the maximal density of layer II/III pyramidal cells that expressed the indicator under control of the stabilised Rasgrf2-dCRE gene product. We refer to this value as “scaled expression probability”. In this dose range, the fraction of layer II/III pyramidal cells that expressed the indicator increased with increasing total TMP dosage administered (Figure 1(c-i–iii), Table 1). Table 1. Titrated indicator expression probabilities. (TMP) (mg/kg Body Weight)
No. of Animals
Total No. of Sections
Expressing Cells/All Nuclei
Scaled Expression Probability
750 0.03 0.005 0.001
5 5 2 2
25 25 10 4
25.29 ± 1.88% 20.02 ± 0.83% 15.68 ± 2.63% 4.51 ± 1.06%
1.00 0.79 0.62 0.18
The indicator expression levels did not depend on the fraction of expressing cells because recombination is “all or not at all” at the level of individual cells, while expression levels are controlled by the strong TRE promoter. We also explored expression durations longer than two weeks and TMP administration in older animals (aged 3–6 months) and did not find overt differences compared to our standard induction age of six weeks and two weeks of expression time at similar total TMP doses administered (data not shown). Similar TMP dose-dependent indicator expression was obtained with GEVI mice under the same transgenic configuration, where the Ai93 transgenic line was replaced by the Ai78 transgenic line such that Cre-mediated recombination leads to expression of the GEVI VSFP Butterfly 1.2, also in layer II/III pyramidal population. 2.2. Sparse Expression of GEVI Uncovers the Morphologies of Individual Cells With VSFP Butterfly 1.2 or chimeric VSFP Butterfly expression in all cortical pyramidal cells, individual neurons could not be resolved due to intermingled neuronal processes (Figure 2a). Using the genetic approach described above (Figure 1a) along with a low dose of TMP for limited Cre-dependent recombination, strong Golgi staining-like GEVI expression was achieved (Figure 2(b-i)) and this sparse expression allowed resolving morphological details of individual cells. In single confocal planes, subcellular structures can also be clearly resolved, including axonal boutons and dendritic spines (Figure 2(b-ii)). 2.3. Modular Transgenic Strategies Allow Controlled Co-Expression of GECI and GEVI Next, we expanded the above-described genetic approach to develop strategies for controlled expression of both a GECI and a GEVI in the same animal. To this end, we generated quadruple transgenic mice carrying both the GCaMP6f and the VSFP Butterfly 1.2 genes, and expression of both indicator proteins in layer II/III pyramidal neurons was under the control of inducible dCre and transactivator (Rasgrf2-dCre;CaMK2A-tTA;Ai78;Ai93, Figure 3a). Induction using titrated TMP dose resulted in observable sparse indicator expression, with subpopulations of layer II/III pyramidal neurons expressing either GCaMP6f (Figure 3(b-i)) or VSFP Butterfly 1.2 (Figure 3(b-ii)), and an overlapping sub-population co-expressing GCaMP6f and VSFP Butterfly 1.2 (Figure 3b; dotted box outlines an example neuron).
Int. J. Mol. Sci. 2017, 18, 1461
Int. J. Mol. Sci. 2017, 18, 1461 Int. J. Mol. Sci. 2017, 18, 1461
5 of 11
5 of 10 5 of 10
Figure 2. 2.Sparse GEVI expression in resolves subcellular structures. structures.(a)(a)AtAtfull fullexpression expression Figure Sparse GEVI expression in vivo vivo resolves subcellular Figure 2. Sparse GEVI expression in vivo resolves subcellular structures. (a) At full expression density, density, GEVI optical signals are difficult to to individual individualneurons neuronsdue duetoto intermingled density, GEVI optical areto difficult to be assigned assigned to intermingled GEVI optical signals aresignals difficult be assigned to individual neurons due to intermingled neuronal neuronal inindense Sparse Golgi staining-like staining-likeGEVI GEVIexpression expression density neuronalprocesses densepopulations. populations. (b) Sparse Golgi processes inprocesses dense populations. (b) Sparse(b)Golgi staining-like GEVI expression densitydensity resolves resolves singlecells cellsand andsubcellular subcellular morphologies morphologies (i) individual resolves single (i) A A 15 15 µm µmstack stackprojection projectionofofthree three individual single cells and subcellular morphologies (i) A 15 µm stack projection of three individual layer II/III layer II/III pyramidalneurons. neurons.(ii) (ii)Single-plane Single-plane image image from stack inin(bi). GEVI achieves layer II/III pyramidal fromthe the(b-i). stackGEVI (bi). GEVItargeting targeting pyramidal neurons. (ii) Single-plane image from the stack in targeting achievesachieves optimal optimal membrane expression, and is capable of resolving subcellular structures in vivo, including optimal membrane expression, and is capable resolving subcellular structures vivo, including membrane expression, and is capable of resolving subcellular structures in vivo,in including axonal axonal boutons (blueinset) inset)and anddendritic dendritic spines spines (white (white inset). Image scale bar = 5050 µm; inset scale barbar axonal boutons (blue inset).scale Image µm; inset boutons (blue inset) and dendritic spines (white inset). Image barscale = 50 bar µm;=inset scale barscale = 2 µm. 2 µm. = 2=µm.
Figure 3. Dual-controlled co-expression of GECI (GCaMP6f) and GEVI (VSFP Butterfly 1.2) in Figure 3. Dual-controlled co-expression of GECI (GCaMP6f) and GEVI (VSFP Butterfly 1.2) somatosensory cortical layer II/III pyramidal neurons in vivo. (a) The combination of dCre and tTA Figure 3. Dual-controlled co-expression of GECI neurons (GCaMP6f) and GEVI (VSFP Butterflyof1.2) in in somatosensory cortical layer II/III pyramidal in vivo. (a) The combination dCre allows for dual control of Ai78 VSFP Butterfly 1.2 and Ai93 GCaMP6f expression probabilities. This somatosensory cortical layer II/III pyramidal neurons in vivo. (a) The combination of dCre and tTA and tTA allows for dual controlin of GECI-expressing, Ai78 VSFP Butterfly 1.2 and Ai93 GCaMP6f expression probabilities. transgenic strategy resulted GEVI-expressing and GECI/GEVI co-expressing allows for dual strategy control of Ai78 VSFP Butterfly 1.2 and Ai93 GCaMP6fand expression probabilities. This This transgenic resulted in GECI-expressing, GEVI-expressing GECI/GEVI co-expressing populations. (bi) Strong GCaMP6f fluorescence signal observed in perisomatic regions of individual transgenic strategy resulted in GECI-expressing, GEVI-expressing and GECI/GEVI co-expressing populations. (b-i) Strong GCaMP6f fluorescence signal observed in perisomatic regions of individual pyramidal neurons. (ii) Strong VSFP Butterfly 1.2 fluorescence signal observed in the membranes of populations. (bi) Strong fluorescence signal observed in perisomatic individual pyramidal neurons. (ii) GCaMP6f Strong VSFP Butterfly 1.2GCaMP6f fluorescence signal in theofmembranes two pyramidal neurons (arrows). (biii) Merged (green) andobserved VSFP regions Butterfly 1.2 (red) pyramidal neurons. (ii) Strong VSFP Butterfly 1.2 fluorescence signal observed in the membranes of of fluorescence two pyramidal neurons (arrows). (b-iii) Merged GCaMP6f (green) and VSFP Butterfly 1.2 (red) signals on DAPI nuclei counterstaining (blue) showing sparse Golgi staining-like two pyramidal neurons (arrows). (biii) Mergedconfocal GCaMP6f (green) VSFP Butterflyneuron, 1.2 (red) fluorescence signals onpattern. DAPI nuclei (blue) showing Golgi staining-like indicator indicator expression Inset:counterstaining a single-plane image ofsparse the and indicator-expressing fluorescence signals on box DAPI nuclei counterstaining (blue) showingtargeting. sparse Golgi staining-like expression pattern. Inset: a single-plane confocal image of the indicator-expressing neuron, outlined outlined by the dotted in (bii), showing optimal GEVI membrane Note this cell coindicator expression Inset: a optimal single-plane confocal image of the indicator-expressing neuron, by the dotted box in pattern. (b-ii), showing GEVI membrane targeting. Note this cell co-expresses expresses GCaMP6f and VSFP Butterfly 1.2. Scale bar = 50 µm. outlined by theVSFP dotted box in1.2. (bii), showing optimal GCaMP6f and Butterfly Scale bar = 50 µm. GEVI membrane targeting. Note this cell coexpresses GCaMP6f and VSFP Butterfly 1.2. Scale bar = 50 µm.
Int. J. Mol. Sci. 2017, 18, 1461 Int. J. Mol. Sci. 2017, 18, 1461
6 of 11 6 of 10
A second quadruple transgenic combination was generated for controlled GCaMP6f expression in A pyramidal second quadruple transgenic combination generatedoffor GCaMP6f expression layer II/III neurons in combination withwas expression thecontrolled GEVI chimeric VSFP Butterfly in in layer II/III pyramidal neurons in combination with expression of the GEVI chimeric VSFP Butterfly all pyramidal neurons across all cortical layers. For this transgenic strategy, we crossed-in a line where in allVSFP pyramidal neurons across alliscortical For this control transgenic strategy, crossed-in a line chimeric Butterfly expression under layers. the exclusive of the TRE we element (Rasgrf2-dCre; where chimeric VSFP Butterfly expression is under the exclusive control of the TRE element (Rasgrf2CaMK2A-tTA; chiVSFP; Ai93; Figure 4a). Our TMP induction protocol achieved sparse GCaMP6f dCre; CaMK2A-tTA; chiVSFP; Ai93; Figure 4a). Our TMP induction protocol achieved sparse expression in layer II/III pyramidal neurons (Figure 4(b-i,ii)), while the chimeric VSFP Butterfly voltage GCaMP6f expression in layer II/III pyramidal neurons (Figure 4(bi,ii)), while the chimeric VSFP indicator displayed a dense expression pattern (Figure 4(b-ii,iii)). Butterfly voltage indicator displayed a dense expression pattern (Figure 4(bii,iii)).
Figure 4. Expression of genetically encoded voltage indicator (chimeric VSFP Butterfly) in all cortical
Figure 4. Expression genetically voltageofindicator (chimeric Butterfly) pyramidal neurons ofwith controlledencoded co-expression genetically encoded VSFP calcium indicatorin all cortical pyramidal neurons controlled co-expression encoded indicator (GCaMP6f) in layer II/IIIwith pyramidal neurons in vivo. (a)ofAgenetically transactivator, drivencalcium by CaMK2A (GCaMP6f) in layer II/III pyramidal neurons in vivo.is (a) A transactivator, CaMK2A promoter (CaMK2A-tTA) in pyramidal neurons, required for bindingdriven to the by TRE promoterpromoter for transcriptioninactivation in both chimeric VSFP Butterfly and Ai93 indicator mice. A STOP cassette (CaMK2A-tTA) pyramidal neurons, is required for binding to the TRE promoter for transcription removal TMP-stabilized driven by Rasgrf2-2A activation in using both chimeric VSFPCre-recombinase Butterfly and Ai93 indicator mice.promoter A STOP(Rasgrf2-2A-dCre) cassette removalisusing only neededCre-recombinase for the Ai93 line.driven This quadruple transgenic strategy therefore achieves isfull GEVI TMP-stabilized by Rasgrf2-2A promoter (Rasgrf2-2A-dCre) only needed expression in all pyramidal neurons, with TMP dose-dependent adjustable GECI co-expression for the Ai93 line. This quadruple transgenic strategy therefore achieves full GEVI expressioninin all layer II/III pyramidal neurons (bi) Strong GCaMP6f fluorescence signal observed in perisomatic pyramidal neurons, with TMP dose-dependent adjustable GECI co-expression in layer II/III pyramidal regions of individual pyramidal neurons (bii) A single confocal plane image showing strong chimeric neurons (b-i) Strong GCaMP6f fluorescence signal observed in perisomatic regions of individual VSFP Butterfly fluorescence signal from pyramidal neurons observed across all cortical layers (biii) pyramidal neurons (b-ii) A single confocal plane image showing strong chimeric VSFP Butterfly Merged GCaMP6f (green) and chimeric VSFP Butterfly (red) fluorescence signals showing adjustable fluorescence signal from pyramidal observed across allpatterns. cortical Scale layersbar (b-iii) Merged GCaMP6f sparse GECI indicator expressionneurons over dense GEVI expression = 50 µm. (green) and chimeric VSFP Butterfly (red) fluorescence signals showing adjustable sparse GECI indicator expression over dense GEVI expression patterns. Scale bar = 50 µm. 3. Discussion
Using a trimethoprim-inducible Cre-mediated activation of transcription under a strong TRE
3. Discussion promoter, we attained controlled, sparse and strong Golgi staining-like expression of genetically
encoded voltage and calcium indicators in vivo (Figure 1c). The expression is termed Using a trimethoprim-inducible Cre-mediated activation of transcription under a“strong” strong TRE because the expression level in individual cells is high, and it is termed “sparse” because only a few promoter, we attained controlled, sparse and strong Golgi staining-like expression of genetically cells express the fluorescent indicator. Sparse and strong GEVI expression allowed resolving encoded voltage and calcium indicators in vivo (Figure 1c). The expression is termed “strong” morphologies of individual neurons and subcellular structures—including axonal boutons and because the expression in individual is high, and it isBytermed “sparse”transgenic because only dendritic spines—in level the mammalian braincells in vivo (Figure 2bii). using different a fewcombinations, cells expresswe the fluorescent indicator. Sparse and strong GEVI expression allowed resolving also demonstrate that GEVI/GECI co-expression can be achieved in vivo, resulting morphologies of individual neurons and subcellular structures—including axonal boutons and dendritic spines—in the mammalian brain in vivo (Figure 2b-ii). By using different transgenic
Int. J. Mol. Sci. 2017, 18, 1461
7 of 11
combinations, we also demonstrate that GEVI/GECI co-expression can be achieved in vivo, resulting in GEVI-expressing, GECI-expressing, and GEVI/GECI co-expressing populations in the same animal (Figure 3b-iii). Indicator-expressing neurons are a subpopulation within the population defined by the cell-class specific promotor, and we assume that recombination within the transgene does not affect the identity of the neuron or neuronal response properties [8,11,12]. 3.1. GEVI and GECI Transgenic Approach Until recently, in vivo application of GECIs and GEVIs was obtained using gene delivery techniques based on in utero electroporation or viruses [11,16–20]. Compared to these approaches, transgenic strategies achieve more reliable, reproducible, yet strong indicator expression patterns in the mammalian brain with minimal invasiveness [8,21], and allow for more stringent targeting of specific cell classes, as well as temporal and functional control of labelling [22]. In contrast to voltage sensitive dye (VSD) imaging and viral approaches that involve craniotomies for dye and gene delivery, the GEVI-based transgenic approach, when combined with thin-cranium mice, permits transcranial imaging through a fully intact skull for longitudinal studies of mammalian behaviour [4,8,11,23,24]. Moreover, the growing available palette of Cre driver lines and tetracycline transactivator system allows for intersectional transgenic approach for specific restricted expression patterns in vivo to achieve a reliable modular experimental strategy [6,25,26]. Rapid progress in the development of GEVIs and GECIs fuels the deciphering of neuronal circuit dynamics in systems neuroscience. GEVIs in particular permit the direct monitoring of cellular electrical activity, providing additional information on subthreshold activity, hyperpolarising events, and high frequency oscillatory activity at the population level of one specific cell type, and across spatially distributed populations of neurons [27,28]. This approach was explored in the past using classic VSDs injected into individual neurons [2,29]. The sparse GEVI expression protocol further advances the optical voltage monitoring approach by enabling cell class-specific voltage imaging at multiple single-cell resolution in vitro and in vivo. 3.2. Sparse Strong GEVI Expression Resolves Individual Cells and Subcellular Structures The recent generation of GEVIs exhibit response dynamics compatible with recording fast action potentials (APs), as demonstrated in cell cultures [12,19,20,30,31]. However, resolution of APs from multiple neurons in vivo in mammalian brains is not yet routinely achieved due to the intermingled neuronal processes in dense cell populations that complicate precise optical signal allocation to individual cells. The experimental strategies presented here offer a solution to this problem. Combination of the inducible dCre system with the intersectional transgenic approach for strong and cell class-specific indicator expression produces Golgi staining-like expression patterns with known cell identity (e.g., pyramidal neurons, Figure 1). Administration of a saturating TMP dose (750 mg/kg Figure 1c-iii) achieves a high density of indicator-expressing cells. We compared this density with expression pattern of CUX1 ([15], a DNA-binding protein homeodomain family that identifies layer II/III pyramidal neuron nuclei [32]), and we concluded that the Rasgrf2 promoter is active in most, if not all, layer II/III pyramidal neurons, hence when driving expression of stabilized dCre triggers Cre-mediated recombination in most, if not all, layer II/III pyramidal neurons. In contrast to the intermingled indicator expression at high recombination probability achieved by the saturating TMP dose (Figure 2a), strong but sparse expression pattern achieved by low-dose TMP administration resolves the morphology of distinct subcellular structures including axonal boutons and dendritic spines in single confocal planes in vivo (Figure 2b), opening the possibility for synaptic level functional monitoring in vivo. In our current study, a much lower dose of TMP is used than indicated in previous reports, to achieve limited recombination probabilities via the use of dCre [9]. A possible explanation could be the genomic location of the novel TIGRE locus—into which our indicator transgenes are inserted—is more Cre-accessible compared to the more widely used Rosa26 locus, thus
Int. J. Mol. Sci. 2017, 18, 1461
8 of 11
lowering amounts of stabilized Cre required to achieve a similar recombination probability [8,22]. Although the titrated TMP induction protocol achieves adjustable recombination percentage amongst a cell population, the recombination event in any given cell is, in principle, “all-or-nothing”, thus the effective indicator expression (thereby signal intensity) remains strong in the expressing cells despite the low populational expression density (Figures 1, 2 and 3b). 3.3. GEVI/GECI Co-Expression GECIs like GCaMPs are currently employed as a mainstream tool in systems neuroscience as a surrogate indicator of neuronal activity via reporting changes in the intracellular calcium concentration of the expressing cell. Although GCaMPs offer large signal-to-noise ratio due to the substantial change in cytosolic calcium concentration upon activity, this optical signal has a mixed origin and, whilst useful for reporting suprathreshold AP events, is completely blind to synaptic inputs [2]. In contrast, GEVIs are ideally suited to monitor synaptic responses and input−output behaviour. A more powerful approach to full exploration of the circuit connectivity is to combine GEVIs with GECIs. Whilst this has been explored ex vivo using voltage and calcium sensitive dyes [33,34], such approaches remain impossible in vivo. In the present study, a successful dual GEVI/GECI neuronal labelling in vivo was achieved (Figures 3 and 4) by using the modular nature of the intersectional transgenic strategies. In our transgenic animals, the fluorescence emission spectra from the mCitrine and mKate2 fluorescent protein pair in the FRET-based VSFP Butterfly family were sufficiently different from the GFP emission spectrum of GCaMP6f (Figures 3 and 4), thereby providing the essential bases for future simultaneous optical imaging of both voltage and calcium activity of the same neurons in vivo. 4. Materials and Methods All animal experimental procedures were performed in accordance with the United Kingdom Animals (Scientific Procedures) Act 1986 under Home Office project and personal licences following appropriate ethical review. 4.1. Animals Triple transgenic mice were generated to express GCaMP6f (Rasgrf2-dCre; CaMK2A-tTA;Ai93) or VSFP Butterfly 1.2 (Rasgrf2-dCre;CaMK2A-tTA;Ai78) in cortical layer II/III pyramidal neurons. Quadruple transgenic mice were generated to co-express VSFP Butterfly 1.2 and GCaMP6f in cortical layer II/III pyramidal neurons (Rasgrf2-dCre;CaMK2A-tTA;Ai78;Ai93), or to express chimeric VSFP Butterfly in all cortical pyramidal neurons and GCaMP6f in cortical layer II/III pyramidal neurons (Rasgrf2-dCre;CaMK2A-tTA;chiVSFP;Ai93). 4.2. Inducible Control of Recombination Using Trimethoprim Trimethoprim (Sigma, Germany) was dissolved in DMSO first at 100 mg/mL and then further serially diluted in DMSO. The TMP in DMSO solution was mixed 1:9 with 0.9% saline