Nov 1, 2017 - dt. = − αc αt dcc dt. − i. αtF. (3). When the RFB is charging/discharging, i is positive/negative respectively. The model of the EMF is derived ...
Transient Behavior of Redox Flow Battery Connected to Circuit Based on Global Phase Structure
arXiv:1711.00261v1 [eess.SP] 1 Nov 2017
Toko Mannari, Takashi Hikihara May 14, 2018
1
Introduction
Power storage is the most important element of power grid to overcome the restriction of simultaneous power balancing. With an increase of installation of the renewable energy sources, power storage should inevitably absorb the fluctuation. Power storage has advantages as a large capacity and a quick response [1]. The large capacity is necessary for applications like load leveling, and the quick response is necessary for applications like compensating sag and smoothing of the output of renewable sources. Among the possible storage systems, a Redox Flow Battery (RFB) has a feature of scalability [2, 3]. The feature is beneficial when installing the RFB in a various capacities of power grid. The feasibility of a Vanadium RFB for the load leveling was studied in Ohio [4]. A Vanadium RFB was applied for the compensating of the momentum voltage sag in a semiconductor factory in Japan [5]. A Vanadium RFB was tested for smoothing the output of the wind farm at Hokkaido, Japan [6, 5]. An analysis on transient behaviors of an RFB is a key issue for the applications. Transient behaviors of the RFB deeply depend on the chemical reaction and the flow of the electrolyte. However, the dynamics of the transient behaviors contain mixed times scale transient dynamics. Moreover, if an RFB is connected to power grid, it will include the electric circuit restriction. And previous analysis of RFB is still far from the practical operation. An ODE model [7] is one of the more helpful tools to analyze the transient behavior. Researchers have developed several kinds of models such as empirical models, equivalent models, and ODE models to analyze transient behaviors of an RFB [8]. In [7], an ODE model is proposed mainly based on chemical kinetics. This model represents change in a concentration of ions governing transient behaviors of the RFB. This model enables us to consider the chemical reaction, the flow of electrolyte, and the electric circuit restriction. The authors simulates electromotive force (EMF) at charging/discharging operation under constant current. The simulation results were confirmed by comparing to the experimental results in a constant current setting. The result showed that the model was valid. We use the model suggested in [7] and research transient behaviors of a Vanadium RFB in a response to a load variation, and consider the dynamical
1
mechanism of the transient behaviors. In the research, the transient behaviors shows a non linearity.
2
Current at transient due to load variation
This chapter discusses, transient behaviors of the RFB in a response to a load variation using the model based on chemical kinetics [7]. After introducing the model, the setting of simulation is explained. Here are found three types of transient behaviors in the simulations.
2.1
Model equation
A model of the micro RFB was introduced based on chemical kinetics [7]. The model represents a change in concentration of ions and EMF. Table 1 shows the nomenclature.
cc ct i W αc αt F cmax E0e
Table 1: Nomenclature. Concentration of ions (V2+ ) in cell Concentration of ions (V2+ ) in tank Current Flow rate Volume of cell Volume of tank Faraday constant Maximum of cc Eec at cc = cmax /2
mol L−1 mol L−1 A L min−1 L L C mol−1 mol L−1 V
A change in concentration of ions is modeled by considering the reductionoxidation reaction and the electrolyte flow. Figure. 1 illustrates the scheme of the Vanadium RFB. The RFB mainly consists of a cell unit and a tank [3]. In the cell, the chemical energy is converted to electrical energy by reduction-oxidation reaction. The reaction is represented as following Eqs. (1a) and (1b)[9].
Figure 1: Scheme of Vanadium RFB. �
VO2 + + 2H+ + e− * ) VO2+ + H2 O 2+ * 3+ − V )V +e
(1a) (1b)
The concentration of VO2 + or V2+ at the cell governs the reaction. In the tank, the chemical energy is stored as a form of ion substantial. The electrolyte 2
circulates between the cell and the tanks by pumps. The circulation makes a flow in the cell to supply the concentration of ions for the continuous reaction described by Eqs. (1a) and (1b). Here we set following assumptions, • Chemical kinetics is restricted by the current in the external circuit. • The electrolyte keeps the consistency of ions. • The time delay of circulation of electrolyte is negligible. • The concentration of ions (V2+ ) in the negative half cell is equal to the concentration of ions (VO2+ ) in the positive half cell. d2 cc dt2 dct dt
�
� 1 1 dcc Wi 1 di = −W + − − αc αt dt αc αt F αc F dt αc dcc i = − − αt dt αt F
(2) (3)
When the RFB is charging/discharging, i is positive/negative respectively. The model of the EMF is derived based on Nersnst’s equation [10]. Nersnst’s equation gives the equilibrium potential of the battery. And from an experiments in [11], the change in the concentration of H+ is also small enough to be ignored. Then, the model of the EMF is derived as following. Eec = E0e +
2.2
cc 2RT ln F cmax − cc
(4)
Simulation setting
Here explains the setting of the simulation. Figure. 2 shows the target system of the simulation. At t = 0 s, the switch turns on and the load is forced to a
Figure 2: Target system of simulation which include RFB. The load of RFB has changed in a step at t = 0 s. step change. The setting enables us to study the response of the RFB to the load variation. From KVL, following equation is obtained. � � �� 1 2RT cc di =− (r1 + r2 )i− E0e + ln (5) dt L F cmax − cc By using Eqs. (2) and (5), the following equation is derived. � � � � � � d2 cc 1 1 dcc r1 + r2 W i 1 2RT cc 0 = −W + + − − Ee + ln dt2 αc αt dt L αt αc F αc F L F cmax − cc 3
(6) Equations. (4)–(6) enable to simulate the transient behaviors of the RFB in this setting. Table 2 shows the parameters of the RFB. The initial condition of the Table 2: Parameters of RFB connected to circuit (ref.[7]). Parameter Value Unit αc 0.100 L αt 0.900 L T 307 K cmax 1.70 mol L−1
simulation is determined by putting assumptions as followings. • di/dt = 0 (t → −0). • cc = ct (t → −0). In this simulation, forth-order Runge-Kutta method [12] is adopted to solve the ODE. The step size is fixed at h = 0.001 s.
2.3
Result of simulation
In this section, first, the results of the simulation is explained and the transient behaviors are grouped into three types. Second, the consumption of the ions in the tank is examined in rate with comparing the transient behaviors of current. The simulation reveals that the current depends on the flow rate and behaves by different mechanics. Figure. 3 shows the result of the simulation. The initial 0.160 0.100 Lmin-1 15.0 0.050 Lmin 5.0
0
100
0.200 Lmin
0.050 Lmin-1(ct)
-1
-1
200
300
400
500
600
700
800
(a) Current in circuit. Eec / V
1.60 0.200 Lmin-1 0.80 0.00
0
0.100 Lmin-1 -1 0.050 Lmin 100 200 300
400 500 600 Time / s (b) EMF of RFB(Eec).
Concentration / mol L-1
i/A
25.0
0.200 Lmin-1(ct)
0.080 0.050 Lmin-1(cc)
0.200 Lmin-1(cc) -1
700
0.000
800
0.100 Lmin (cc) 0
100
200
300
400 500 Time / s
0.100 Lmin-1(ct) 600 700 800
(c) Concentration in cell(cc), and in tank(ct).
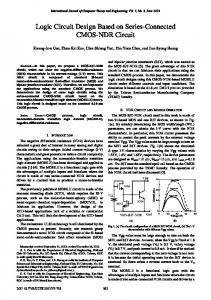
Figure 3: Simulated results of transient behaviors of RFB due to load variation. The initial value of the concentration of ions in the cell (cc0 ) is fixed at 0.125 mol L−1 . The flow rate is set at W = 0.050 L min−1 , 0.100 L min−1 , and 0.200 L min−1 . The transient behaviors are categorized into three types (Case1–3). value of the concentration of ions in the cell cc0 is fixed at 0.125 mol L−1 . And the flow rate is set at W = 0.050 L min−1 , 0.100 L min−1 , and 0.200 L min−1 . As Figs. 3(a) and 3(b) show, at W = 0.050 L min−1 , the current and the EMF 4
show sharp drops and the discharging simultaneously stops at the drops. We call the mode Case1. On the other hand, at W = 0.200 L min−1 , the current and the EMF show gradual decreases and discharges slowly. The discharging times is long. We call the mode Case2. At W = 0.100 L min−1 , the current and the EMF show an oscillation. It is called Case3. The transient behaviors due to other initial conditions are also categorized to the Case1, 2, and 3. There seems to be critical states in Fig. 3. The difference of the transient behaviors among the cases is corresponds to the consumption rate of ions in the tank. As showed in Fig. 3(c), almost all the ions in the tank are not consumed at W = 0.050 . It suggests that the transient behaviors are allocated to the consumption rate of the ion in the tank. In order to confirm the assumption, the consumption rate of the ions in the tank is calculated for W = 0.001 L min−1 –0.200 L min−1 and cc0 = 0.01 mol L−1 – 1.00 mol L−1 . The consumption rate is defined as following. εt =
ct0 − ctf ct0
(7)
i/A
32.0 16.0
A3 A2
A1 A4
0.0
0
1000
2000
Time / s
3000
4000
(b) Transient behaviors of current under conditions A1-A4. 30.0 L6 L5
i/A
1.00 1.00 0.90 0.90 0.80 L1 0.80 0.70 0.70 A1 0.60 L2 0.60 0.50 0.50 0.40 A3 L3 0.40 A4 0.30 0.30 L4 0.20 0.20 L5 L11 L6 L7 0.10 0.10 L8 L9L10 A2 L12 0.00 0.00 0.050 0.100 0.150 0.200 Flow rate / L min-1 (a) Consumption rate of ions in tank(εt).
εt
cc0 / mol L-1
Here, ctf denotes the concentration of ions in the tank at the time when the discharging has finished. The results are showed in Fig. 4(a). As showed in
L4
L3
L2
L1
15.0 0.0
L12 L11 L10
0
100
200
300
Time / s
400
500
L7 L9 L8
600
(c) Transient behaviors of current under conditions L1-L12.
Figure 4: Relationship between transient behaviors of current and consumption rate of ions in tank. (a)Consumption rate of the ions in the tank. A line divides the graph into two areas. (b)Transient behaviors of current simulated under conditions A1 and A4 (above the line) and A2 and A3 (below the line). When conditions are set at A1 and A4, the transient behaviors of current are categorized into Case2, and when conditions are set at A2 and A3, the transient behaviors of current are categorized into Case1. (c)Transient behaviors of current simulated under conditions (on the line). When conditions are set at L1–12, the transient behaviors of current are categorized into Case3. the figure, a line divides the graph into two regions. The region above the line represents the complete consumption of ions in the tank, and the below represents the remaining of ions until the end of discharging. Transient behaviors of current are simulated under conditions A1–4 as showed in Fig. 4(b). When the conditions are set at A1 and A4, the current behaves as classified in Case2. When the conditions are set at A2 and A3, the current behaves as classified in Case1. Transient behaviors of current are also simulated under conditions L1–12 as showed in Fig. 4(c). When the conditions are set at L1–12, the current 5
behaves as classified in Case3. Figure. 4 shows that the transient behaviors are actually correspond to the consumption of the ions in the tank.
3
Dynamical mechanism of transient behaviors
There seems to exist a mechanism which governs the transient behaviors to lead them into three types. In this chapter, we are going to focus on a dynamical mechanism of the transient behaviors. A dynamical mechanism of the three types of the transient behaviors is discussed with a dimensionless model in this chapter. The following discussions are from the view point of local dynamics around fixed point and global phase structures.
3.1
Analysis around a fixed point
The target system is modeled by following Eqs. (8a)–(8c). dx1 = x2 dτ � � dx x1 2 = −βx2 +(1−γ)x3 − 1 + ε ln dτ 1 − x1 dx x 1 δ 3 = −x3 +1 + ε ln dτ 1 − x1
(8a) (8b) (8c)
Where x1 , x2 , and x3 are the dimensionless variables corresponding to cc , dcc /dt, and i with the constants cˆ, tˆ, and ˆi. The constants cˆ, tˆ, and ˆi are given by Eq. (9). s cˆ = cmax , tˆ =
αc F Lcmax ˆ E0e , i = E0e r1 + r2
(9)
Where the parameters β, γ, δ, and ε are given by Eq. (10). � � 1 L tˆ0 2RT 1 ˆ WL (10) β=W , tˆ0 = ,δ= ,ε= + t, γ = ˆ αc αt αt (r1 + r2 ) (r1 + r2 ) F E0e t From dx/dτ = 0 (x = [x1 x2 x3 ]T ), the system has only one fixed point x∗ = [3.51 × 10⁻¹² 0 0]T . The local stability is analyzed with eigen values of a linearlized model of Eqs. (8a)–(8c) [13]. The linearization around x∗ is described by Eq. (11). ∆x = A∆x
(11)
Here, ∆x is x − x∗ . The matrix associated with the linearized model is given as following Eq. (12). 0 1 0 A = −f (x∗ ) −β 1 − γ (12) f (x∗ )/δ 0 −1/δ Where f (x) is given by Eq. (13). f (x) =
ε x1 (1 − x1 )
(13)
6
Table 3: Eigen values of A for W = 0.050 L min−1 , 0.100 L min−1 , and 0.200 L min−1 . W (L min−1 ) Eigen value of A −8.70 + 1.49 × 10⁵ j 0.050 −8.70 − 1.49 × 10⁵ j −3.17 × 10⁻² −8.84 + 1.49 × 10⁵ j 0.100 −8.84 − 1.49 × 10⁵ j −6.34 × 10⁻² −9.13 + 1.49 × 10⁵ j 0.200 −9.13 − 1.49 × 10⁵ j −12.7 × 10⁻²
Table 3 shows eigen values of A for W = 0.050 L min−1 , 0.100 L min−1 , and 0.200 L min−1 . For these three parameters, the real part of eigen values are negative. Then, the fixed point x∗ is locally stable, for these W . The stability implies the convergence of the solutions in the neighborhoods of the fixed point. On the other hand, the dynamics apart from the fixed point is governed by the vector flow of global phase structure. Figure. 5 illustrates the trajectory solutions categorized Case1–3. Figures. 5(a)–(d) show trajectories of the solutions 1.00
1.00
0.080
Case3
0.25
Case1
0.000 0.00
box 0.50
x3
0.000 3.00 -6.00 -3.00 0.00 3.00 0.00 x2(×10-3) -3.00 x2 -2 -6.00 (×10 ) (b) x 2-x1 phase. 1.00
x1
-3
0.080 0.040
0.00
-3.00
0.50
x3
(c) x3-x1 phase.
1.00
-6.00 0.00
0.50
x3
1.00
0.25 0.00
x2(×10-3)
3.00
(f) x2-x1 phase(in box).
3.00
0.75 0.50 0.25
0.00
0.00 0.60 0.65 0.70 0.75
-3.00 0.60 0.65 0.70 0.75
(g) x3-x1 phase (in box).
(h) x3-x2 phase (in box).
x3
(d) x3-x2 phase.
0.50
0.00 -3.00
1.00
x1(×10-3)
3.00
x2(×10 )
0.120
3.00
0.00 0.00 x2 0.60 0.65 -3.00 (×10-3) 0.70 0.75 x3 (e) Enlarged view of trajectories focused on box.
(a) Trajectories of solution.
0.000 0.00
Case3
0.75
-3
0.040
0.040
x2(×10 )
x1
Case2
0.50
x1
Case2 0.080
x1(×10-3)
0.75
x1(×10-3)
0.120
0.120
x3
Figure 5: Trajectory solutions classified as Case1–3. (a)–(d)The trajectory solutions classed as Case1 clearly does not converge to the fixed point x∗ = [3.51 × 10⁻¹² 0 0]T . (e)–(h)Enlarged view of the trajectories. The trajectory solution categorized into Case3 does not oscillate around the fixed point. categorized into Case1. The trajectories will not converge to the fixed point. Figures. 5(e)–(h) show the trajectories of the solutions categorized into Case3. They will not oscillate around the fixed point. The obtained solutions show the features of the global phase structure which is governed by the non linearity.
7
3.2
Global phase structure
This section discusses a part of the global phase structure of the solutions and the vector field. The global phase structure is magnified at small scale for visualizing the vector field. The approach is based on the knowledge of fastslow system [14]. 2.0
1.6
1.6
1.2
1.2
0.8
0.8
0.4
0.4
0.0 0.60 0.62 0.64 0.66 0.68 0.70 x3 (b) x2=-2.0×10⁻³.
0.0 0.60 0.62 0.64 0.66 0.68 0.70 x3 (c) x2=0.
0.0 0.60 0.62 0.64 0.66 0.68 0.70 x3 (d) x2=2.0×10⁻³.
2.0
2.0
2.0
1.0
1.0
1.0
0.0 -1.0
x2(×10-3)
0.4
0.0 -1.0
0.0 -1.0
1.0 -2.0 0.00 0.40 0.80 1.20 1.60 2.00 x1(×10-4)
(e) x3=0.60.
0.68
x3
0.66
0.64
0.62 -2.0 0.60
-1.0
0.0
(a) Trajectories of solutions.
1.0 -3
x2(×10 )
-2.0 0.00 0.40 0.80 1.20 1.60 2.00 x1(×10-4)
(f) x3=0.66.
(g) x3=0.70.
0.70
0.70
0.70
0.68
0.68
0.68
0.66
0.66
0.66
0.64
0.64
0.62
0.62
0.60 -2.0 -1.0
0.0
1.0
x2(×10-3) (h) x1=2.0×10⁻⁴.
2.0
x3
2.0
x3
0.5
0.0 0.70
-2.0 0.00 0.40 0.80 1.20 1.60 2.00 x1(×10-4)
x3
x1(×10-4)
1.5
1.2
0.8
x2(×10-3)
x2(×10-3)
2.0
x1(×10-4)
2.0
1.6
x1(×10-4)
2.0
x1(×10-4)
dx1/dτ=0 dx2/dτ=0 dx3/dτ=0
0.64 0.62
0.60 -2.0 -1.0
0.0
1.0
x2(×10-3) (i) x1=1.2×10⁻⁴.
2.0
0.60 -2.0 -1.0
0.0
1.0
x2(×10-3) (j) x1=2.0×10⁻⁵.
2.0
Figure 6: Global phase structure of solutions and vector field at W = 0.100 L min−1 . The area where the oscillation occur is focused on. In this area, the concentration of ions (x1 ) is low and the current (x3 ) changes largely compared to other two variables. (b)–(j)Vector field and nulkline is showed. Fast flow transverses to the nulkline dx3 /dτ = 0. Figure 6(a) shows a part of the solutions for W = 0.100 L min−1 . In this figure, the oscillations are found in a small scale which is x ∼ 10−4 . x1 corresponds to cc . Then, oscillations occur at low concentration of ions at the cell. On the other hand, the scale of changes in x3 , corresponding to i, is much bigger than both x1 and x2 . This implies the current is sensitive to the change in concentration of ions. The scale reveals the magnification characteristics in the battery from ion density to the current. The vector field is showed in Figs. 6(b)–(j). Figures 6(b)–(d) show the vector field and the trajectories of the solutions on the planes x2 =−2.0 × 10⁻³ , 0, and 2.0 × 10⁻³ . In the figures, the trajectories converge to the nulkline dx3 /dτ =0. When dx3 /dτ =0 is established, the RFB is limited by circuit condition. Fast flows appear along x3 , due to the value of δ in Eqs. (8a)–(8c). The value of δ implies the ratio of time scale of current to that of change in concentration of ions. Figures. 6(e)–(g) show the vector field and the trajectories of the solutions on the planes x3 =0.60, 0.66, and 0.70. As the figures show, the trajectories converge to the nulkline dx1 /dτ = 0. Figures. 6(h)–(j) show the vector field and the trajectories of the solutions on the planes x1 =0.50 × 10⁻⁴ , 1.0 × 10⁻⁴ , and 2.0 × 10⁻⁴ . As the figures show, the trajectories converge to the nulkline dx1 /dτ = 0. From the vector field, it is found that the system is fast-slow sys8
Imaginary part of eigen value
tem. But the system can not be divided into slow-subsystem and fast-subsystem clearly. The mechanism of the oscillations can be discussed by linearization with taking a plane perpendicular to a slow variable. x1 is one of the slow variables. The values of x1 are swapped in f (x) from x1 =0.0000010 to x1 =0.005. And the eigen values on each planes are shown in Figs. 7(a) and 7(b). In the figures, all of the eigen values are located on complex plane with Re[λi ] 5.72 × 10⁻⁴ , the eigen values become real. It implies that there does not appear any oscillatory transient behaviors in x1 > 5.72×10⁻⁴ . And λ1 and λ2 come close to each other as x1 decreases. At x1 = 5.72 × 10⁻⁴ they conjoint. After the conjoint by x1 decreasing, for x1 < 5.72 × 10⁻⁴ , λ1 and λ2 apart with imaginary parts, and the values increase as x1 decreases. This clearly shows the appearance of oscillation in x1 < 5.72×10⁻⁴ . Figure. 7(c) shows the phase lags of λi (i = 1, 2, 3). x1 → 0, the lags converge to 90◦ , 90◦ , and 180◦ . Then, the phase lags of the oscillations are also expected to converge 90◦ , 90◦ , and 180◦ . Actually, in Figs. 5(b)–(j), the oscillation in x1 has about 90◦ phase lag to x2 and x3 , and the oscillation in x2 has about 180◦ phase lag to x3 . The eigen values in Fig. 7 certainly shows the mechanism of the oscillation. λ1 λ2 λ3 x1=5.72×10⁻⁴
Imaginary part of eigen value
200 150 100 50 0 -50
200 150 100 50 0 -50 -100 -150 -200 -20
-100
λ1 λ2 λ3
-15 -10 -5 Real part of eigen value (b) Eigen value (2-dimension).
-150
0
-4
-15 Real part of -10 eigen value -5 0
0
10
30
20
40
-4
x1 (×10 )
(a) Eigen value (3-dimsntion) with x1.
50
Angle
-200 -20
360° 270° 180° 90° 0° -90° -180° -270° -360°
x1=5.72×10
0
10
λ2−λ3 λ3−λ1 λ1−λ2
20 30 40 -4 x1 (×10 ) (c) Phase lags of eigen values.
50
Figure 7: (a)(b)Eigen values of Jacobin matrix A. A bifurcation appears at x1 =5.72 × 10⁻⁴ . In x1 < 5.72 × 10⁻⁴ , appearance of oscillations is showed by imaginary part of eigen values. (c)Phase lags of eigen values λi (i = 1, 2, 3). Phase lags of oscillations are expected to converge to 90◦ , 90◦ , and 180◦ .
4
Conclusion
We discussed the transient behaviors of the RFB in a response to a load variation, and we found the dynamical mechanism of the transient behaviors. Results are summarized as followings.
9
1. Three types of transient behaviors appear and one of them causes oscillations. The transient behaviors depend on the value of flow rate and the initial value of the concentration of ions. 2. The global phase structure determines the transient behaviors. From the global phase structure, it is clarified that the behaviors are limited by electrical circuit restriction due to the value of a parameter which corresponding to time scale ratio of current to the changing ratio in concentration of ions. It is also clarified that a necessary condition for occurrence of the oscillations are governed by the low concentration of ions. The results show that several kinds of phenomena appear in transient behaviors of single RFB, when the RFB is connected to power grid. According to flow rates or initial values of concentration of ions, the discharging of the RFB stops before it consumes the all of ions. On the other hand, there are conditions which arise oscillations. In the worst case, it may cause resonances with external systems. To avoid these anomalous phenomena, a control method of multi layer must be developed with considering chemical, fluid dynamics, and electrical circuit restriction. The transient behaviors in the wide range are based on the global dynamics, so that the control method must pay attention to the mechanism. However, the whole dynamical structure has not been figured out through the simulations. This paper brought us an interesting dynamical behavior with a difficulty of a mixed time scale system because of the global phase structure along the slowest variable.
References [1] B. Dunn, H. Kamath, and J-M. Tarascon, “Electrical Energy Storage for the Grid: A Battery of Choices,” Science, vol.334, no.6058, pp.928–935, 2011. [2] X. Qiu, T. A. Nguyen, J. D. Guggenberger, M. L. Crow, and A. C. Elmore, “A Field Validated Model of a Vanadium Redox Flow Battery for Microgrids,” IEEE Transactions on Smartgrid, vol.5, no.4, pp.1592–1601, 2014. [3] G. Tomazic and M. Skyllas-Kazacos, “Redox Flow Batteries” in Electrochemical Energy Storage for Renewable Sources and Grid Balancing, eds. P.T. Moseley and J. Garch, pp.309–334, Elsevier, 2015. [4] M. Skyllas-Kazacos, M. H. Chakrabarti, S. A. Hajimolana, F. S. Mjalli, and M. Saleem, “Progress in Flow Battery Research and Development,” Journal of The Electrochemical Society, vol.158, no.8, pp.R55–R79, 2011. [5] T. Shibata, T. Kumamoto, Y. Nagaoka, K. Kawase, and K. Yono, “Redox Flow Batteries for the Stable Supply of Renewable Energy,” SEI Technical review, pp.14–22, 2013. [6] T. Shigematsu, T. Kumamoto, H. Deguchi, and T. Hara, “Applications of a Vanadium Redox-Flow Battery to Maintain Power Quality,”
10
Proc. IEEE/PES Transmission and Distribution Conference and Exhibition, 2002, vol.2, no.76, pp.1065–1970, 2002. [7] M. Li and T. Hikihara, “A Coupled Dynamical Model of Redox Flow Battery Based on Chemical Reaction, Fluid Flow, and Electrical Circuit,” IEICE Transactions on Fundamentals of Electronics, Communications and Computer Sciences, vol.E91-A, no.7, pp.1741–1747, 2008. [8] Q. Zheng, X. Li, Y. Cheng, G. Ning, F. Xing, and H. Zhang, “Development and perspective in vanadium flow battery modeling,” Applied Energy, vol.132, pp.254–266, 2014. [9] M. Rychcik and M. Skyllas-Kazacos, “Characteristics of a new all-vanadium redox flow battery,” Journal of Power Sources, vol.22, no.1, pp.59–67, 1988. [10] H. J. Bergveld, W. S. Kruijt, and P. H. L. Notten, Battery Management Systems Design by Modeling, p.443, Kluwer Academic Publishers, 2002. [11] T. Sukkar and M. Skyllas-Kazacos, “Water Transfer Behaviour Across Cation Exchange Membranes in the Vanadium Redox Battery,” Journal of Membrane Science, vol.222, no.1, pp.235–247, 2003. [12] W. H. Press, S. A. Teukolsky, W. T. Vetterling, and B. P. Plannery, Numerical Recipes in C, pp.710–714, Cambridge University Press, 1992. [13] S. Wiggins, Introduction to Applied Nonlinear Dynamical Systems and Chaos, p.8, Springer-Verlag, 1990. [14] C. Kuehn, Multiple Time Scale Dynamics, p.8, Springer International Publishing, 2015.
11