2 RJ Lee Group, Monroeville, PA 15146, USA. 3 U.S. Steel Corp. Research and Technology Center, Pittsburgh, PA 15120, USA. Abstract. In aluminum-killed ...
Accepted version of manuscript. Published version is available at link.springer.com
Transient inclusion evolution during modification of alumina inclusions by calcium in liquid steel Part I. Background, Experimental Techniques and Analysis Methods N. Verma1, P.C. Pistorius1, R.J. Fruehan1, M. Potter2, M. Lind1 and S. Story3 1
Center for Iron and Steelmaking Research, Department of Materials Science and Engineering, Carnegie Mellon University, 5000 Forbes Avenue, Pittsburgh, PA 15213, USA 2 3
RJ Lee Group, Monroeville, PA 15146, USA
U.S. Steel Corp. Research and Technology Center, Pittsburgh, PA 15120, USA
Abstract In aluminum-killed steels, modification of solid alumina inclusions is often carried out by calcium treatment, converting the alumina to liquid calcium aluminates. When calcium treatment is performed, calcium can either react with sulfur in the melt or with solid alumina. Calcium sulfide inclusions are solid at steel casting temperatures and would thus be detrimental to castability if these remained in the steel after calcium treatment. The aim was to study the transient evolution of inclusions following calcium treatment, testing the hypothesis that calcium sulfide may form as an intermediate reaction product, which can subsequently react with alumina to form modified calcium aluminates. Part I gives the project background, and describes the experimental and quantification techniques adopted, including the effect of sampler size in laboratory melts. Results on the formation of intermediate calcium reaction products in laboratory and industrial heats are presented in Part II.
1. Introduction The production of clean steel involves the control, elimination or modification of nonmetallic inclusions [1]. In Al-killed steels, alumina (Al2O3) is the main inclusion type. In some cases, these inclusions can also contain some MgO [2,3], but the work presented here focuses on alumina inclusions and their modification. Calcium treatment, by powder injection or wire feeding, is commonly used to modify solid alumina inclusions to
calcium aluminates, which can be fully or partially liquid, depending upon CaO content [4]. Liquid inclusions improve steel castability. Reaction sequence (1) summarizes the conventional view [5,6] of the reactions upon calcium injection, which include melting, vaporization and dissolution (in liquid steel) of the calcium, and reaction with alumina, dissolved oxygen, and dissolved sulfur. Ca(s) Ca(l) Ca(g) [Ca] [Ca] + [O] CaO
................................................. (1)
[Ca] + [S] CaS [Ca] + (x+1/3) Al2O3 CaO.xAl2O3 + 2/3 [Al]
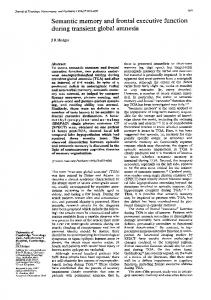
The importance and role of CaS formation are not clear from previous work. CaS is not stable in contact with unmodified or CaAl2O4-saturated modified inclusions in aluminum-killed steel if the dissolved sulfur content is less than approximately 300 ppm at 1600°C (Figure 1); the extent of formation of CaO and CaS was concluded to be negligible [6].
However, CaS was reported to form as a transient phase [7,8,9],
immediately upon calcium injection [3], or perhaps only after calcium aluminates have formed [9]. The subsequent reaction mechanism of CaS is similarly unclear; suggestions include evaporation of calcium [8] or an unspecified reaction leading to equilibration (i.e. consumption of CaS) [9]. Our preliminary work supported a direct role of CaS in modification of alumina for 3-kg laboratory steel melts containing 45 ppm S and 0.040.05% Al. The transient CaS inclusions in contact with unmodified alumina were observed in steel samples taken immediately after calcium addition, whereas steel samples which were taken later contained partially modified (calcium aluminate) inclusions, with much lower sulfur contents [3]. It is hence proposed that the CaS can react with the alumina to yield modified inclusions, according to reaction (2). (Dissolved calcium may be a reaction intermediate, but because of the uncertainty regarding the concentration of dissolved calcium in liquid steel [10,11], this is not explicitly included in the reaction.) 3CaS + Al2O3 3(CaO) + 2[Al] + 3[S]
.................................................. (2)
Through formation of CaS as a transient phase, sulfur in the steel may assist modification by capturing calcium, which can subsequently react with alumina. The possible extent of calcium capture would depend on the sulfur content of the steel. For a typical total oxygen content of 20 ppm in the steel (mostly alumina), the minimum amount of calcium required to react to transform alumina inclusions to liquid calcium aluminates would about be 13 ppm. This corresponds to a minimum of 10 ppm S required to capture the injected calcium, if S were responsible for capturing all the calcium. A different modification mechanism is hence expected in steel containing less than approximately 10 ppm S; this was tested experimentally. The work presented here aimed to verify the formation and role of transient calcium sulfide, by analyzing the evolution of inclusion size, shape and composition after calcium treatment. Laboratory experiments and industrial heats were considered, using aluminumkilled steel with sulfur contents between 7 ppm and 100 ppm.
When examining inclusions in samples of calcium treated steel, care should be taken to distinguish ways in which calcium sulfide can form. The three known origins of CaS coexisting with oxide inclusions are as follows. 1. Stable CaS, formed by Ca treatment of high-sulfur steels, or over-modification (adding more calcium than needed to modified alumina inclusions) [6,14]. 2. CaS ring formation around a modified calcium aluminate, formed during solidification due to sulfur enrichment in the residual liquid metal around a modified inclusion [15]. 3. Transient CaS formation (often in contact with unmodified inclusions) [3,7,8,9].
Inclusions containing CaS of types 2 and 3 were observed in this work. These were distinguished readily, since no ring-shaped deposit of CaS was found shortly after calcium treatment – transient CaS was generally present as discrete particles, often in contact with alumina, but never as a ring around alumina.
2. Methodology Laboratory scale melts and industrial heats were studied, using samples taken after aluminum deoxidation and at various times after calcium treatment. SEM/EDS (scanning electron microscopy with energy dispersive spectrometry) of polished steel sample cross-sections were used to characterize inclusion shape, size and composition. Both automated and manual microanalyses were used. Industrial samples were also analyzed. 2.1. Materials Laboratory melts were prepared with high purity electrolytic iron (12 mm diameter pieces), using aluminum shot (99.999%, 5 mm diameter) for deoxidation. Calcium disilicide (CaSi2) powder was used for calcium treatment. A high purity (99.9%) porous MgO crucible (outer diameter 86mm, inner diameter 71mm and height 160mm) was employed to melt iron. Various sampling tubes were used and the effect of sampling tube size was also studied (comparing larger-diameter gravity-fed quartz tubes with smaller-diameter vacuum samplers). To test the effect of sulfur in the melt on the extent of modification of oxide inclusions, FeS (iron II sulfide – 99.99% purity) was used to adjust the sulfur content of the melt (FeS was added with the iron, before deoxidation).
2.2. Experimental Setup Figure 2 shows a schematic diagram of the experimental setup for laboratory melts. A 15kW vacuum induction furnace was employed for melting, additions and sampling of the steel [16]. This furnace was used to reduce reoxidation of the melt by the atmosphere, which would have altered the inclusion and melt chemistries. The vacuum system connected to the induction furnace (mechanical pump and diffusion pump) could evacuate the chamber to about 1 Pa, prior to subsequent backfilling with argon. A dual wavelength pyrometer measured the melt temperature through a top window. Two manipulators with sampling tools (figure 2) were used to make additions and take samples. The manipulators allowed rotation and vertical movement of the sampling tools without exposing the melt to atmosphere, thus avoiding reoxidation of the steel.
2.3. Experimental Procedure Figure 3 shows a flowchart of the experimental procedure. The chamber was evacuated with the mechanical and diffusion pumps, and then backfilled with high purity argon, to atmospheric pressure. A total of 3 kg of electrolytic iron chips was melted in an MgO crucible, first melting about 0.8 kg of electrolytic iron, followed by adding the remaining 2.2 kg in batches when the initial iron had melted. This stepwise addition was used to avoid bridging of the electrolytic iron chips in the crucible. The oxygen content of the liquid iron (before Al deoxidation) was measured to be about 400 ppm. After all the iron chips had melted (power input approximately 7.5 kW), the melt was held (at 1600°C) for 20 minutes for homogenization. Aluminum shot (99.999%) was then added to the melt for deoxidation, by lowering a steel sheet (2 mm thick) capsule (containing the aluminum shot and attached to an iron wire of 2 mm diameter) into the melt. Upon lowering the capsule, the iron wire melted and the capsule dropped down into the melt. Calcium treatment was subsequently performed by adding calcium silicide (CaSi2) in powder form. Calcium silicide addition to molten steel is challenging as much of the calcium tends to vaporize because of its low boiling point. For the present experiments, calcium silicide powder was enclosed in a 4 mm thick iron capsule, attached to a 5 mm diameter iron rod. The rod was used to submerge the capsule in the melt to make the calcium addition as deeply as possible. Liquid steel samples were taken after deoxidation (typically 2 minutes after aluminum addition) and at various times (typically 2 minutes and 4 minutes) after calcium treatment. Because of the difficulties with calcium silicide additions, experiments were repeated or samples in different experiments were overlapped to test for reproducibility. Two designs of sampling tube were used and compared, as discussed later. 2.4. Characterization 2.4.1 Bulk Chemical analysis Inductively coupled plasma (ICP) spectroscopy was used to analyze Al, Mg and Ca. The total oxygen content was measured by the inert gas fusion method (LECO N/O system), and the total sulfur content with a carbon/sulfur analyzer (LECO C/S system).
2.4.2 Inclusion microanalysis After samples had been collected in sampling tubes, discs from the pin samples were machined and mounted in epoxy. SEM samples were prepared by wet grinding cross-sections to 1200 grit, followed by diamond polishing. Care was taken during manual polishing to avoid pulling inclusions out of the steel surface. Alumina or silica suspensions were avoided during polishing to minimize contamination. Automated inclusion microanalysis ASCAT (Automated Steel Cleanliness Analysis Tool) was used to determine the distribution of inclusion compositions; it is capable of analyzing hundreds of inclusions in a steel sample within minutes [17]. An ASCAT system consists of a scanning electron microscope, an energy dispersive X-ray spectroscopy (EDS) analyzer, a digital scan generator under computer control, and control software. Most of the focusing and contrast/brightness threshold operations are automated. Inclusions are detected automatically based on backscattered electron image contrast, and analyzed automatically for size, composition and morphology (instrument conditions: 20keV, 220× magnification, 18 mm working distance, Si-drift detector at 45 elevation). Usually, inclusions larger than 1 micron in diameter were detected and analyzed. The threshold value for the detected elements (like Mg, Al, S and Ca) was around 2 atomic%. ASCAT analysis of inclusions did not give any indication the homogeneity of the inclusions. For this purpose, manual SEM analysis was also performed on selected inclusions (instrument conditions: 20keV, 10 mm working distance, Si-drift detector at 35 elevation). 2.4.3. Extraction of inclusions by dissolution of the steel matrix Inclusions were extracted by dissolving steel samples (mass: 1g) in bromineanhydrous methanol solution (100ml volume, 10% bromine by mass) for 24 hours, at room temperature [18]. This treatment dissolved the steel matrix, leaving the oxide inclusions behind; the inclusions were recovered by filtering the solution through a polycarbonate filter membrane with 0.2 micron openings (using an aspirator pump to create suction across the filter), subsequently rinsing the membrane with anhydrous methanol. After evaporation of the methanol, the membrane was mounted on a copper or
brass stub (instead of the more commonly used aluminum stubs) and sputter coated with platinum (2 Å) for scanning electron microscopy. Sulfides are dissolved by the brominemethanol solution [18], but in steel samples which were subject to only partial dissolution (etching the steel surface) some inclusions containing sulfur could be observed at the steel surface. 2.5. Quantifying the effectiveness of calcium treatment The effectiveness of the calcium treatment was evaluated by the following two methods:
2.5.1. Modified Ca/Al ratio [17] Alumina inclusions are liquefied by reaction with calcium if a sufficiently high Ca:Al ratio is achieved in the oxide inclusion. However, it is necessary to correct for the contribution of CaS (often closely associated with oxide inclusion) to the calcium analysis. There is about 2 atomic % solubility of sulfur in liquid calcium aluminate; assuming that the balance of the sulfur (%S-2%) is present as solid CaS, the molar ratio of Ca to Al in the modified inclusion (excluding CaS) was estimated as: %Ca - %S 2 Ca %Al Al mod
.................................................. (3)
In this equation, the compositions are in atomic percentages. Higher values of the modified Ca/Al ratio indicate higher degrees of modification of alumina inclusions by calcium.
2.5.2. Distribution of inclusion compositions: ternary proportional symbol plots In this work, the inclusions were compounds of calcium and aluminum with oxygen and sulfur. Since the valence of calcium and aluminum in the inclusions is fixed, inclusion compositions can be represented on ternary Al-Ca-S plots without losing any information on the oxygen content of the inclusions. To this end, inclusion compositions were normalized to 100% with respect to Al, Ca and S. To show the distribution of inclusion compositions, ternary proportional symbol
plots were drawn, following the procedure illustrated in Figure 4. The procedure was to divide the ternary composition diagram into 400 congruent non-overlapping triangles (with a 5% increment of one of the three components across the width of each triangle), and counting the number of inclusions with compositions in each triangle with a spreadsheet. To create the proportional symbol plot (using the statistical package R [19]), the inclusion count was used to scale each triangular symbol centered in the corresponding composition triangle.
In the plot, the height of each symbol is
proportional to the number of inclusions raised to the power n, where n=0.57. (A value of n=0.5 would cause the area of each symbol to be proportional to the number of inclusions, but because of the way in which areas are judged by human observers, n=0.57 is preferred [20].) The symbols were scaled such that the largest symbol had the same size in all plots, and completely filled its composition triangle. Figure 4 illustrates the utility of this method, providing a clear indication of the distribution of inclusions; inclusion compositions plotting along the edges or at the corners of the composition triangles may be overlooked in the scatter plot, but are clearly shown in the proportional symbol plot. Figure 4a shows the traditional Al-S-Ca ternary plot. Whereas these plots give a good indication of the change in inclusions compositions, a given point may represent a single inclusion or an unknown number of inclusions. This problem can be solved through the use of proportional symbol plots. For example, Figures 4b and 4c show that the specific sample contained a significant proportion of alumina (approximately 5% of all the inclusions), which is not at all evident in the scatter plot (Figure 4a). In Figure 4c, the dot-dash line gives the compositions which are 50% liquid at 1550°C (as calculated with FactSage 6.2, using the FSstel and FToxid databases [12]); upon successful calcium modification the majority of inclusions would lie within this boundary. The definition used here is that the 50% liquid boundary gives phase compositions in which the liquid and solid contain equal number of moles of cations (i.e. the total number of moles of Ca and Al is same in liquid and solid; S and O are not taken into account).
3. Characterization of deoxidation products and the effect of sampler type 3.1 Aluminum deoxidation products Preliminary experiments were performed to determine the amount of Al required to reach 0.03 to 0.06 wt% dissolved Al in the melt after deoxidation (similar to industrial melts); this was found to be 3 grams (for the 3 kg of laboratory melts). No oxygen was added to the iron; the oxygen present before deoxidation originated from the raw materials used in the experiment. Analysis of steel samples taken after deoxidation showed most inclusions to be pure alumina; only occasionally some Mg was detected in inclusions (MgO refractory being the source). Figure 5 the shows irregular and agglomerated nature of these inclusions.
The experimental procedure included evacuating and backfilling the chamber with argon, to avoid reoxidation. The effectiveness of this procedure was tested by sampling the steel melt at times 5 min, 10 min and 20 min after deoxidation. The total aluminum content of the melt (mostly dissolved aluminum), remained essentially constant (Table 1) whereas the inclusion content of the melt decreased consistently (Figure 6), as expected in the absence of reoxidation. With time, the size distribution shifted to smaller sizes (Figure 7) as larger inclusions preferentially floated out.
In a
separate test, the total oxygen content was found to decrease sharply to 47 ppm in the first two minutes, reaching half this value after 30 minutes (Table 2). This change between 2 minutes and 30 minutes is smaller than that suggested by the data in Figure 6; the probable reason for this is that the ASCAT results (used to draw Figure 6) excludes inclusions smaller than 1 µm, which the chemical analysis (used to determine the total oxygen content reported in Table 2) does not. (The total oxygen is the sum of the dissolved oxygen, 3-4 ppm, and oxygen bound in inclusions. The large decrease in total oxygen content from 450 ppm to around 50 ppm within 2 minutes indicates that the reaction between the aluminum and oxygen is fast, in agreement with Turkdogan’s observations [21].) Based on these observations, calcium modification was performed 2 minutes after aluminum deoxidation, in the laboratory heats.
Samples cut from a laboratory melt after solidification in the furnace (approximate size of ingot 3 kg; diameter 70 mm; height 110 mm) similarly showed a much higher inclusion concentration at the top of the ingot, with much lower inclusion concentrations at the half height of the ingot, both on the axis of the ingot, and at the surface in contact with the crucible (Table 3); the inclusions at the top surface were significantly larger (Figure 8).
3.2 Effect of Sampler Type Given the uneven vertical distribution of inclusions in the melt, it was necessary to ensure that the samplers extracted samples which did not include the inclusions from the surface of the melt. Two types of fused-quartz samplers were compared:
Sampler Type I: Gravity-fed closed-end tube, with liquid steel entering through a hole on the side of the sampler (15mm internal diameter; see Figure 9) Sampler Type II: Vacuum sampler – an evacuated "pin" tube with a thinned end which ruptured within the melt (7mm internal diameter) Samples taken with the larger-diameter sampler showed an apparent increase in inclusion concentration and total oxygen content after calcium treatment (Table 4); this is not in agreement with the absence of reoxidation in the experiments.
In separate
experiments, the change in inclusion distribution with height in the sampler was measured (see Figure 9 for the positions of the examined cross-sections). The results (Tables 5 and 6) show a significantly higher inclusion concentration at the top of the sample, suggesting flotation of the inclusions within the sampler before or during solidification. The much higher concentration of inclusions at the top of the sample taken before calcium treatment is in line with the observation (discussed in Part II) that the inclusion size decreased after calcium treatment: the larger alumina (deoxidation product) inclusions hence have a greater tendency to float out and hence the central part of the sample is depleted of inclusions. The smaller-diameter vacuum samplers largely avoided the negative effects of differential flotation of larger and smaller inclusions, as demonstrated in trials where both sampler types were used on the same laboratory heat. Table 7 shows the area fractions
and inclusion concentrations of samples collected before and after calcium treatment, using both sampler types. Of the samples collected before calcium treatment (larger inclusions), the smaller-diameter vacuum samplers yielded a significantly larger inclusion count and area fraction than the larger gravity-fed samplers. Taking samples with the larger-diameter samplers appears to result in undercounting of inclusions, presumably because inclusions floated out during solidification in the sampler. The sample collected after Ca treatment did not show a big difference in area fraction and inclusion concentration between the vacuum sampler and quartz tube, in line with the smaller inclusion size after calcium treatment. Hence the vacuum samplers were preferred both because these took samples from deeper within the melt (and hence were more representative of the bulk of the steel), and because their smaller internal diameter would cause the sample to solidify more rapidly, with less flotation of inclusions within the sampler.
4. Summary and Conclusions This paper (Part I) describes the methodology adopted to study the transient behavior of inclusions upon calcium treatment of alumina inclusion. Automated inclusion analysis (ASCAT) was used to obtain the distribution of inclusion compositions; the distributions were plotted as proportional symbol diagrams. Inclusion flotation occurred both within the experimental melt and liquid steel samples taken from the melt. Smallerdiameter vacuum samplers were observed to be more representative of the melt, by taking the sample more deeply in the melt, and giving more rapidly sample solidification than in larger-diameter gravity-fed samplers. Part II presents results on modification of alumina inclusions by calcium (based on laboratory and industrial samples) illustrating the formation of transient (nonequilibrium) reaction products upon calcium treatment and presenting a proposed reaction mechanism for the modification of alumina inclusions by calcium at different sulfur contents in the steel.
5. Acknowledgments Support of this work by the industrial members of the Center for Iron and Steelmaking Research is gratefully acknowledged.
6. References 1. A.W. Cramb: Impurities in Engineering Materials, C.L. Briant (ed.), Marcel Dekker, New York, NY, 1999, pp. 49-90. 2. G.J.W. Kor: Proceedings of the First International Calcium Treatment Symposium. The Institute of Metals, London, UK, 1988, pp. 39-44. 3. N. Verma, M. Lind, P.C. Pistorius, R.J. Fruehan and M. Potter: Iron Steel Technol.,2010, vol. 7(7), pp. 189-197. 4. G.M. Faulring, J.W. Farrell and D.C. Hilty: Iron Steelmaker, 1980, vol. 7(2), pp. 14-20. 5. B. Deo and R. Boom: Fundamentals of Steelmaking Metallurgy, Prentice Hall International, Hemel Hempstead, United Kingdom, 1993, pp. 265-269. 6. G.J.W. Kor: The Elliott Symposium, Iron and Steel Society, Warrendale, PA, 1990, pp. 400-417. 7. D. Lu, G.A. Irons and W.K. Lu: Proceedings of First International Calcium treatment Symposium. The Institute of Metals, London, UK, 1988, pp. 23-30. 8. Y. Higuchi, M. Numata, S. Fukagawa and K. Shinme: ISIJ Int., 1996, vol. 36, pp. S151-S154. 9. W. Tiekink, B. Santillana, R. Boom, R. Kooter, F. Mensonides and B. Deo: Iron Steel Technol., 2008, vol. 5(9), pp. 185-195. 10. J.C. Anglezio, C. Servant and I. Ansara: CALPHAD: Comput. Coupling Phase Diagrams Thermochem., 1994, vol. 18, pp. 273-309. 11. I.-H. Jung, S.A. Decterov and A.D. Pelton: Metall. Mater. Trans. B, 2004, vol. 35B, pp. 493-507.
12. C.W. Bale, P. Chartrand, S.A. Degterov, G. Eriksson, K. Hack, R. Ben Mahfoud, J. Melançon, A.D. Pelton and S. Petersen: CALPHAD: Comput. Coupling Phase Diagrams Thermochem., 2002, vol. 26, pp. 189-228. 13. G. K. Sigworth and J. F. Elliott: Met. Sci., 1974, vol. 8, pp. 298-310. 14. J.M.A. Geldenhuis and P.C. Pistorius: Ironmaking Steelmaking, 2000, vol. 27, pp. 442-449. 15. Y. Wang, M. Valdez and S. Sridhar: Metall. Mater. Trans. B, 2002, vol. 33B, pp. 625–632. 16. H. Matsuura, C. Wang, G. Wen and S. Sridhar: ISIJ Int., 2007, vol. 48, pp. 12651274. 17. S.R. Story, T. Piccone, R.J. Fruehan and M. Potter: Iron Steel Technol., 2004, vol. 1(9), pp. 163-169. 18. T.R. Dulski: A manual for the chemical analysis of metals, American Society for Testing and Materials, West Conshohocken, PA, 1996, pp. 89-90. 19. R Development Core Team: R: A language and environment for statistical computing. R Foundation for Statistical Computing, Vienna, Austria, 2010. URL http://www.R-project.org/. 20. J.J. Flannery: Canadian Cartographer, 1971, vol. 8, pp. 96-109. 21. E.T. Turkdogan: Arch. Eisenhuettenwes., 1983, vol. 54, pp. 1-10.
Figures and Captions
Figure 1: Calculated Al-S equilibrium curves for aCaS=1 (solid reference state) in contact with liquid CaO-Al2O3 (at CaAl2O4 saturation) in steel, for 1823K and 1873K. Reaction equilibrium constant and CaO and Al2O3 activities taken from FactSage [12]; free energy of solution of sulfur and aluminum in steel taken from Sigworth & Elliott [13].
Figure 2: Schematic of Experimental Setup and Sampling Tool
Figure 3: Experimental procedure
Figure 4: Illustration of the procedure used to draw proportional symbol plots. a) Scatter plot of analyses of 981 inclusions from a steel sample (plotted as mole fractions of Ca, S and Al, excluding oxygen).
Figure 4b: Numbers of inclusions with compositions in each of the 400 composition triangles.
Figure 4c: Proportional symbol plot- the area of each triangle is proportional to the number of inclusions of which the compositions lie in that composition triangle.
Figure 5: Clustered alumina inclusions (extracted with bromine-methanol)
Figure 6: Area fraction (measured by ASCAT) of alumina inclusions in steel samples taken at different times after aluminum deoxidation, showing progressive floating-out of inclusions.
Figure 7: Size distribution (measured by ASCAT) of inclusions in steel samples taken at various times after aluminum deoxidation.
Figure 8: Number percent size distribution of inclusions (measured by ASCAT) in samples from different positions in a solidified experimental ingot
Figure 9: Schematic of gravity-fed quartz sampler (type I), showing approximate positions of slices taken to measure inclusion distribution
List of Tables Table 1: Total aluminum content in the steel samples taken at various times after aluminum deoxidation (accuracy of chemical analysis results is + 0.002%) Sample Al (wt%) 5 min after Al addition 0.060 10 min after Al addition 0.062 20 min after Al addition 0.054 Table 2: Aluminum and total oxygen content in steel samples collected at different times after aluminum deoxidation Sample Al (wt%) Total Oxygen (ppm) Before Al addition 0 450 2 min after Al addition 0.053 47 30 min after Al addition 0.050 23 Table 3: Inclusion concentration and area fraction of inclusions (ASCAT measurements) at different positions in solidified experimental melt Num/cm2 of inclusions Area fraction of inclusions 5 Top sample 1.8×10 0.026 Center sample 110 9.4×10⁻⁶ Side sample 102 9.5×10⁻⁶ Table 4: Inclusion area fraction and concentration (ASCAT results) and total oxygen content, before and after calcium treatment for larger-diameter, gravity-fed sampler (type I) – from middle part of the sample Area fraction Num/cm2 Total Oxygen Content Before Ca treatment 12 ppm 269 10 ppm After Ca treatment 130 ppm 1197 40 ppm Table 5: Inclusion concentration and area fraction of inclusions (ASCAT results) in slices at various heights in a larger (gravity-fed) sample, taken after deoxidation Position Num/cm2 Area fraction Top 25458 1560 ppm Middle 1068 43 ppm Bottom 1041 48 ppm Table 6: Inclusion concentration and area fraction of inclusions (ASCAT results) in slices at various heights in a larger (gravity-fed) sample, taken after calcium treatment (same heat as Table 5) Position Num/cm2 Area fraction Top 4825 233 ppm Middle 3428 67 ppm Bottom 2982 57 ppm
Table 7: Area fraction of inclusions and inclusion concentration (ASCAT results) for different sampler types (larger diameter gravity-fed, and smaller-diameter vacuum samplers); before and after Ca treatment Sample Sampler Area Fraction Num/cm2 Type I (larger dia.) 50 ppm 2195 Before Ca treatment Type II (smaller dia.) 160 ppm 4138 Type I (larger dia.) 110 ppm 6121 After Ca treatment Type II (smaller dia.) 80 ppm 8718