Transient ST-Segment Episode Detection for ECG Beat Classification Subhash Banerjee
Suma C. Bulusu, Miad Faezipour, Vincent Ng, Mehrdad Nourani and Lakshman S. Tamil Quality of Life Technology Laboratory The University of Texas at Dallas, Richardson, TX 75080 {scb073000, mxf042000, vince, nourani, laxman}@utdallas.edu Abstract— Sudden Cardiac Death (SCD) is an unexpected death caused by loss of heart function when the electrical impulses fired from the ventricles become irregular. Most common SCDs are caused by cardiac arrhythmias and coronary heart disease. They are mainly due to Acute Myocardial Infarction (AMI), myocardial ischaemia and cardiac arrhythmia. This paper aims at automating the recognition of ST-segment deviations and transient ST episodes which helps in the diagnosis of myocardial ischaemia and also classifying major cardiac arrhythmia. Our approach is based on the application of signal processing and artificial intelligence to the heart signal known as the ECG (Electrocardiogram). We propose an improved morphological feature vector including ST-segment information for heart beat classification by supervised learning using the support vector machine approach. Our system has been tested and yielded an accuracy of 93.33% for the ST episode detection on the European ST-T Database and 96.35% on MIT-BIH Arrhythmia Database for classifying six major groups, i.e. Normal, Ventricular, Atrial, Fusion, Right Bundle and Left Bundle Branch Block beats.
VA North Texas Healthcare System and University of Texas Southwestern Medical Center 4500 S Lancaster Road, Dallas, TX 75216
[email protected] RR Interval
R
R Isoelectric line
ST segment
PR segment
T
P Q
J S
T
P Q
S
J Point
ST Interval
PR Interval QRS Interval
QT Interval
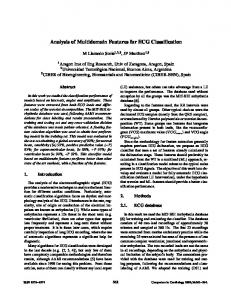
Figure 1.
TQ Interval
Sample two cycle ECG recording with fiducial points marked.
real time [3]. In this paper, we focus on automated ST-segment analysis and automated arrhythmia classification. Our contribution towards diagnosis of cardiac abnormalities is two-fold. First, we propose a simplified real time algorithm based on wavelet processing for the detection of ST-segments and ST-deviation changes, which further help in identifying transient ST-episodes. This would give an immediate evaluation of the patient’s condition in emergency, independent of the patient history. Second, we introduce a novel approach of using the ST-analysis features and correlation matrix between heart beats for classifying each beat by supervised learning. Our classifier distinguishes six classes, i.e. the Normal Sinus rhythm and five most common arrhythmia categories. Every heart beat/ training instance of the classifier is represented with a total of 203 features (morphological features and discrete wavelet coefficients). Our contribution is in employing additional morphological features of ST-segment and correlation coefficients for each arrhythmia class template. In terms of practical use of our approach, our automated detection system can help in indicating any possibility of SCD, much ahead of time. Thus facilitating with wider time-frame for relevant treatment and effectively reduce the SCDs.
I. I NTRODUCTION Coronary Heart Disease (CHD) (also known as ischemic heart disease) is caused when the coronary arteries cannot supply enough blood to the heart due to clogging. It can become catastrophic resulting in myocardial ischemia and infraction with affected myocardium that is reflected in the occurrence of lethal arrhythmias. The Electrocardiogram (ECG) is an electrical recording of the heart behavior and is crucial to investigating cardiac abnormalities in a human. The ambulatory ECG recordings are typically examined visually by a physician for important features. Figure 1 shows a two cycle ECG recording with the fiducial points of importance; P wave, QRS complex and T wave. The heart diseases are clinically diagnosed by the study of ST-T complex [1]. The changes in amplitudes, times and duration on the ST-T can indicate an electrical instability due to increased susceptibility to ventricular fibrillation and thus leading to sudden cardiac death. In particular, the ST-segment is the most diagnostic parameter as it represents a state of unchanged polarization. It begins at the offset of depolarization (QRS) and ends at the onset of depolarization (T wave), in the ECG. Any significant change of this ST-segment level from the isoelectric line indicates an ischemic or infracted heart condition [2]. In view of the length of each recording and the number of recordings in real time clinical cardiology, manual intervention is very time consuming. Automated analysis of the ECG could therefore be a useful technology, especially when performed in
II. P RIOR W ORK Several techniques have been introduced for ECG beat classification in general, and ST-segment analysis of ECG waves in particular. Authors in [4] developed a ST-segment recognition system based on neural networks with large data sets for training and obtained an average accuracy of 95.7% within a 10ms error. However, a large amount of memory is needed for their learning phase. The work in [5] described a hardware configuration for an ECG monitoring device and the detection of ST pattern change. A small dataset of four records from the European ST-T database are used for pattern 1
matching and for evaluating their system. Authors in [6] also proposed an algorithm for ST-segment analysis using the multi-resolution wavelet approach, achieving an accuracy of 97.3% within an error margin of 8ms. Our system indicated a better accuracy using the discrete wavelet transformation. As for beat classification, the approach described in [7] classified only four types of arrhythmia, with a hierarchical decision tree by grouping similar classes together and branching down to finer granularity of classification. A knowledge-based method was proposed in [3] for arrhythmic beat classification, arrhythmic episode detection and classification using only the RR-interval signal. It classified only four classes based on only RR features. In [8], the authors proposed a learning algorithm for analyzing the gray relations between templates and test data set. The database of templates used in this work was large and the system only classified two classes. De Chazal et al. classified the beats by analyzing the RR intervals and ECG morphology features along with heart beat segmentation information [9]. They combined two linear discriminant classifiers to make the final decision. The work presented in [10] uses a hybrid of fuzzy clustering and artificial neural networks to discriminate between different classes of beats. III. ST-S EGMENT A NALYSIS
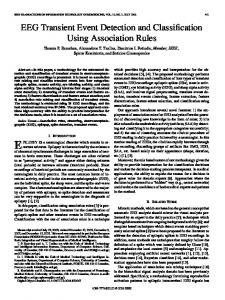
31 sec of |ST Dev|0.1mV
Arbitrary Length
First |ST Dev|