Tahmasseby, Van Nes & Van Oort
Reliability Assessment of Urban Rail Transit Networks; Methodology and Case Study
Shahram Tahmasseby Delft University of Technology Faculty of Civil Engineering and Geosciences Transport & Planning P.O.Box 5048 2600GA Delft, The Netherlands Telephone: +31.15.2784030 Fax: +31.15.2783179 Email:
[email protected] Rob van Nes Delft University of Technology Faculty of Civil Engineering and Geosciences Transport & Planning P.O.Box 5048 2600GA Delft, The Netherlands Telephone: +31.15.2784033 Fax: +31.15.2783179 Email:
[email protected] Niels van Oort HTM Public Transport Company Department of Research and Development P.O. Box 28503 2502 KM The Hague, The Netherlands Telephone: +31.70.3848518 Fax: +31.70.3848476 E-mail:
[email protected]
Date: November, 2008
Word count: Abstract (219) + Text (6027) + Figures/Tables (5)
1
Tahmasseby, Van Nes & Van Oort
2
ABSTRACT Assessments of transit service networks is usually based on a deterministic point of view by assuming that all components of the system perform as planned. In reality however, a large number of regular and irregular variations influences transit services such as variations in service operation, and infrastructure availability. The question is how these phenomena might be taken into account in the transit network assessment. All kinds of events might block infrastructure and thus hamper transit services, and might affect transit services directly as well. As a result transit operators adapt their service network by introducing detours, implementing partial services or even skipping runs. For rail transit networks this requires extra attention, as infrastructure is limitedly available. Finally, travelers might experience extra travel time or they might not be able to make their trip by transit at all. An assessment model is presented that accounts for these mechanisms. A case study for the tram network of The Hague demonstrated that the consequences of events such as bad weather, road works and incidents are quite substantial. Different options for improving transit service reliability are analyzed such as changing the service network configuration or adding infrastructure for facilitating detours or partial services. Results show that providing additional infrastructure improves transit service reliability and even leads to a better overall transit network performance. Keywords: transit networks, infrastructure, assessment model, connectivity reliability
Tahmasseby, Van Nes & Van Oort
3
1 INTRODUCTION For the analysis of transit networks, it is generally assumed that the network performs as planned. In reality, however, there are many disturbances influencing infrastructure networks and transit services. In other words, all kinds of disturbances cause service quality variations and thus affect transit service reliability. These variations are especially critical in rail transit networks due to the fact that they need exclusive infrastructures for operation which is limitedly available as well. This paper intends to assess the reliability of rail bound urban transit networks by considering impacts of stochastic events such as incidents and bad weather. Reliability in transit networks can be classified as schedule reliability, the level in which departure times are according to schedule (1, 2, 3, 4); as travel time reliability, the level to which actual travel times differ from the schedule (5, 6); and as connectivity reliability, which relates to the probability that network nodes are connected and can be reached (7, 8, 9). In this paper we will focus on the connectivity reliability mostly. Looking at the connectivity reliability, a distinction can be made between the supply side and the demand side. On the supply side (the service network), it can be measured as the probability that network nodes are still connected (7, 8, 9, 10). The network is successful, if the existing lines are in operation as planned. In case of disruptions in the system, the probability of service line failures might affect the connectivity reliability. For instance, it can be quantified as the number of service runs that might not reach their destinations. On the demand side, however, travelers might still be able to reach their destination, e.g. using alternative routes in the network. Therefore, from the travelers’ perspective, the connectivity reliability in transit networks might be quantified as the number of trips that were not able to reach their destination (8, 9). On the other hand, if travelers use detours they experience longer travel times, which affects travel time reliability as well. Transit operators can improve service reliability, when designing the network by developing a service network that is less vulnerable, or by providing additional facilities enabling them to maximize connectivity reliability during operations. Typical options for the latter case are infrastructure facilities for shortcuts or short turn facilities in a rail transit network. In case of special situations, such as traffic accidents blocking streets or a brokendown tram blocking a track, transit operators might implement detours in order to continue the affected lines’ operations. In this paper we introduce a methodology for assessing the impact of all kinds of events on connectivity reliability and travel time reliability in transit networks. First, we will discuss several types of events and their impact on transit networks, considering both the infrastructure network and the service network. Next, we discuss how transit operators cope with disturbances and adjust transit services and what the consequences are for travelers. Given these mechanisms, an assessment model will be presented to determine the impact of events on transit network performance. The tram network of The Hague in the Netherlands will be used to demonstrate the potential of this approach. Different options for improving transit service reliability will be analyzed using the assessment model as well, demonstrating that these options not only improve reliability, but also they might lead to a sensible reduction in travel costs.
Tahmasseby, Van Nes & Van Oort
4
2 IMPACTS OF EVENTS ON TRANSIT NETWORKS Events can affect many components of a transit network: infrastructure, service operations, and patronage. If we exclude major calamities such as earthquakes and floods, there are still many events that can affect urban transit service quality. Various weather conditions such as thunderstorms and heavy snow could lead to blocked infrastructure, e.g. due to fallen trees. Heavy rain might reduce the speed of transit vehicles. And in severe weather conditions, cyclists might switch to transit as well leading to a higher patronage. Public events are another type of event. Parts of the city might not be accessible for transit services, while additional demand needs to be facilitated. Furthermore, urban infrastructure needs maintenance, and since it is part of the city it might be affected by other building or maintenance activities for e.g. sewers, cables, et cetera. As a result, infrastructure might be blocked for transit services. Please note that it is possible to schedule these kinds of activities in such a way that their impacts on transportation networks are minimal (11). At a more frequent level all kinds of incidents might reduce capacity or block infrastructure. Traffic accidents might lead to temporary blockades, while transit vehicles themselves might suffer from breakdowns as well. Furthermore, transit operators might have problems for recruiting adequate staff. The dominant pattern for all these types of events is that infrastructure is temporarily blocked, which will affect transit performance. Empirical studies demonstrate the importance of infrastructure availability (12, 13). A Norwegian study (14) shows that infrastructure faults are a major source for delayed and cancelled rail bound services. They show that 30% of the total amount of delay hours in Norwegian railways in 2005 was caused by failures in infrastructures. Infrastructure failures may take place due to different causes; however, construction sites, signal failures and calamities are the main sources of infrastructure failures (15,16). External conditions such as bad weather, incidents, and public events are other sources of infrastructure failures (17,18,19). For instance, heavy snow can block tracks and roads. In this condition, trains and cars can not use the affected infrastructures until snow removal operation. Furthermore, transit services have their own variations in service quality due to variations in driver behavior, traffic conditions, traffic signals, vehicle breakdowns et cetera (18,20). For example, consider the London transit system. London Underground operator reports that they cancel on average 5% of all services almost every day and this rate is even higher during the morning peak period (18). External sources such as bad weather and incidents are factors beyond of a transit operating system affecting service operation. For instance, the same study in London Underground proves that more than half of the services are cancelled in case of a major incident. In spite of the fact that events influence the transport system only temporarily, their impacts might be rather substantial. If a part of the infrastructure network is blocked, transit operations need to be adjusted to maintain service quality. In the next part some adaptive operational adjustments that are made by urban transit operators are discussed.
Tahmasseby, Van Nes & Van Oort
5
3 TRANSIT OPERATIONS IN CASE OF DISTURBANCES In general, transit service providers will try to maintain services as good as possible and restore them quickly in case of disturbances. As such, it is likely that they will attempt to reduce the events’ impacts by appropriate service adjustments. Remedial solutions are limited and they depend on the type of event. For an urban transit service a likely option is implementing detours for the affected lines by diverting the route using the available infrastructure. For bus services such a detour might be easily feasible, while for rail bound transport services the options for detours are likely to be limited. Naturally, due to such detours some stops may not be served during the disturbance. Applying detours as a remedial solution can affect the operational costs for transit operators. Detours require additional driving time and thus additional operational costs. Hence, operators might consider a maximum allowable detour. Applying partial services could be another option. In this case the scheduled services are limited to a shorter route or might even be split in two different route parts, depending on the location of the disturbance. In case of public events, operators might establish dedicated extra services to maintain a proper level of service. Normally, these extra services will be operated between the event’s location and major points of the city such as the central station and the city center. Furthermore, operators might try to maintain the regular service frequency. In case of bad weather conditions the running speed might be reduced, while the dwell time at stops can increase due to higher transit demand. This leads to an increase of the service running times. A case study in Ireland shows that bad weather increases the service running time around 15 % per run (21), in which case it is likely that the frequency will be affected. In order to keep the service schedule as unaffected as possible, the operator might deploy extra vehicles. In severe conditions, it is possible that some services need to be skipped from the schedule; for instance, in case of multiple disturbances along a service line, or in the case of disturbances due to extreme weather conditions. Table 1 outlines the operators’ remedial solutions for some common event types. All of these options lead to minor of major changes in the transit service networks and thus will have consequences for the travelers. TABLE 1 Operators’ Remedial Options in Case of Events Event type Operating remedial solution Line detour Partial services Dedicated services Extra vehicles 9 Incidents 9 9 9 Storm 9 9 9 Black ice 9 9 9 Snow 9 9 9 Thunderstorm 9 9 9 9 Public events 9 9 Vehicle failure 9 9 Road works
Tahmasseby, Van Nes & Van Oort
6
4. CONSEQUENCES FOR TRAVELERS Due to all these types of events, travelers are confronted with service networks that are different than expected. Consequently, they have to adapt their behavior or to accept changes in service quality. If events and their implications for the transit service network are known beforehand, such as public events and road works, travelers could change their travel choices beforehand, such as choosing a different path in the transit network. In the alternative situation that events or their consequences for the service network are not known, travelers will have to deal with changes in the service network during their trip. In the case of detours, they might comply with the additional travel time involved. In other cases, they could adapt their path by walking to another stop or by transferring to another line. In general, this would lead to additional travel time as well. Given the fact that travelers aren’t fully aware of the situation in the transit network, it is likely that they will attach a higher weight to such extra travel time (5). The worst case is that travelers find that the transit service network is no longer able to offer transport services to their destination. In that case they have to reconsider their mode, for instance switching to a taxi, or to reschedule their activities. In other words, they have to cancel their intended transit trip, which from the traveler’s perspective as well as the transit operator’s perspective is highly undesirable. As travelers experience the effect of these events, they might change their appreciation of the transit system on the long term as well, and opt for other modes. Summarizing, there are two main indicators that account for the effects that travelers might experience due to events affecting transit networks: • Additional travel time; • Number of cancelled transit trips. 5 MODELING FRAMEWORK The previous sections gave a description on the way all kinds of events might affect transit service performance. In order to make a systematic analysis of the consequences of such events, an assessment model has been developed. The main focus of the model is assessing the transit service network connectivity reliability due to stochastic events and the corresponding consequences for travel time reliability. The model simulates the performance of a specific transit network given the probabilities of all kinds of events. The output of the model are indicators of the performance in regular conditions, such as travel times per OD-pair and operational costs, plus a set of indicators for transit service network reliability. Typical indicators are the variation in travel times per OD-pair, number of cancelled transit trips, line vulnerability and variation in link loads. At a more aggregate level total network costs is determined which is the sum of all cost components. Please note that in this case travel time is monetized using a value of time. Equation (1) shows the mathematical formulation of the aggregate network assessment criterion in which the first part represents the deterministic components and the other parts express the cost components associated with service reliability: C N = (Ct + OC + IC ) + (Cte + Ctc ) + (OCe ) + ( ICe ) (1)
Tahmasseby, Van Nes & Van Oort
7
Where: CN = Ct = OC= IC= Cte= Ctc= OCe= ICe=
Total network costs; travel costs; service operation costs; infrastructure investment and maintenance costs; extra travel costs in case of events; trip cancellation costs in case of events; extra operation costs in case of events; extra investment costs for building and maintaining extra infrastructure facilities.
The model can be split in 5 stages: • Generating events; • Determining impact on the infrastructure network; • Determining impact on transit demand; • Determining impact on the transit service network; • Determining the impact for travelers. In the first stage the model creates events for a certain period of time, e.g. a year. Different events with their specific time intervals and durations are generated given appropriate parameters. For determining the interval between events an exponential distribution is used (22), while for the duration of the events a lognormal distribution is applied (23). Event types that are considered are bad weather (storm, black ice, and heavy snow), public events, road works, traffic incidents, and vehicle breakdowns. Seasonal effects can be accounted for. The events are sorted along the time axis, so that for each moment in time it is known whether there is a disturbance and if so, which type(s). Please note that multiple events might take place at the same time. Furthermore, the correlation between bad weather and incidents is considered. Bad weather influences the frequency of traffic accidents by affecting both the volume of traffic, and therefore the number of vehicles exposed to risk, and the risk per unit of travel (24, 25). The second stage determines which links of the infrastructure network are affected by the events. A Monte-Carlo approach is used to select failing links, while for simplicity sake no correlation between failing links for minor events such as incidents is assumed. The probability of link affections depends on the link length. However, other factors such as link sensitivity to failures can be included in this mechanism. For events such as snow and storm, a number of links within a part of network are affected simultaneously; whereas for events such as incidents only a single link is blocked at the time of incident. In case of public events, we assume predefined locations. In the third stage the impacts of events on transit demand are determined. The main focus is the effect of bad weather and public events. As indicated before these events can increase transit demand considerably. Data from travel surveys might be useful to determine these effects. The fourth stage considers operator adjustments and remedial solutions previously discussed in Section 3. A systematic procedure is followed in which first is checked whether given the available infrastructure and type of event, it is possible to provide
Tahmasseby, Van Nes & Van Oort
8
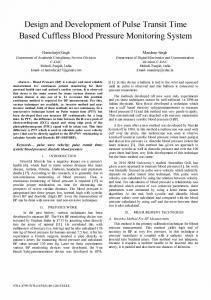
detours. If not, the option of introducing partial services is analyzed. Finally, if none of the remedial solutions are feasible, the service is cancelled during the period at hand. Please note that the transition between the states of the service network is not part of the analysis. In the fifth stage new transit paths in case of disruptions are determined. Given these new paths, travelers will choose their new routes through the network. Pre-trip decision making is considered for expected events such as road works, or public events, while en- route decision making is taken into account in case of unexpected events such as incidents, and vehicle breakdown. For choice modeling a Path-size logit model is used (26). If during an event a destination cannot be reached, the transit trip is assumed to be cancelled. At the end of each event, travel costs including extra travel costs as well as trip cancelation costs and operation costs including extra operation costs are computed. 6 CASE STUDY In order to demonstrate the potential of the assessment model, we use the case study of the tram network of the city of The Hague in the Netherlands. Figure 1 shows a schematic illustration of the tram network including nodes number and links number (Bold italic numbers). It consists of 12 service lines with a total length of 135 km. The network can be characterized as a radial network with a grid structure in the city center. The tram network has a high percentage exclusive right of way (85%). The average tram speed is 20 km/hour. The operation time is 18 hours (from 6 o’clock till 24 o’clock). The transit demand pattern is known by traveler’s surveys (27). About 140 million trips are made annually for the transit network, of which about 90 million are made by tram. Transit demand is primarily center oriented, while some sub centers (e.g. the cities of Delft, Wateringen, Scheveningen and Leidschendam) also attract their share of the demand. The waiting time, which is assumed to be half of the headway (28), is 5 minutes. The average passenger journey time by transit including the waiting time and the probable transfer time in the entire network is approximately 45 minutes. HTM, The Hague service operator, as well as the local authorities would like to achieve a reliable tram service network. Obviously, the bus network might be used as a back up in case of emergencies. However, due to the tendency to tender different networks independently, it is preferred to achieve maximum service reliability for each sub network. In the analysis we will first make an assessment of the current situation. Next, we will analyze the impact of measures that operators or authorities might apply to improve transit service reliability. Both measures related to the service network itself as well as to the infrastructure network will be considered. Apart form the network, the main input are the parameters describing the frequency and duration of each type of event, which are based on interviews and realistic estimates for the Dutch climate. The increase in transit ridership in case of bad weather follows from the Dutch National Travel Survey. The value of time for the additional travel time is twice the regular travel time valuation, i.e. €20/hour instead of €10/hour. This rate has been found in several empirical researches (5, 29). A penalty for cancelled transit trips is included in the travel costs as well, using a cancelation penalty based on the origindestination distance.
Tahmasseby, Van Nes & Van Oort
9
North Sea
SH 33
N
7
13
KS 36 13
30
21
8
4
6
7
8
9
23 29 UH 37 VR 38
12 14
3
35
15 22
32
16 33
23
37
36 64
H
Wateringen WT 39 39
4
11
la ol
City Center 12
16
17
18
HS46r o 38 po S s 25
nd
27 47 28
40
31 45
Central station
18 CS 47 19 20 19 LN45 21 22 24 67 20 LL 44 26 VS 43 Leidschendam 50 61 48
46
29
6
5
17
65
10 24
14
SN 32
8
ST 48
LS 35
1
2
3
2 DD 34
Scheveningen
1
30 49 NO 42
62 63
DU41 DT 40
Service line Infrastructure not used by service line
Delft
Stop Short turn
Legend FIGURE 1 Tram network of The Hague (Reference network)
Tahmasseby, Van Nes & Van Oort
10
7 ASSESSMENT OF THE CURRENT PERFORMANCE To have an overview of the current performance of the network, the network is analyzed for several years (20 different simulating runs representing 20 different years) in which all kinds of events take place On average the network suffers from disturbances in 102 days of a year (28%). Due to disturbances, 89% of the trips are made with less than 10 minutes delay. Moreover, in terms of the connectivity reliability about 2.1 % of the annual trips are cancelled due to disturbances (1,890,000 passenger trips). The disturbances will also raise travel costs on average 2.0 % due to the extra travel time imposed to travelers. At a more detailed level we can look at the way the tram lines are affected, the impact of the detours on the links’ load (passenger) and the origins that suffer highly from transit trip cancellation. Figure 2-A illustrates the number of affections per line due to disturbances in a year. It clearly shows that some lines are more vulnerable than others. It appears that there is a strong correlation between vulnerability and the line length. For example, line 1 with length of 19.7 km and the combined line 15+16 with length of 20.1 km suffer from events about 2.5 times and 2.9 times respectively as much as line 3 having a length of 8 km. This is an obvious phenomenon since long lines are more highly in exposure of events’ consequences compared to short lines. Furthermore, if a line is affected by more than one event simultaneously, it might even be more difficult to provide detours or other adjustments. This might influence transit trip cancelation rates as well. Figure 2-B shows the relative difference in the link’s load per link due to stochastic events compared to the situation without events. It shows that some links are used up to 23% more in case of non recurrent events (e.g. link 9-10). This means these links are used as detours when other links are blocked. The links which are used less in non recurrent conditions are links without any function as a detour. Most of these links are located at the beginning or the end of the service lines. Therefore, these links indicate risk for transit trip cancellation as well. Finally, Table 2 outlines the ten most vulnerable origins in terms of the connectivity reliability expressed by transit trip cancellation. The result shows that terminal Delft Tanthof is the most vulnerable one. The results clearly shows that the most vulnerable nodes are terminal points located at the end of service lines and do not have any alternatives when their corresponding lines are affected. This finding is in line with analysis of the link loads.
Tahmasseby, Van Nes & Van Oort
11
350
300
No. of Affections
250
200
150
100
50
0
Line 1
Line 2
Line 3
Line 4
Line 6
Line 9 Line 10 Line 11 Line 12
Line Line 17 Line 19 15+16
Figure 2-A: The Hague tram lines' vulnerabilities per year due to non recurrent events 25.0%
Relative change (%)
20.0%
15.0%
10.0%
5.0%
0.0% 1
3
5
7
9
11 13 15 17 19 21 23 25 27 29 31 33 35 37 39 41 43 45 47 49 51 53 55 57 59 61 63 65 67
-5.0%
-10.0%
Link No. Figure 2-B: Relative changes in links' passenger load in The Hague tram network due to non recurrent conditions
FIGURE 2 The Hague tram network assessment in non recurrent conditions
Tahmasseby, Van Nes & Van Oort
12
TABLE 2 Connectivity Reliability: The Ten Most Vulnerable Nodes Origin number Origin name The annual percentage of trip cancelation (mean value) 40 Delft Tanthof 7.0% 43 Voorburg Station 5.9% 45 Leidschendam Noord 5.6% 41 Delft University 5.3% 31 Delft Station 4.6% 34 Duindorp 4.2% 44 Leidschenhage 3.8% 36 Kraaijenstein 3.7% 20 Essesteijn 3.4% 30 Scholekstersingel 2.9% 8 IMPROVING SERVICE RELIABILITY OF THE TRANSIT NETWORK The assessment of the current network shows that quite a lot of trips (2.1% of all trips) should try to find an alternative to reach their destination or should reschedule their trips. Furthermore, the more detailed analysis indicated several network components that be improved. In this section we will analyze different options to improve transit service reliability. In the first option, it is studied whether splitting line 1 might improve the connectivity reliability, as short lines tend to be less vulnerable. The other three options all relate to adding extra infrastructure which enables the operator to provide detours in case of non recurrent events. 8-1 Enhancing Reliability by Changing Service Line Configuration In this analysis we focus on tram line 1 which was shown as one of the most vulnerable lines. Moreover, it as serves several of the most vulnerable origins. One of the reasons that line 1 is so vulnerable is that it one of the longest tram lines, which increases the probability of suffering from two or more events simultaneously. In those cases, it proves to be nearly impossible to maintain a proper service level. Thus, splitting the line into two parts might reduce this probability substantially. Disadvantage, however, is that travelers might have to transfer which increases their travel time consequently. To improve the reliability of line 1, we split it into two radial lines as follows: • Line 1-A: From Scheveningen (SN32) to Hollands Spoor (HS46) in the city center with the length of 7.2 Km. • Line 1-B: From to Hollands Spoor (HS46) to Delft Tanthof (DT40) with the length of 12.5 Km. The assessment of this option shows that the results are according to our expectations. Changing line 1 to two radial lines will result in 1% reduction in the total number of cancelled trips in the entire tram network. Of course, for Delft Tanthof, which is directly served by line 1, this rate is much higher (22% or around 416,000 trips).
Tahmasseby, Van Nes & Van Oort
13
Therefore, no longer is station Delft Tanthof most vulnerable station in the network. However, splitting line 1 increases travel costs due to additional transfers of through going passengers. Thus, splitting line 1 will enhance the connectivity reliability for the tram network while increasing travel costs as well. The net result proves to be negative for total network costs. This finding is in line with more theoretical analyses which demonstrated that different service network designs might improve service reliability, but tend to lead to higher total network costs (12,13). Apparently, the performance in regular conditions is dominant for the overall network assessment. 8.2
Extra Infrastructure to Enhance Connectivity Reliability
In this part, we investigate the role of additional infrastructures on improving the reliability of the tram network. We assess separately the impacts of common additional infrastructures namely bypasses, shortcuts, and turn facilities. 8.2.1 Scenario 1: Bypass Basically, a bypass is used as backup for vulnerable links, thus enabling the operator to provide detours in case of events. The HTM planning department suggested an at-grade bypass for link 19, an elevated tramway which is heavily used by two tramlines and two light rail services. Since, this link is the only connection between Leidschendam and The Hague, a blockade of this link thus leads to transit trip cancelation as be seen in Table 2: three origins are located in Leidschendam area (origins: 20, LL 44, LN 45). The at-grade bypass is connected with the at-grade tram network near Central Station, which also facilitates for detours for the tram tunnel (link 28). This link proves to be very vulnerable as well. The location of the new bypass is illustrated in Figure 3-A. Analysis of the network performance including this bypass shows 9% reduction in the total number of cancelled transit trips. In some simulated years this rate rises even up to 24%. In other words, on average 170,000 more passenger trips are made annually. This is not only due to the fact that Leidschendam area may no longer be temporarily disconnected from the tram network, but also due to the lower probability that runs of tramlines 2 and 6 are cancelled. Furthermore, because of this bypass, tramlines 2 and 6 can maintain service quality for a longer period and many travelers in other parts of the city do not need to make a detour or to choose alternative routes. So both the connectivity reliability and the travel time reliability are substantially improved. The net result is that the extra travel costs decreases with 4%.Also as an overall estimation, despite of the fact that the infrastructure costs for an at-grade tramway is rather high, the total network costs decreases on average with 0.4%.
Tahmasseby, Van Nes & Van Oort
Tunnel
14
The bypass
The shortcut The shortcut
13
23
Figure 3-A: Detail of the network between Central Station and eastern part
Figure 3-B: The shortcut connecting terminals KS 36 and LS 35
U turns U turns
Released right turn
Figure 3-C: Potential locations for turning facilities ( tram line 1)
FIGURE 3 Infrastructure facilities to enhance reliability of tram network of The Hague 8.2.2. Scenario 2: Shortcuts Connecting service lines with shortcuts provides a substitution opportunity for vulnerable service lines in case of link failures. In this scenario we introduce an additional shortcut infrastructure that connects two vulnerable lines, being tram lines 2 and 3. The origins
Tahmasseby, Van Nes & Van Oort
15
located at the end of these lines have a high level of trip cancelation (Loosduinen (LS 35) and Kraayenstein (KS36) (see also table 2)). Figure 3-B shows the lay-out of the network including the shortcut between these lines. Note that this shortcut could be a single track since it is not heavily used like the bypass and thus, its construction cost could be lower than for the bypass. The shortcut will be used in case of disturbances at links 13 or 23. Thus, the corresponding lines can be diverted from the original path, use another track, and still terminate at their original terminal via the shortcut and vice versa. Network assessment results show that there is 2.4% reduction in the total number of cancelled trips on average (around 45,500 trips). This rate rises even up to 12 % for some simulated years. However, since more trips are made using a detour, extra travel costs increase about 1.5%. The impact of shortcut infrastructure in terms of the connectivity reliability is smaller than in case of the bypass. However, the infrastructure cost could also be lower, which would lead to a reduction of the total network costs of 0.1% on average. 8.2.3 Scenario 3: Turn facilities The last option considered in this analysis is the introduction of a turn facility to increase the flexibility of the operator to maintain transit service reliability. A turn facility could facilitate detours, while U-turn facilities allows for applying partial services. In this case, we focus once again on line 1, being one of the most vulnerable tram lines. On the branch between Delft and The Hague, four turning facilities are considered (figure 3- C): • U-turn facility in link 66; • U-turn facility in link 47; • U-turn facility in link 50; • Turn facility at node 30, which is also served by lines 15 and 19. The first three options have been selected based on lack of U-turn facilities on the corresponding links. Thus, if there is a blocked in those links, there will be no possibilities for short-turn and then continuing operation. Facilitating the last option with right and left turn capability at node 30 provides detour alternative for tram line 1. In this case, it can be diverted from the original path and then traverses through link 48 and 62 and finally returns to the original itinerary. This will be valid for the reverse direction as well. Analysis of these four options shows that that a turn facility at node 30 is most effective. The assessment model shows that adding this turn facility can reduce the number of cancelled transit trips. This reduction in the total number of canceled trips is around 6.1% on average (around 115,500 trips). For some simulated years this rate rises even up to 22.9%. Also, the turn facility decreases extra travel costs down to 8.9% with the mean value of 2.6%. This is again due to the longer period of operation of line 1 in the rest of the city. These reliability benefits yield a 0.3 % decrease in total network costs for The Hague tram network.
Tahmasseby, Van Nes & Van Oort
16
9 CONCLUSIONS In this paper we analysed the impact of all kinds of events on transit service reliability, and especially the connectivity reliability. An assessment model is presented that describes the way events affect infrastructure availability, the network adjustments by operators such as detours and partial services, and the consequences for travellers. Output of the model is among other matters, assessment criteria as cancelled transit trips and extra travel costs. A case study for the tram network of The Hague showed that the impact of events like bad weather, public events, road works and incidents is quite substantial. More than 2% of the trips can not be made using the tram network, while more than 10% of the travellers are confronted with an additional travel time of more than 10 minutes which is around 22% of the average journey time in the network. Long lines proved to be more vulnerable than short lines, while terminal nodes are more likely to be temporarily disconnected from the rest of the network. Different options to improve transit service reliability were studied: splitting a long service line, adding a bypass, introducing a shortcut, and adding turn facilities. All options considered yielded an improvement of transit service reliability. Obviously, the size of the effects depends on the examples chosen for this analysis. Furthermore, local effects are more substantial than effects at the overall network level. Despite these limitations, the examples show that the connectivity reliability can be improved substantially. Reductions in cancelled transit trips range between 1% and 9%. Additionally, the experiments show that higher connectivity reliability is also beneficial for the travel time reliability as services can be maintained over a longer period of time. These results confirm the findings of earlier analyses for a hypothetical radial ring network (13). Therefore, when designing transit networks, planners should consider the impact of events on service quality. They can reduce the vulnerability of the service network. They can also create flexibility for operators to cope with the effects of events by providing all kinds of infrastructure facilities, such as bypasses, shortcuts and turning facilities. The model presented in this paper proved to be a suitable tool to assess such network options. Further research could elaborate on the effects of combined transit networks, such as a mixed bus/tram network. Moreover, it appears to be worthwhile to see whether the methodology developed could be extended to heavy rail networks in which operational adjustments are constrained by safety measures. ACKNOWLEDGEMENT This study is supported by the Next Generation Infrastructures Foundation and by the Transport Research Centre Delft. REFERENCES 1. Hall, R.W., Vehicle scheduling at a transportation terminal with random delays en route, Transportation Science, Vol.19, 1985, pp.308-320. 2. Carey, M., Reliability of interconnected scheduled services, European Journal of Operational Research, Vol.79, 1994, pp.51-72. 3. Carey, M. Ex Ante Heuristic Measures of Schedule Reliability. Transportation Research Part B: Methodological, Vol.33, 1999, pp.473-494.
Tahmasseby, Van Nes & Van Oort
17
4. Hallowel, S.F., and P.T. Harker. Predicting on-time performance in scheduled railroad operations: methodology and application to train scheduling. Transportation Research Part A: Policy and Practice, Vol.32, 1998, pp.279-295. 5. Rietveld, P., F.R. Bruinsma, and D.J. van Vuuren. Coping with unreliability in public transport chains: A case study for the Netherlands. Transportation Research Part A: Policy and Practice. Vol.35, No. 6, 2001, pp.539-559. 6. Tseng, Y.Y., P. Rietveld, and E. Verhoef. A meta-analysis of valuation of travel time reliability. Colloquium Vervoersplanologisch Speurwerk, Part3, CVS, Rotterdam, 2005, pp. 811-830. 7. Asakura, Y., E. Hato, and M. Kashiwadani. Stochastic network design problem: An optimal link improvement model for reliable network. In proceedings of the 1st international Symposium on Transportation Network reliability, Kyoto, Japan, 2001. 8. Kurauchi, F., H. Shimamoto, Y. Ieda., and M.G.H. Bell. Evaluation of public transport connectivity reliability using capacity constrained transit assignment model. In Proceedings of the 2nd international Symposium on Transportation Network Reliability, Christchurch, NZ, 2004. 9. Al-Deek, H., and E. B. Emam. New methodology for estimating reliability in transportation networks with degraded link capacities. Journal of Intelligent Transportation Systems, Vol.10, No.3, 2006, pp.117-129. 10. Bell, M.G.H. A game theory approach to measuring the performance reliability of transport networks. Transportation Research Part B: Methodological. Vol. 34, 2000, pp.535-545. 11. Higgins, A., L. Ferreira, and M. Lake. Scheduling rail track maintenance to minimise overall delays. In Proceedings the 14th International Symposium on Transportation and Traffic Theory. Jerusalem, Israel, 1999. 12. Tahmasseby, S. R. Van Nes., & N. Van Oort. Public transport network design and reliability, In Proceedings of the 3rd International Symposium on Transportation Network Reliability, The Hague, 2007. 13. Tahmasseby, S. and R. Van Nes. Robustness of public transport networks. Proceedings of Urban Transport XIII: Urban Transport and the Environment in the 21st Century, Coimbra, 2007, pp.337-346. 14. Veiseth, M., N. Olsson, and I.A.F. Saetermo. Infrastructure’s influence on rail punctuality, Proceedings of Urban Transport XIII: Urban Transport and the Environment in the 21st Century, Coimbra, 2007, pp.481-492. 15. Muller, T. and P. Furth. Integrating bus service planning with analysis, operational control, and performance monitoring. In: Proceedings 10th ITS Annual Meeting, Boston, 2004. 16. Shimamoto, H., F. Kurauchi, J.D. Schmöcker, and M.G.H. Bell. Evaluating critical lines and stations of London’s Underground network Using public transport assignment model. In Proceedings of the 3rd International Symposium on Transportation Network Reliability, The Hague, 2007. 17. Yin, Y., and H. Ieda. Assessing performance reliability of road networks under non-recurrent congestion, In Transportation Research Record: Journal of the Transportation Research Board, No.1771, Transportation Research Board of the National Academics, Washington, D.C., 2001, pp.148-155.
Tahmasseby, Van Nes & Van Oort
18
18. Schmöcker, J.D. and M.G.H. Bell. The PFE as a tool for robust multi-modal network planning. Traffic Engineering and Control, Vol. 44(3). 2002, pp.108-114. 19. Immers, L.H., J. E. Stada, I. Yperman, and A. Bleukx. Robustness and resilience of transportation networks. In: Proceedings of the 9th International Scientific Conference MOBILITA, Bratislava, Slovenia, 2004. 20. Van Oort, N. & van Nes, R., Reliability of Urban Public Transport and Strategic and Tactical Planning. In Proceedings of the 9th TRAIL Congress - TRAIL in Motion, Rotterdam, 2006. 21. Hofmann, M. and M. O. Mahony. The impact of adverse weather conditions on urban bus performance measures. In Proceedings of the 8th International IEEE Conference on Intelligent Transportation Systems. Vienna, 2005. 22. Tsakiris, G. and G. Agrafiotis. Aggregated runoff from small watersheds based on stochastic representation of storm events. Water resource management. Vol.2, 1989, pp.77-86. 23. Giuliano, G. Incident characteristics, frequency, and duration on a high volume urban freeway. Transportation Research Part A: Policy and Practice. Vol.23, No. 5, 1989, pp.387-396. 24. Codling, J.P. Weather and road accidents. In Climatic Resources and Economic Activity, David & Charles, Newton Abbot, 1974, pp.205-222. 25. Weather Information for Surface Transportation (WIST)—National Needs Assessment Report. Report No. FCM-R26-2006 , Office of the Federal Coordinator for Meteorological Services and Supporting Research, National Oceanic and Atmospheric Administration, U.S. Department of Commerce, Washington, D.C., 2006. 26. Ben-Akiva, M.E., and M. Bierlaire, Discrete choice methods and their applications to short term travel decisions, Handbook of Transportation Science, Kluwer Academic Publishers, Dordrecht, The Netherlands. 27. HTM, Department of Research and Development. Public Transport Research Haaglanden, The Hague (in Dutch), 2004-2005. 28. Tisato, P. Service unreliability and bus subsidy. Transportation Research Part A: Policy and Practice. Vol.32, 1998, pp.423-436. 29. British Rail, Passenger Forecasting Handbook. British Rail, Euston, London, 1986.