2011 IEEE Symposium on Industrial Electronics and Applications (ISIEA2011), September 25-28, 2011, Langkawi, Malaysia
Transmission Loss Minimization Using SVC Based on Particle Swarm Optimization 1
1
2
Siti Amely Jumaat Faculty of Electrical and Electronics Engineering
Ismail Musirin, 3Muhammad Murtadha Othman, 4
Universiti Tun Hussein Onn Malaysia 86400 Parit Raja, Batu Pahat, Johor, Malaysia 1
[email protected]
2,3
Faculty of Electrical Engineering Universiti Teknologi MARA Malaysia 2
40450 Shah Alam, Malaysia
[email protected],
[email protected] 4
Abstract— This paper describes optimal sizing of static var compensator (SVC) based on Particle Swarm Optimization for minimization of transmission losses considering cost function. Particle Swarm Optimization (PSO) is one of the artificial intelligent search approaches which has the potential to solve such a problem. For this study, static var compensator (SVC) is chosen as the compensation device. Validation through the implementation on the IEEE 26-bus system shows that the PSO is found feasible to achieve the task. The simulations results are compared with those obtained from the Bee Algorithm (BA) technique in the attempt to highlight its merit. Keywords- FACTS devices, optimal sizing, particle swarm optimization, transmission loss, minimization, static var compensator.
I.
INTRODUCTION
Nowadays, the demands for electrical energy have increased continuously yearly. The installation of new transmission networks or new power plants can solve these demands. However, there are some limitations to develop new system, i.e. installation cost, environment impact and pollution control, and the land acquisition. One of alternative solutions to respond to the demands is by using flexible alternating current transmission system (FACTS). The FACTS is a concept proposed by N.G. Hingorani [1] as a well-known term for higher controllability in power systems by means of power electronics devices. FACTS devices can provide benefits in increasing system transmission capacity and power flow control flexibility and rapidity [2]. Population base, cooperative and competitive stochastic search algorithms are very popular in this recent year in the research area of computational intelligence. Genetic Algorithm (GA) [6] and Evolutionary Programming (EP) [7] techniques are found to been established search algorithms and has been successfully implemented in solving the complex
978-1-4577-1416-0/11/$26.00 ©2011 IEEE
Hazlie Mokhlis
419
Department of Electrical Engineering Faculty of Engineering University of Malaya 4
[email protected]
problem effectively. PSO algorithm originally is developed by Kennedy and Eberhart based on the social behaviors of animal swarms (e.g. bird blocks and fish schools) [17]. PSO applied for solving various optimization problems in electrical engineering [2, 3, 18-20]. Optimal locations of different types of FACTS devices in the power system has been attempted using different EP techniques such as Hybrid Tabu Search and Simulated Annealing (TS/SA), GA, Repetitive Power Flow method (RPF), BA and Fuzzy decision making and PSO. The maximum increase in system loadability is achieved by GA and PSO techniques with an optimal numbers of five TCSCs devices in the system. From the results it is shown that TCSC device has improved the line flows even to their thermal limits [3]. With multitype of FACTS devices installed; the reduction in total generator of fuel cost is more than the individual installed FACTS devices [4]. The hybrid TS/SA converges at a faster computation time. In [5], BA does not require external parameters such as cross over rate and mutation rate. BA gives better result in terms of speed of optimizations and accuracy of the results. BA needs the large number of trials. On the other hand, GA based approach is proposed to determine the suitable types of FACTS devices and evaluate the total costs system [6]. EP in [7] is used to identify the location of four FACTS devices. Optimal Power Flow using GA can also used to obtain the optimal locations of SVCs. The results shown that this method can be used to minimize the total cost function, including generations cost of power plants and investments costs in [8]. In [9], GA and PSO are used to optimize the parameters of TCSC. However, PSO have more advantageous than the GA. PSO gives a better balanced mechanism and better variation to the global and local exploration abilities. Moreover, it can be applied to solve various optimization problems in power system such as power
2011 IEEE Symposium on Industrial Electronics and Applications (ISIEA2011), September 25-28, 2011, Langkawi, Malaysia
system stability enhancement and capacitor placement problems [10]. This paper presents PSO technique for loss minimization in power system by using SVC. PSO was adopted to optimize the SVCs sizing to be installed in power transmission network. Placement of SVC is done empirically as the pilot study. The PSO and BA techniques which performed on the IEEE 26-bus RTS have indicated that the proposed methods are found to be crucial in loss minimization scheme. II.
MATERIAL AND METHODS
Flexible AC Transmission Systems (FACTS) devices have several types namely: thyristor controlled static compensator (TCSC), static var compensator (SVC), unified power flow controller (UPFC), static compensator (STATCOM), and thyristor controlled phase shifter transformer (TCPST) [1112]. The SVC is a shunt type FACTS device which defined as a shunt connected static var generator or absorber whose output is adjusted in order to exchange the capacitive or inductive current to maintain or control specific parameters of the power system, typically the bus voltage [13]. The SVC can inject or absorb its reactive power (QSVC) at a chosen bus. It injects reactive power into the system QSVC < 0 and absorbs reactive power from the system if QSVC > 0 [14]. The working range of SVC is between +10MVar and +100MVar [21]. The SVC is modeled as a generator or absorber of reactive power as shown in figure 1. It is modeled as an ideal reactive power injection at bus i, as shown in figure 2. The injected power at bus i is: [15 - 16]. ∆Qis = QSVC (1)
Qmin ≤ QSVC ≤ Qmax
Where IC = the installation cost of SVC devices in [US$], CSVC = the cost of SVC devices in [US$/KVar] Installation of SVC device can be calculated using the cost function given by [2, 6, 15]. CSVC = 0.0003S2 − 0.3051S+ 127.38[US$/KVar] S = |Q − Q | 2 1
(3) (4)
w
here S = operating range of SVC in [MVar] Q1 = reactive power flow through the branch before SVC installation. Q2 = reactive power flow through the branch after SVC installation. III.
PARTICLE SWARM OPTIMIZATION (PSO)
The PSO provides a population-based search procedure in which individuals called particles and changes their positions. The position of each particle is presented in X-Y plane. Each particle moves to the new position using velocity according to its own experience as called Pbest. Gbest is the overall best value obtained so far by any particle in the population. By time to time, the PSO consists of velocity changes of each particle towards its Pbest and Gbest [18-19]. Each particle tries to modify its current position and velocity according to the distance between its current position and Pbest, and the current position and Gbest. After finding the best values the particle updates its velocity and position. Velocity of each particle can be modified by equation (5) [2, 3, 20]. v ik + 1= w × v + c1 × rand 1 × ( Pbest − sik ) i (5 ) + c 2 × rand 2 × (Gbest − s ik ) i where
Figure 1 Block diagram of SVC
v ik + 1 = velocity of particle ι at iterations w = weight function c1 and c 2 = weight coefficien t both equal to 2 rand 1 and rand 2 = random number between 0 and 1 s ik = current position of particle i at iteration k Pbest = best position of particle i - th up to the
Figure 2 Mathematical model of SVC
current iteration
A. Cost of Installation The cost of installation of SVC devices has been mathematically formulated and given by the following equation [2, 12]:
IC = CSVC × S × 1000
(2) .
420
Gbest = best overall position found by the particle up to the current iteration.
Weight function is given by (6) [2, 3, 14, 20] w − wmin w = wmax − max × iter itermax
(6) .
2011 IEEE Symposium on Industrial Electronics and Applications (ISIEA2011), September 25-28, 2011, Langkawi, Malaysia
where The SVC installations in the transmission system to reduce the transmission loss in the system have been conducted at several load conditions subjected to buses 6, 10, and 13. The simulation was done in MATLAB and several buses were subjected to load variations in order to realize the effect of SVCs installation with PSO as the optimization approach. Three SVCs were installed at bus 9, 22, and 24 and assigned as x1, x2 and x3. These buses are the weak load buses in the system; having among the lowest in maximum loadability condition [21].
wmax = initial weight equal to 0.9 wmin = initial weight equal to 0.4 itermax = maximum iteration number, and iter = current iteration number. The new position can be modified (7) sik + 1 = sik − vik + 1 (7) . The computation procedure for the developed PSO algorithm takes the following steps [10]:
A. Transmission Loss Reduction with SVC Installations. Results for transmission loss reduction when load i.e. buses 6, 10 and 13 are subjected to load variation are tabulated in Table 2, 3 and 4. The sizing of SVCs to achieve loss reduction at several loading conditions can be referred to the same table.
Step 1: Generation of initial condition of each particle. Initial searching point (si0) and velocities (vi0) of each particle are usually random within it range. The current searching point is set to Pbest for each particle. The best evaluated value of Pbest is set to Gbest, and the best value is stored.
TABLE 2 TRANSMISSION LOSS REDUCTION LOAD VARIATION AT BUS 6.
Step 2: Evaluation of searching point of each particle. The objective function is evaluated for each particle. If the value is better than the current Pbest of the particle, the Pbest value will be replaced by the current value. If the Pbest value is better than the current Gbest,Gbest will be replaced by the best value and the best value is stored.
Loading Condition (Mvar)
Step 3: Modification of each search point. The current searching point of each particle is updated using (5), (6) and (7). Step 4: Checking the exit condition. The current iteration number reaches the pre-determined maximum iteration number as the stopping criterion. Otherwise the process proceeds to step 2. IV.
without SVC
with SVC
10
15.3850
14.4923
20
15.4610
14.5013
30
15.5420
14.4873
40
15.6270
14.4634
50
15.7160
14.4918
SVC sizing (Mvar)
70.1274 53.3082 35.7547 93.6702 15.6589 37.6245 89.7408 33.1746 51.7156 92.7904 38.7134 35.5901 77.3363 33.2339 27.9203
Cost SVC
IC
(US$/KVar)
103 (US$)
127.1079
11.3470
127.0875
12.1970
127.0585
13.4010
127.0254
14.7810
127.0070
15.5480
TEST RESULTS
In order to realize the effectiveness of the proposed PSO technique, the IEEE 26-bus system was tested in order to find the optimal sizing of SVC. The line data and the bus data of the IEEE 26-bus system are given in [21]. The parameters of the optimization algorithm are listed in Table 1 [2, 3, 14, 20].
For instance in Table 2 with loading condition of 50MVar, the transmission loss has been reduced from 15.7160MW to 14.4918MW. In order to achieve this, the sizing of SVCs are 77.3363MVar, 33.2339MVar, and 27.9203MVar as indicated in the table. The cost of installation at this scenario is 15.5480 thousand US$. From Table 2 it is observed that the value of transmission losses is decreased rapidly and the cost of installation is increased accordingly as the reactive power loading is increased. It is also shown that, with the installation of SVC the transmission loss of the bus for all loading condition has been reduced significantly. It is pretty obvious that, with the installation of SVC optimized using PSO, the transmission losses has been able reduced at all loading conditions.
TABLE I PARAMETERS OF OPTIMIZATIONS TECHNIQUES Parameters
PSO
Population Size
5, 10, 15, 20
Inertial Weight, w
0.9 - 0.4
Constant, C1
2
Constant, C2
2
Number of iteration
50
Rand1
0 to 1
Rand2
Total Power Loss (MW)
0 to 1
421
2011 IEEE Symposium on Industrial Electronics and Applications (ISIEA2011), September 25-28, 2011, Langkawi, Malaysia
TABLE 3 TRANSMISSION LOSS REDUCTION LOAD VARIATION AT BUS 10 Loading Condition (Mvar)
10
20
30
Transmission Loss (MW) without SVC
with SVC
15.6050
14.4564
15.6820
15.7650
14.3921
14.4944
40
15.8540
14.5080
50
16.3940
14.4811
SVC sizing (Mvar)
37.9996 68.1471 49.0322 53.4529 62.2557 36.3690 52.1386 38.2926 67.7320 92.2504 92.4660 71.8296 80.8699 45.4359 31.2545
Cost SVC
IC
(US$/KVar)
103 (US$)
127.0300
145.910
technique can be optimizing the transmission loss lower than PSO. However the different results can be observed at load condition of 40MVar and 50Mvar. From Table 5, at loading condition of 50MVar; PSO managed to reduce the transmission loss from 15.7160MW to 14.5014MW, while BA managed to reduce the transmission loss to 14.5919MW. From this simulation shows that the result using by PSO is lower than the BA it which indicates the capability of PSO throughout the process. TABLE 4 TRANSMISSION LOSS REDUCTION LOAD VARIATION AT BUS 13
126.9869
126.9928
163.800
161.360
126.9699
170.900
126.7975
242.550
The sizing of SVCs to achieve optimal loss reduction at several loading conditions can also be referred to Table 3. For instance, at loading condition of 50MVar the transmission loss has been reduced from 16.3940MW to 14.4811MW. In order to achieve this, the sizing of SVCs are 80.8699MVar, 45.4359MVar and 31.2545MVAr as indicated in the Table 3. The cost of installation at this scenario is 242.550 thousand US$. From Table 3 it is observed that the value of transmission losses is decreased while the installation cost is increased accordingly as the reactive power loading is increased. The results of SVCs sizing to achieve optimal loss reduction at several loading conditions subjected to bus 13 can be referred to Table 4. For instance, at loading condition of 50MVar, the transmission loss has been reduced from 15.7160MW to 14.5014MW. In order to achieve this value the sizing of SVCs are been proposed as 57.0969MVar, 48.6924MVar, and 28.6442MVar as indicated in the Table 4. The cost of installation at this scenario is 153.510 thousand US$. Similar phenomenon can be observed in this case where by; Table 4 it is observed that the value of transmission losses is decreased and the cost of installation is increased accordingly as the reactive power loading is increased.
Loading Condition (Mvar)
Transmission Loss (MW) without SVC
with SVC
10
15.3850
14.4390
20
15.4610
14.4790
30
15.5420
14.5014
40
15.6270
14.4825
50
15.7160
14.5014
SVC Sizing (Mvar)
77.7170 80.2714 51.6117 94.4202 22.5720 45.4510 88.7872 52.0765 22.7202 92.2982 24.6392 48.5287 57.0969 48.6924 28.6442
Cost SVC
IC
(US$/KVar)
103 (US$)
127.0916
120.230
127.0807
124.800
127.0628
132.230
127.0317
145.380
127.0117
153.510
TABLE 5 TRANSMISSION LOSS REDUCTION LOAD VARIATION AT BUS 6 PERFORMED USING PSO AND BA Loading
Transmission Loss (MW)
Condition
without
(Mvar)
SVC
10
PSO
BA
15.3850
14.4390
14.3712
20
15.4610
14.4790
14.4141
30
15.5420
14.5014
14.4576
40
15.6270
14.4825
14.5297
50
15.7160
14.5014
14.5919
B. Comparative Studies with Other Technique Comparative studies were conducted with respect to the results obtained using BA [21]. The results are tabulated in Table 5, 6 and 7 for load subjected to buses 6, 10 and 13. In Table 5 at loading condition of 10MVar; PSO managed to reduce the transmission loss from 15.3850MW to 14.4390MW, while BA managed to reduce the transmission loss to 14.3712MW. The same scenarios can be observed as well with 20MVar and 30MVar. It is shown that, BA
422
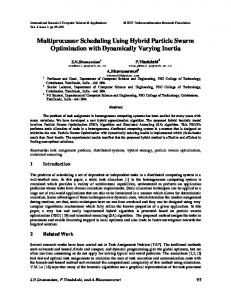
Figure 6: Results for transmission losses load variation reduction at bus 6 performed using PSO and BA
2011 IEEE Symposium on Industrial Electronics and Applications (ISIEA2011), September 25-28, 2011, Langkawi, Malaysia
On the other hand, Figure 6 illustrates the transmission loss in the system when the load at bus 6 is gradually increased. This is in fact exhibility the profiles of transmission loss variation performed using PSO and BA. Both PSO and BA are comparable. In Table 6, at loading condition of 10MVar; PSO managed to reduce the transmission loss from 15.6050MW to 14.4564MW, while BA able to reduce the transmission loss to 14.4722MW. The same scenarios can be observed at 20MVar and 30MVar. It is shown that, BA technique can be minimize the transmission loss lower than PSO. However the different results can be observed at load condition of 40MVar and 50Mvar. From Table 6, at loading condition of 50MVar, PSO managed to reduce the transmission loss from 16.3940MW to 14.4811MW, while BA managed to reduce the transmission loss to 14.5155MW. It is shown that the result by PSO is lower than BA. Figure 7 illustrates the transmission loss in the system when the load at bus 10 is gradually increased. TABLE 6 TRANSMISSION LOSS REDUCTION LOAD VARIATION AT BUS 10 PERFORMED USING PSO AND BA Loading
Figure 7: Results for transmission losses reduction load variation at bus 10 performed using PSO and BA TABLE 7 TRANSMISSION LOSS REDUCTION LOAD VARIATION AT BUS 13 PERFORMED USING PSO AND BA Loading
Transmission Loss (MW)
Condition
without
(Mvar)
SVC
10
Transmission Loss (MW)
Condition
without
(Mvar)
SVC
10
15.6050
PSO
BA
14.4564
14.4722
20
15.6820
14.3921
14.4731
30
15.7650
14.4944
14.4868
40
15.8540
14.5080
14.5201
50
16.3940
14.4811
14.5155
Similar phenomenon observed at bus 13. In Table 7, at loading condition of 10MVar, PSO able to reduce the transmission loss from 15.3850MW to 14.4923MW, while BA able to reduce the transmission loss to 14.3446MW. The same scenarios can be observed at 20MVar and 30MVar. However the different results can be observed at load condition of 40MVar and 50Mvar. From Table 7, at loading condition of 50MVar, PSO able to reduce the transmission loss from 15.7160MW to 14.4918MW, while BA able to reduce the transmission loss to 14.5822MW. Figure 8 illustrates the transmission loss in the system when the load at bus 13 is gradually increased. It is shown that PSO able minimize the transmission loss better than BA when loading condition is greater than 30MVar.
V.
PSO
BA
15.3850
14.4923
14.3446
20
15.4610
14.5013
14.3854
30
15.5420
14.4873
14.4543
40
15.6270
14.4634
14.5022
50
15.7160
14.4918
14.5822
Figure 8: Results for transmission losses reduction load variation at bus 13 performed using PSO and BA
system. Besides that, the cost of installation is considered in the system. Tests are performed on the IEEE 26 bus RTS. Result shows that the implementations of PSO and BA have reduced the transmission losses of the system indicating it as a feasible technique to perform the losses optimizations.
CONCLUSION
An approaches for transmission loss reduction by using SVC installation via PSO and BA as the optimization techniques are presented. Source code of PSO optimizations technique was developed to determine the optimal sizing of SVC in order to minimize the losses in the transmission
423
2011 IEEE Symposium on Industrial Electronics and Applications (ISIEA2011), September 25-28, 2011, Langkawi, Malaysia
[16] R. D. Zimmermann, and D. Gan, "Matpower a Matlab power system simulation package, User’s Manual”, Version 2.0, Dec. 1997. [17] J. Kennedy, and R. Eberhart, “Particle Swarm Optimization,” in Proc. 1995 IEEE International Conf. on Neural Network, vol 4, pp. 1942-1948. [18] Chansareewittaya. S, and Jirapong, P, “Power Transfer Capability Enhancement with Multitype FACTS Controllers Using Particle Swarm Optimization,” in Proc. 2010 IEEE TENCON Conference 2010, pp 42 - 47E. 2010. [19] Hashemzadeh. H, and Hosseini. S.H., “Locating Series FACTS Devices Using Line Outage Sensitivity Factors and Particle Swarms Optimization for Congestion Management,” Power & Energy Society General Meeting, 2009 (PES '09). pp 1-6, 2009. [20] Sundareswaran. K, Hariharan. B, Parasseri. F.P, Antony. D.S, and Subair, B, “Optimal Placement of Static VAr Compensators (SVC’s) Using Particle Swarm Optimization,” in Proc 2010, International Conference on Power, Control and Embedded Systems (ICPCES), 2010 , pp. 1 – 4, 2010. [21] N. Othman, I. Musirin, M.A.Rahim, and Z.Othman, “Bees Algorithm Technique for Loss Minimization in Power Transmission Network Using Static Var Compensator,” in Proc The 4th International Power Enginnering and Optimization Conference (PEOCO 2010), 23-24 June 2010.
REFERENCES [1] [2]
[3]
[4] [5]
[6]
[7]
[8]
[9]
[10]
[11]
[12] [13]
[14]
[15]
G.Hingorani, “Power electronics in electrical utilities: role of power electronics in future power systems”, in Proc 1988 IEEE, Vol. 76 No, 4 April 1988, pp.481-482. 1988 Saravanan. M, Slochanal. S.M.R, Venkatesh. P, Abraham, P.S, “Applications of PSO Technique for Optimal Location of FACTS Devices Considering System Loadability and Cost of Installation,” in Proc 2005 7th International Power Engineering Conference (IPEC). Pp. 716 - 721 Vol. 2 2005 G.I.Rashed, H.I.Shaheen, S.J.Cheng, “Optimal Locations and Parameters Settings of Multiple TSCSs for Increasing Power System Loadability Based on GA and PSO techniques, in Proc 2007 Third IEEE International Conference on Natural Computation (ICNC 2007), 2007. P.Bhasaputra, and W.Ongsakul, “Optimal Power Flow with Multitype of FACTS Devices by Hybrid TS/SA Approach,” in Proc. IEEE ICIT’ 02 Bangkok Thailand, 2002. Idris. R.M, Kharuddin. A, and Mustafa, M.W, “Optimal Choice of FACTS devices for ATC Enhancement Using Bees Algorithm,” in Proc. 2009, Power Engineering Conference, 2009. (AUPEC 2009). Australasian Universities 2009, pp. 1 – 6, 2009. Phashant Kumar Towari, and Tog Raj Sood, “Optimal Location of FACTS Devices in Power System Using Genetic Algorithm,” in Proc. IEEE World Congress on Nature And Biologically Inspired Computing (NaBIC 2009), 2009. W. Ongsakul, and P. Jirapong, “Optimal allocations of FACTS devices to enhance total transfer capability using evolutionary programming,” in Proc. International Symposium on Circuits and Systems, Japan, 23-26 May vol. 5 pp. 4175-4178, 2005. M.M.E. Metwally, A.A. E. Emary, F.M.E.Bendary, and M.I. Mosaad, “Optimal allocations of FACTS devices to enhance total transfer capability using evolutionary programming,” in Proc. Power System Conference, 2008, MEPCON 2008, 12th International Middle –East, pp. 1-4. S. Panda, and N.P.Padly, “Comparison of particle swarm optimization and genetic algorithm for FACTS-based controller design,” Applied Soft Computing, vol 8, Issue 4, pp. 251-259, Mar. 2007. S. Chansareewittaya, and P, Jirapong, “Power Transfer Cabability Enhancement with Multitype FACTS Controller Using Particle Swarm Optimization,” in Proc IEEE TENCON 2010. Ismail Musirin, Nur Dianah Mohd Radzi, Muhammad Murtadha Othman, Mohamad Khayat Idris, Titik Khawa Abdul Rahman, “Voltage Profile Improvement Using Unified Power Flow Controller via Articial Immune System”, WSEAS Transaction on Power Systems, Issue 4, Volume 3, April 2008. N.G.Hingorani, and L.Gygyi, “Understanding FACTS: Concept and Technology of Flexible AC Transmission Systems,” in Proc. IEEE Press, 2000, p.18. 2000. S. Auchariyamet, and S.Sirismrannukul, “Optimal Reactive Power Planning with FACTS Devices by Particle Swarm Optimization”, In Proc. 8th International conference on Advances in Power System Control, Operation and Management (APSCOM 2009), 2009, pp. 1 – 6. 2009. L.J. Cai, I.Erlich, and G.Stamtsis, “Optimal Choice and Allocation of FACTS Devices in Deregulated Electricity Market using Genetic Algorithm”, in Proc. Power Systems Conference and Exposition 2004. (IEEE PES 2004) 2004, pp. 201 - 207 vol.1 2004. Nor Rul Hasma Abdullah, Ismail Musirin, Muhammad Murtadha Othaman, “Static VAR Compensator for Minimising Transmission Loss and Installation Cost Calculation,” Australian Journal of Basic and Applied Sciences, 4(4): 646-657, 2010.
BIOGRAPHIES Siti Amely Jumaat graduated from the Institut Tun Hussein Onn (ITTHO-UTM) with honours degree in BSc. Electrical Eng. in 2001 and MEng. (Power), UTM in 2003. She is currently is pursuing a PhD in power system at Universiti Teknologi MARA, Malaysia. Her research interests include power system stability, facts devices and Artificial Intelligent techniques. Associate Professor Dr. Ismail Musirin obtained Diploma of Electrical Power Engineering in 1987, Bachelor of Electrical Engineering (Hons) in 1990; both from Universiti Teknologi Malaysia, MSc in Pulsed Power Technology in 1992 from University of Strathclyde, United Kingdom and PhD in Electrical Engineering from Universiti Teknologi MARA, Malaysia in 2004. His research interest includes power system stability, optimization techniques, distributed generator and artificial intelligence. Dr. Muhammad Murtadha bin Othman received his B.Eng. (Hons) from Staffordshire University, England in 1998; M.Sc from Universiti Putra Malaysia in 2000 and PhD from Universiti Kebangsaan Malaysia in 2006. He currently lectures at the UniversitiTeknologi MARA, Malaysia. His area of research interests are artificial intelligence, transfer capability assessment and reliability studies in a deregulated power system.
Dr. Hazlie Bin Mokhlis received M.Sc. degree from Malaya University and Ph.D degree in 2009 from Manchester University, United Kingdom. His research interest is Electrical power system (Transmission and Distribution) Power quality, stability, EMC & Islanding
424