Bortas I, Brnjac N, Dundović Č. Transport Routes Optimization Model Through Application of Fuzzy Logic
IVAN BORTAS, Ph.D. candidate1 (Corresponding author) E-mail:
[email protected] NIKOLINA BRNJAC, Ph.D.2 E-mail:
[email protected] ČEDOMIR DUNDOVIĆ, Ph.D.3 E-mail:
[email protected] 1 Arhitektika projekt d.o.o., 10430 Samobor, Croatia 2 Faculty of Transport and Traffic Sciences, University of Zagreb, Vukelićeva 4, 10000 Zagreb, Croatia 3 Faculty of Maritime Studies, University of Rijeka Studentska 2, 51000 Rijeka, Croatia
Intermodal Transport Review Submitted: 2 Dec. 2016 Accepted: 31 Jan. 2018
TRANSPORT ROUTES OPTIMIZATION MODEL THROUGH APPLICATION OF FUZZY LOGIC ABSTRACT The transport policy of the European Union is based on the mission of restructuring road traffic into other and energy-favourable transport modes which have not been sufficiently represented yet. Therefore, the development of the inland waterway and rail transport, and connectivity in the intermodal transport network are development planning priorities of the European transport strategy. The aim of this research study was to apply the scientific methodology and thus analyse the factors that affect the distribution of the goods flows and by using the fuzzy logic to make an optimization model, according to the criteria of minimizing the costs and negative impact on the environment, for the selection of the optimal transport route. Testing of the model by simulation, was performed on the basis of evaluating the criteria of the influential parameters with unprecise and indefinite input parameters. The testing results show that by the distribution of the goods flow from road transport network to inland waterways or rail transport, can be predicted in advance and determine the transport route with optimal characteristics. The results of the performed research study will be used to improve the process of planning the transport service, with the aim of reducing the transport costs and environmental pollution.
KEY WORDS intermodal transport; optimization of transport routes; reduction of environmental pollution; fuzzy logic;
1. INTRODUCTION Favourable geographical position of Croatia, traversed by the European transport corridors, has the potential for development and expansion of the economy. Transport corridors passing through the territory of Croatia constitute a component of the European intermodal transport system. With the increased traffic of goods in the port of Rijeka an increase is expected in the traffic transit of goods to the countries of Eastern Europe, which points to the need for optimization Promet – Traffic&Transportation, Vol. 30, 2018, No. 1, 121-129
of routes from the viewpoint of transmission modes, spatial and environmental criteria as well as transport costs. The strategic intention of the transport development of Europe, including Croatia, is the integration of the transport system into a single trans-European transport network, with the aim of reducing pollution and greenhouse gas emissions. The strategic plan for the development of non-road, intermodal forms of transport (rail and inland waterway transport) would significantly reduce pollution and energy consumption in the transport sector. The aim of this scientific research was to explore and analyse the influential factors for the optimization of transit flows of goods, the intermodal transport network and the choice of transport mode with optimum energy consumption, reduced environmental pollution and acceptable transport costs. Optimization model of merchandise flows will reduce transportation disbursements, transportation time, environmental pollution and energy consumption. Optimizing of the transport route will improve the planning process and the selection of the transport route, which will reduce transport congestions. Accordingly, this research was conducted, and an analysis of the model criteria for the distribution of merchandise flows on the intermodal transportation network was carried out using fuzzy logic. By analysing the criteria and variables affecting the flow of goods, scientific knowledge, on the basis of which a model for optimization of the transport route for optimum transport mode on intermodal transport corridors, has been developed.
2. OVERVIEW OF THE PREVIOUS STUDIES There are no complex scientific studies of longterm character in solving problems of intermodal corridors. The European Union in its White Paper directs 121
Bortas I, Brnjac N, Dundović Č. Transport Routes Optimization Model Through Application of Fuzzy Logic
cargo flows through intermodal corridors, requiring multimodal and intermodal solutions with acceptable negative environmental impacts [1]. Authors [2], provide an overview and analysis of the known models for cargo transportation of the European countries. The analysis includes models of Swedish goods cargo, (Swedish national freight model system – SAMGODS), Norwegian national model (the National network model for freight transportation – NEMO), the Belgian model (Wyre Forest Transportation Model – WFTM) Italian model system, the Dutch transport model (Transport Economics model – TEM) and the Dutch strategic model (Strategic model Integral Logistics and Evaluation – SMILE), and the British model (Strategic European Multimodal Modelling – STEMM). The authors [2] have concluded that the basis of all previous models within the transport system of goods is based on four basic steps: production, distribution, classification and transportation of cargo. Tavasszy, from the National Institute of applied scientific research in the Netherlands [3], points to the problem of modelling in freight transport. Analysing the previously made models, the author concludes, that it cannot meet the growing traffic demands of the trade and indicates the necessary implementation of investigative actions with the aim of finding innovative solutions to the modelling of freight transport system based on the relevant vision of the European transport policy. In his work he describes the main models of cargo flows in Europe. In his conclusion [3] there are two key phases that should be based on modelling goods flows-policy development of cargo flows based on forecasted demand and modelling phase of distribution of cargo. The fuzzy set theory allows the use of ambiguity and plurality of linguistic expressions. It can be mapped into fuzzy sets and interpreted in computer languages. Fuzzy setups describing imprecise terms and fuzzy logic make the basis of fuzzy systems or fuzzy management or flaw in expert systems. [4] Critical scientific analysis of previous studies of domestic and foreign scientific technical literature has shown that the problem of model of the separation and distribution of cargo has been only partly
scientifically researched and processed. Previous studies are mainly based on the selection of the transport mode concerning cost of transport as the most important criterion. Based on these facts, other influential factors are to be investigated in order to optimize the process of transport services in the distribution of goods flow, as the subject matter of these scientific studies is based on these factors.
3. ASSESSMENT OF INTERMODAL EUROPEAN TRANSPORT Intermodal forms of sea transport are thriving in the Northern Europe. The competitiveness of intermodal traffic is characterized by the presence of reliable and successful services of combined transport. The analysis of transported cargo within the European Union concluded the turnover of goods in 2013 compared to 2015 with increase in railway transport by 1.3%, while road traffic decreased by 4.1%. The inland water transport remained almost unchanged (Table 1). In Europe there are more than 40,000 km of canals and rivers that connect hundreds of key industrial cities and areas. The heart of Europe, especially the Netherlands, Belgium, Luxemburg, France, Germany and Austria are connected by multiple rivers and canals which daily transport a variety of cargo (heavy metals, bulk cargo, industrial goods, construction materials, containers, large dimensions cargo and waste). TEN-T network of the European inland waterways is of great importance because it covers four navigational corridors (Rhine corridor, Corridor North-South, East Corridor and Southeast Corridor – Danube) which generate nearly 86% of the entire European inland waterway traffic. Sea transport is an important link in the transport of goods, which connects the world's traffic flows. Container traffic through leading European ports in 2013 (TEU) is presented in Table 2. Comparing the obtained data with the data of rail transport of goods, in the European countries [7], transportation during the same period (2011-2015)
Table 1 – Impact of the transport of carried cargo [mil.ton/km] in the European Union from 2013 to 2015 Year
Railway transport
Road transport
Pipeline transport
Sea and coastal water transport
Inland transport
Air transport
Total
2013
399
1,719
117
1,414
153
2
3,804
%
10.49
45.19
3.07
37.16
4.03
0.06
100
2014
403
1,725
119
1,412
114
3
3,813
%
10.57
45.23
3.12
37.046
3.96
0.08
100
2015
418
1,454
116
1,401
147
3
3,539
%
11.82
41.09
3.28
39.59
4.16
0.06
100
Source: [5]
122
Promet – Traffic&Transportation, Vol. 30, 2018, No. 1, 121-129
Bortas I, Brnjac N, Dundović Č. Transport Routes Optimization Model Through Application of Fuzzy Logic
Table 2 – Container traffic of leading European ports from 2013 to 2015 (TEU) Port
Total traffic in TEU 2013
2014
2015
2014/2015 [%]
11,621,000
12,298,000
12,235,000
-0.51
Hamburg
9,257,000
9,720,000
8,821,000
-9.25
Antwerp
8,664,000
8,978,000
9,654,000
7.53
Rotterdam
Source: [6]
Table 3 – Transport effects of transported cargo [mil.ton/km] in rail transport, in selected EU countries from 2011 to 2015 Country
2011
2012
Bulgaria
14,152
the Czech Republic
87,096
Estonia
48,378
Greece
2013
2014
2015
12,470
13,539
13,691
14,635
82,968
83,957
91,564
97,280
44,725
43,682
36,289
28,026
2,702
2,272
3,377
2,143
1,404
Spain
23,899
24,903
24,959
28,436
28,960
Croatia
11,794
11,088
10,661
10,390
9,939
Italy
91,811
88,505
87,960
90,862
92,273
Latvia
59,385
60,601
55,831
57,039
55,645
Lithuania
52,330
49,377
48,028
49,000
48,053
the Netherlands
39,174
37,627
38,927
39,367
41,721
107,587
100,452
95,449
98,281
97,642
60,723
55,755
50,348
50,348
55,306
Austria Romania Slovenia
17,024
15,828
17,156
17,989
17,832
Slovakia
43,711
42,599
48,401
50,997
47,358
Source: [5]
has shown the decline of trade in goods in certain European Union countries, Bulgaria and Greece about 50%, while in Austria and the Netherlands the decline of freight transport of around 10% (Table 3).
4. ASSESSMENT OF INTERMODAL TRANSPORT IN CROATIA The most important Croatian traffic routes are a part of the European major network transport corridors and have a significant place on the European road map. Two land corridors (Corridor X and parts of Corridor V) pass through the territory of Croatia. On the border with Serbia, there is a river corridor (Corridor VII - the Danube River, recently part of the Rhine-Danube Corridor) [8] which are part of the European corridor network. Joining the European Union on July 1, 2013, Croatia became an integral part of the TEN-T network. The Republic of Croatia is situated on the Mediterranean Corridor and the corridor of the Rhine and the Danube. The Mediterranean Corridor connects the south of the Iberian Peninsula, through the Spanish and French Mediterranean coast, passes through the Alps in northern Italy, then enters Slovenia and continues further to the Hungarian-Ukrainian border. It includes railways and roads, airports, rail-road terminals, in northern Italy and the inland waterways. It is in Promet – Traffic&Transportation, Vol. 30, 2018, No. 1, 121-129
fact a road and rail corridor as an integral part of the route and the Rijeka-Zagreb-Budapest route (rail and road route which has become standard called Corridor Vb). In the Mediterranean Corridor it continues to the road and rail line from Zagreb to Slovenia, which has been established in our name as Corridor X. According to statistics of the transport infrastructure, the Republic of Croatia has 26,964 km of roads; 2,628 km of railway lines, two major ports of maritime freight transport (the ports of Rijeka and Ploče) and four ports for passenger traffic (Zadar, Split, Šibenik and Dubrovnik), seven airports, four river ports (Sisak, Slavonski Brod, Osijek and Vukovar) and 806 kilometres of inland waterways. Inland waterways are presented with a percentage share of 4.73% in 2015, and the amount of transported cargo of 5,520 thousand tons (Table 4). Although, the data indicate the percentage share similar to the European statistical data (Table 1), to be the case of transported volume of cargo on the river Danube, through the Croatian territory in transit, in the amount of 5,000, or almost 90%. Yearly turnover of goods in 2015 shows that road traffic is the dominant mode of transport, with a total of 71.73 mil. tons of transported cargo, while in rail freight the transported volume is 9.98 mil. tons, and on inland waterways it is 5.52 mil. tons (Table 4) [9]. 123
Bortas I, Brnjac N, Dundović Č. Transport Routes Optimization Model Through Application of Fuzzy Logic
Table 4 – Quantity of transported cargo [1,000 tons] in Croatia from 2012 to 2015 Year
Railway transport
Road transport
Pipeline transport
Sea and coastal water transport
Inland transport
Air transport
Total
2012
11,794
65,439
6,878
25,636
5,934
4
115,685
%
10.19
56.57
5.95
22.15
5.13
0.01
100
2013
10,661
67,500
7,617
24,744
5,823
3
116,635
%
9.16
58.02
6.55
21.26
5.00
0.01
100
2014
10,389
66,146
6,918
20,335
4,910
3
108,701
%
9.56
60.85
6.35
18.71
4.52
0.01
100
2015
9,977
71,726
8,148
21,415
5,520
3
116,789
%
8.55
61.41
7.00
18.30
4.73
0.01
100
Source: [9]
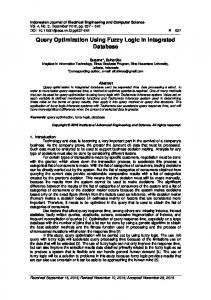
The results of the statistical analysis of the volume of transported cargo in the Republic of Croatia in the period from 2012 to 2015, (Table 4) indicates a decrease in freight transport by inland waterways and rail transport, while road transport shows further growth. Since such a trend is not in line with the EU transport development strategy, there is need of finding the solutions, for re-allocating goods flow from road transport to inland waterways and railway transport. Based on the carried out research, we learned of the importance of developing a transport route optimization model that would enable the distribution of goods flow, from road transport to rail transport and inland waterway transport, while at the same time reducing the transport costs and environmental pollution with reduced energy consumption. The choice of the fuzzy logic modelling system is the most convenient mathematical apparatus for handling uncertain and vague input data (in the form of possible predictions of traffic flow demand on the transport route, which are the base for final objective calculations). Here, by using fuzzy logic, an optimization model of the transport route based on indeterminate and imprecise input data is developed. By simulating the flow of goods through the model, it is possible to anticipate possible delays in carrying out the technological process of transport, and correct it with the aim of obtaining optimal output parameters, which will reduce transport costs, reduce energy consumption and also reduce environmental pollution. The first phase of modelling by fuzzy logic is a so called fuzzy process, where the function of belonging determines the degree of affiliation: Bad (B), Medium (M) and Good (G), where the category is Bad (B) determined according to the minimum value of a particular criterion. The category Good (G) represents the maximum possible value of a particular criterion, while 124
the Medium (M) area is defined in such a way as to obtain the average value between the minimum and maximum values (Figure 1). Membership functions are based on the empirical findings of the expert. y 1.0 The degree of
5. MODEL OF OPTIMUM TRANSPORT ROUTE
B
M
G
0.5
0
a
b
c
x
Figure 1 – Defining the membership functions
The analytical formula shows the values of affinity function. The values of belonging to the function, marked Bad (B), are presented with a fuzzy set of minimum values, and the function of affiliation is defined as a function on the negative values of the real variable x. Z] 1 0 # x # a ]] ] x-b (1) n B ^ x h = ][ a - b a < x # b ]] ] 0 x>b \ The fuzzy variable values of Medium (M), are represented by a fuzzy set, and the function of affiliation which is defined as a positive function, representing the mean value between the maximum and minimum values of real variable x. The area of functional belonging, on the left M to B, marked MB, is defined by formula with negative value of real variable x. Promet – Traffic&Transportation, Vol. 30, 2018, No. 1, 121-129
Bortas I, Brnjac N, Dundović Č. Transport Routes Optimization Model Through Application of Fuzzy Logic
Z] 0 0 # x # a ]] ]] x - a ] ab \ The area of functional belonging, on the right M to G, marked MG is defined by formula with positive value of real variable x. Z] 0 0 # x # b ]] ]] 1 x=b ] (3) n MG ^ x h = [] x - c ]] < # b x c ]] b - c ] 0 x>c \ Fuzzy variable values of "Good" (G), are presented with the maximum value of the fuzzy set, and the function of affiliation is defined as a function on the positive values of the real variable x. Z] 0 0 # x # b ]] ] x-b (4) n G ^ x h = [] c - b b < x # c ]] ] 1 x>c \ As analysed, the values of undefined set are converted into the values of the defined set (a process of defuzzyfication is being carried out). The conclusion rules of the chosen parameters 1.0 to -1.0 are defined as follows: – if the value of the function is Bad (B), multiply by -1.0; – if the value of the function of affiliation ranges between (BM), multiply by -0.75; – if the value of the function of affiliation ranges between (MG), multiply by 0.75; – if the value of the membership function is Good (G), multiply by 1.00. Based on the conducted analysis of the infrastructure criteria, environmental pollution and the amount of external costs caused by traffic; these values to be used as input variables in designing and testing of the model are obtained. Infrastructure criteria are used the variables of permeable power and value of infrastructure construction. Also, according to ecological criteria, variables of energy consumption, environmental pollution and external costs have been selected. Processing and ranking of the variables was performed by the classification method, by evaluating the individual variables with the values from one to ten. Rating 1 represents the minimum value (equivalent of 10%), while the maximum value is expressed by the score of 10 (replacing the equivalent of 100%). Traffic infrastructure consists of roads, telecommunications and powerplant facilities, business and warehouse buildings and accompanying signal-security facilities that enable a smooth traffic flow. For the purpose of this research, an analysis and ranking of Promet – Traffic&Transportation, Vol. 30, 2018, No. 1, 121-129
infrastructure criteria based on empirical findings were made for variables: permeability of infrastructure and the value of infrastructure construction.
5.1 Throughput transport infrastructure Traffic throughput or road capacity is defined by the ability of roads to carry out a transport operation with the maximum amount of cargo during a given period of time. The throughput power of the infrastructure will be expressed in millions of tons for the maximum annual amount of freight that can be transported by means of a certain mode of transport and based on the data obtained from Table 4. The minimum amount of cargo on inland waterways (in the period from 2011 to 2015) is around 5.0 million ton/year, which can be defined by a score of 2. The values below the grade 2 fall into the category of Bad (B) (equivalent less than 20 n%). The maximum amount of freight that can be transported by rail, along with the existing infrastructure is about 20.0 million tons/year, which can be defined by a score of 8. Values above 8 are within the category of function of belonging Good (G) (replaces the equivalent of 80% - 100%). The amount of conveyed cargo (equivalent to 20% 80%), defined by a score of 2 to 8, represents the value of the affiliation function Medium (M). The throughput power of the infrastructure is defined by evaluating the value of the function belonging to the fuzzy set, namely: – Bad (B) for the annual amount of cargo carried, with a score less than 2 (equivalent to 0% - 20%), – Medium (M) for the annual quantity of cargo carried, with a score of 2 - 8 (equivalent to 20% - 80%), – Good (G) for the annual quantity of cargo carried, score more than 8 (equivalent to 80%-100%).
5.2 The value of infrastructure construction Transport infrastructure consists of traffic routes, facilities and equipment used for the production of transport services and regulation of traffic safety and supporting facilities in operation maintenance, and servicing infrastructure and superstructure (warehouses, terminals, customs zones, access channels, open coastline, closed docks, etc.). The assessment and evaluation of the building and future expansion of transport infrastructure is an important factor in the decision of investments in the improvement and modernization of the technological process of transportation. The value of investment in the development of transport infrastructure points directly to the technical equipment of individual infrastructure on the railway and inland corridor. By empirical findings, the amount of investment in the construction of transport infrastructure of about € 2.0 mil./km can be defined by a score of 2, the value below the grade 2 falls into the category of function of 125
Bortas I, Brnjac N, Dundović Č. Transport Routes Optimization Model Through Application of Fuzzy Logic
which pollute the environment and affect the health of people, mostly in large cities, where the concentration of vehicles is high. Rail and inland waterways pollute the environment the least. In the case of rail and inland waterway transport, there is less emission of harmful gases related to road traffic. It is not a negligible fact that rail and inland waterways occupy three times smaller land area compared to road construction, provide greater traffic safety and lower noise impact, etc. Environmental pollution costs caused by traffic are shown in a part of Table 5. Environmental Pollution is defined by evaluating the value of the function of belonging to a fuzzy set based on the empirical findings of the expert, namely: – Bad (B) for environmental pollution, with a rating of less than 2 (equivalent to 0% - 20%), – Medium (M) for environmental pollution, rated 2-8 (equivalent to 20% - 80%), – Good (G) for environmental pollution, rated by more than 8 (equivalent to 80% - 100%).
Bad (B), (equivalent to less than 20%). The maximum amount of funds invested in the construction of the existing transport infrastructure is around € 12.0 mil./km, which can be defined by a score of 8, the value of more than 8 is within the category of function of belonging Good (G), (replaces the equivalent of 80% - 100%). The value of building traffic infrastructure is defined by the value of belonging function to fuzzy group, as follows: – Bad (B) for investment in the construction of transport infrastructure, a score of less than 2 (equivalent to 0% - 20%), – Medium (M) for investment in the construction of transport infrastructure, a score of 2-8 (equivalent to 20% - 80%), – Good (G) for investment in the construction of transport infrastructure, a score, more then 8 (equivalent to 80% - 100%).
5.3 Environmental pollution The development of environmental awareness and protection is a strategic commitment in the plans of the development of modern civilization. The planning of transport infrastructure should take into account the value of the negative impact on the environment, which in general are the costs of the community, and therefore expressed in the form of external costs. The problem of environmental pollution is manifested through air and water pollution, the spread of noise in the environment and global warming caused by emissions from the combustion powertrain of vehicles. The combustion of fossil fuels results in noxious gases emitted into the atmosphere (carbon monoxide, nitrogen oxide, hydrocarbons, lead, benzene etc.),
5.4 External costs The term external costs in traffic means the costs incurred by a traffic service user, which are not charged directly, but are burdening the society and the budget of the country in which they are generated. External costs make up a total of five key categories that are caused by traffic: traffic accidents, air pollution, climate change, noise and congestion. There are various studies on external costs and efforts to include external costs in the market regulation process in a way that determines their value for direct payment. Significant improvements have not yet been reached, as one of the key issues implies the impossibility to determine the criteria and methodology for
Table 5 – Estimate the average external costs in the transport sector Passenger transport [EURO/1,000 passenger km] Personal automobile Accidents
Motorcycle
Bus
Rail
Plane
36.0
250.0
3.1
0.9
0.6
5.7
17.0
1.3
3.9
3.6
Air pollution
17.3
7.9
19.6
4.9
1.6
Climate changes
15.9
13.8
8.9
5.3
35.2
Railway transport
Air transport
Transportation waterways
Noise
Freight transport [EURO/1,000 tonnes per km] Light trucks (to 3.5 ton) Accidents
Heavy duty vehicles (more than 3.5 ton)
100.0
6.8
11.5
-
-
35.7
5.1
3.5
19.3
-
Air pollution
131.0
32.4
4.0
2.6
9.7
Climate changes
134.0
15.1
4.7
153.0
4.2
Noise
Source: [10]
126
Promet – Traffic&Transportation, Vol. 30, 2018, No. 1, 121-129
Bortas I, Brnjac N, Dundović Č. Transport Routes Optimization Model Through Application of Fuzzy Logic
Table 6 – Defining the membership functions, and rating the degree of membership by fuzzy logic Value
Ponder
Defining of rules
(1)
(2)
2. 8. 9.
Ecological
1.
Infrastructure
Criteria
Variables
(3)
Bad
Medium
Good
B
M
G
(3)
Waterways
Railway transport
Road transport
Intermodal transport
Throughput transport infrastructure
Value
0.25
< 2.00
2.00 - 8.00
8.00