A feedback-based training mechanism to train imitators for ... of long training, the seventh imitator was trained for a period of six ..... http://developer.android.
Treadmill Attack on Gait-based Authentication Systems Rajesh Kumar, Vir V. Phoha, Anshumali Jain Syracuse University, Syracuse, NY, USA, 13210 {rkuma102,vvphoha,ajain100}@syr.edu
Abstract In this paper, we demonstrate that gait patterns of an individual captured through a smartphone accelerometer can be imitated with the support of a digital treadmill. Furthermore, we design an attack for a baseline gait based authentication system (GBAS) and rigorously test its performance over an eighteen user data-set. By employing only two imitators and using a simple digital treadmill with speed control functionality, the attack increases the average false acceptance rate (FAR) from 5.8% to 43.66% for random forest, the best performing classifier in our experiments. More specifically, the FAR of eleven out of eighteen users increased to 70% or more. Our results call for a revisit of the design of the GBAS to make them resilient to such attacks.
1. Introduction Recently, the potential of smartphone sensors (e.g. accelerometer, gyroscope) has been widely explored in gait based authentication. Most of these systems are evaluated assuming zero [1, 2, 3, 4] or minimal [5] effort forgeries. However, these systems are susceptible to imitation or mimicry attacks due to the following two important attributes of gait biometrics. First, like other behavioral biometrics (e.g. keystroke, swiping etc.) the gait patterns have considerable intra-user variance, are subject to change over time and also overlap across a large population. Second, given access to the sample of a particular user, imitation of gait is possible [6, 7]. The possibility of imitation of gait patterns has been investigated by a few researchers in the past [5, 8, 9]. Imitators were employed to learn and reproduce a victim’s walking pattern by observing them visually, however, the imitators failed to reproduce the learned pattern. Hence it was concluded that the imitation is not possible. Mjaaland et al.[8] trained many imitators by giving them visual feedback and found that learning someone’s walking pattern is not possible because imitators could not exceed their own physiological boundaries. In our experiments, we observed
that for attacking an accelerometer based GBAS, an imitator is not required to produce a visually identical walk, but is instead required to produce a similar accelerometer trace. Our experiments suggest that two visually similar walks by different individuals are not guaranteed to generate a similar accelerometer trace. Therefore, instead of training imitators to produce a visually similar walk, we train imitators to control their own fundamental gait characteristics e.g. step length, step width, speed, thigh lift etc. (see Figure 2), over a digital treadmill. A trained imitator, with the help of treadmill can adjust these characteristics to match the features used to build the baseline GBAS. This phenomenon formed the basis of our experiments. Once trained, the imitator produces three attack samples (50 − 60 steps each) successively without any feedback. Each of these samples are generated at an interval of 10 minutes to verify that the imitator has actually learned the walking pattern of the victim. These samples are used to attack the baseline gait-based authentication system. The main contributions of this paper are: • A feedback-based training mechanism to train imitators for imitating targeted individual’s gait pattern is presented. • A baseline GBAS is designed using five different state-of-the-art classification algorithms. The FAR of 6% and the FRR of 3% are achieved by the best performing classifier. • The vulnerability of the above GBAS is investigated by designing an attack. The performance of the attack is rigorously (user-wise and classifier-wise) evaluated on a data-set of 18 users. By employing only two imitators and a simple digital treadmill, our attack increases FAR by 742% for random forest, the best performing classifier in our GBAS. When observed user-wise performance for random forest classifier, the increase in FAR went to 70% or more for 11 out of 18 users. The rest of this paper is organized as follows: We discuss related work in Section 2, baseline GBAS in Section 3, attack design and results in Section 4 and conclusions and future work in Section 5.
2. Related Work
3.1. Data Collection and Preprocessing
To the best of our knowledge, the first attempt to attack the GBAS by imitation or mimicry was made by Gafurov et al. [5]. In his experiments, imitators of similar physical characteristics (e.g. height and weight) were employed to learn and imitate an individual’s walking pattern. The average equal error rate (EER) jumped from 6.7% to 16%, however, this increase was not considered to be a threat to the gait based authentication systems. Another mimicking attempt was made by Mjaaland et al. [8], in which seven individuals were trained to imitate one specific victim [8]. Six of them were trained for two weeks, five hours every day, but failed to learn and imitate the walking pattern of the victim. To find out the effect of long training, the seventh imitator was trained for a period of six weeks but did not show any improvement in imitation. Finally, it was concluded that the imitators hit their own physiological boundaries, which restrict them from imitating another person’s gait. In [9], the researchers attempted to train imitators by providing continuous visual feedback of the victim’s walking pattern but could not succeed. The above findings conclude that many approaches of training an imitator do not work. These approaches include employing individuals of similar physical characteristics, providing continuous visual feedback, and lastly having a longer training period. Therefore, we decided to use a digital treadmill which offers control over speed, which is one of the most vital attributes of an individual’s gait. We found that apart from speed, other important characteristics e.g. length of steps, thigh lift, hip movement and width of steps, can also be controlled and adapted by individuals. We define the controllability as the ability to increase or decrease the magnitude of movements precisely at will, whereas, adaptability means the ability to repeat the learned pattern as and when required.
The data was collected from 18 users who were either faculty, staff or students, following an IRB approval from the university. We designed our Android application for smartphones to capture walking patterns using accelerometer sensors. Data collection consisted of two separate sessions (referred as Session I and Session II and used for training and testing respectively in the rest of the paper), which were separated by two to three days. The participants walked back and forth freely and naturally in a 100 meter long and 2 meter wide corridor. To avoid any kind of inconsistency we used only one smartphone, specifically, the HTC One M 8, throughout the experiment. We collected the accelerations using the sensor type TYPE LINEAR ACCELERATION (see [14]), which gives linear accelerations (with no gravity component) in the sensor’s own frame of reference. The sampling rate was set to NORMAL which produced around 46 samples per second. To get rid of the noise, we applied smoothing (moving average) on each component separately with a span of five data points.
3. Design of the Baseline GBAS Over the years researchers have proposed various designs and implementations of GBAS, and most of them achieve under 10% error rates [1, 2, 4], tested over 30 to 50 users data-set, by considering zero or minimal effort forgeries. To test the performance of our attack, we designed a new GBAS using a subset of selected features. We used five different state-of-the-art verification algorithms, namely Bayes network, logistic regression [10], multilayer perceptrons [11], random forest [12], and SVM [13] for verification and all of them achieved FAR under 6%. Notably, random forest was the best classifying performer achieving FAR of 5.8% and FRR of 3.5% (see Figure 1). The steps of building the baseline GBAS are briefly described in the following sections.
S.No. 1. 2. 3. 4. 5. 6. 7. 8. 9. 10. 11. 12.
Features description No. of zero crossings Statistical mean Energy of the signal Absolute sum RNG (max(W) - min(W)) No. of peaks Power of the signal Spectral edge frequency Spectral entropy Average peak interval Average peak length Statistical median
Abbreviations NOZC Mean ENG ABS RNG NOP BAP SEF SPE API APL MED
Table 1. List of features defined for each component i.e. X, Y , and Z of acceleration and its magnitude M . The feature NOZC for M is always zero, therefore total # of features are: 12 × 4 − 1 = 47.
3.2. Feature Analysis We used a sliding window based feature extraction method to extract features from X, Y , Z and M = √ X 2 + Y 2 + Z 2 . We set the window size to 10 seconds, which consists of around 450 to 480 triplets [X, Y, Z] and the sliding interval to five seconds. Further, we defined a total of 47 features as listed in Table 1 [2, 3, 15]. Next, we evaluated all of these 47 features by using information gain based attribute evaluator [16]. This evaluator ranks all of the features according to scores computed by using the information gain between them and the class attribute. Finally, we selected top 17 ranked features to build our baseline GBAS.
Top 17 features ranked by using information gain based attribute evaluator SEF Z (3.6) SEF Y (2.7) Energy Y (2.3) BAP Y (2.1) RNG Y (1.9) SEF X (1.9) Mean M (1.8) NOP Y (1.7) RNG M (1.7) ABS X (1.7) BAP X (1.5) RNG X (1.2) API X (1.2) NOP X (1.2) BAP Z (1.1) NOP Z (1.0) API M (0.3) – Table 2. List of top 17 features used for building the baseline authentication system. For feature description see Table 1.
1
In order to train the classifiers we used in our GBAS, both genuine and impostor samples were required. We created training sets from the Session I data and testing sets from the Session II. Both training and testing sets consist of genuine and impostor samples. The genuine samples consist of a set of feature vectors created from original samples of users. The impostor samples also consist of a set of feature vectors taken from randomly selected users’ genuine samples, except the user in question. The training set was supplied to train the classifiers to build the model, and then the testing set was supplied to obtain the genuine and impostor scores. Further, to compute the performance metrics, namely FAR and FRR, from these scores, we computed user-specific thresholds using the following 3σ method proposed by Ke Chen [17]. � Ts =
µ − 3σ (¯ µσ + µ¯ σ )/(¯ σ + σ)
if (µ − 3σ) > (¯ µ + 3¯ σ ), otherwise
Error Rate
Here, µ and σ (respectively µ ¯ and σ ¯ ) denote the estimate of the mean and variance on genuine’s scores (and the impostor’s respectively) obtained from the genuine and impostor samples respectively from the training set. The user specific threshold generally yields better results in biometrics [18]. The classifier wise performance (i.e. FAR and FRR) of the baseline authentication system is presented in Figure 1 and is comparable to the state-of-the-art GBAS [1, 2, 3]. In Figure 1, the classifiers Bayes network, logistic regression, multilayer perceptrons, random forest, and support vector machine are abbreviated as BayesNet, LogReg, MulPer, RanFor and SVM respectively. 0.2 0.18 0.16 0.14 0.12 0.1 0.08 0.06 0.04 0.02 0
Mean FAR
BayesNet LogReg
MulPer
RanFor
Mean FRR
SVM
Figure 1. Classifier-wise average performance of the baseline GBAS on 18 users considering zero effort forgeries.
ABS_X RNG_X NOP_X API_X BAP_X SEF_X ENG_Y RNG_Y NOP_Y BAP_Y SEF_Y NOP_Z BAP_Z SEF_Z Mean_M API_M RNG_M
0.8 0.6 0.4 0.2 0 −0.2 −0.4 −0.6
AB S RN _X G NO _X P_ AP X I BA _X P_ SE X F EN _X G RN _Y G NO _Y P BA _Y P_ SE Y F NO _Y P BA _Z P SE _Z F M _Z ea n AP _M I RN _M G _M
3.3. Performance Evaluation
Figure 3. Correlation among 17 selected features used for building the baseline GBAS.
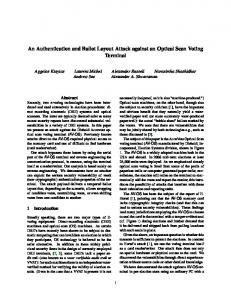
4. Design, Implementation and Performance Evaluation of the Treadmill Attack As mentioned in the introduction, two visually similar walking patterns do not necessarily produce similar accelerometer readings. Also, employing an imitator of similar physical characteristics (weight, height, age etc.) could not contribute much because the imitators could not push their own physiological boundaries. Even if the imitators are able to learn the victim’s walking pattern, precise control and repetition of the learned behavior is not feasible by walking naturally. Therefore, we use the LifeSpan TR1200, a digital treadmill (see [19]) which provides precise control over core gait characteristics, namely, step length, step width, walking speed and thigh lift. We refer to these core gait characteristics as gait characteristics adaptable over treadmill (GCAT) by imitators (see Figure 2) throughout this paper. The treadmill not only provides a firm basis for repeating learned behavior, but also contributes to faster and more efficient training of imitators. In order to significantly increase the FAR of the GBAS, ideally we need to match all the features used to built the system. However, it is very tedious and impractical to try to match all 17 features used in building the GBAS, by controlling and adapting only four GCAT. Therefore, we further examined the feature set by using a correlation among the features. We noticed, through a correlation heat map (see Figure 3), that some features are very strongly correlated with others. For example, RNG Y
(a) Step length over treadmill
(b) Step width over Treadmill
(c) Speed over treadmill
(d) Thigh lift over treadmill
Figure 2. List of four gait characteristics adaptable which are controllable and adaptable over treadmill. First is the step length, second is the step width, third is the speed and forth is thigh lift.
Figure 4. A flow chart illustrating the feedback based imitator’s training mechanism.
is highly correlated with ENG Y and BAP Y, and RNG X with ABS X, and BAP X etc. Consequently, we selected five features, namely, ABS X, RNG X, NOP X, NOP Y, and RNG Y, which were dominating and could be mapped to the GCAT. We refer to these features as the “dominating feature set” in the rest of the paper. The correlations between the GCAT and dominating feature set are used to generate the feedback for imitators during their training.
4.1. Imitators Training Mechanism A pictorial representation of imitators training mechanism is given in Figure 4. The input for the training mechanism is a victim’s samples and the output is the attack samples. We extract dominating feature set from the victim’s samples. We refer to the dominating features extracted from the victim’s sample as victim’s dominating feature set. From victim’s dominating features we estimate initial values for each GCAT, and supply them to the profiled imitator. By using these initial estimated values of GCAT, the imitator produces the very first sample. Next, we extract imitator’s dominating feature set from the very first sample. Further, we compute the feature-wise difference between the victim’s and imitator’s dominating feature sets. If the difference passes the termination criteria (explained later in this section) then we terminate the training process and generate three samples without any feedback each separated by 10 − 20 minutes of duration. We use these
three samples to attack the baseline GBAS and therefore refer to them as attack samples. If the difference does not passes the termination criteria then we generate feedback for the imitator to produce the next sample. We loop this process until the difference becomes acceptable. It takes four to six attempts on an average to train an imitator for one victim. In the following sections, we describe the process of profiling an imitator, the acceptability criteria for terminating the training process and methodology for generating feedback for the imitator. Profiling an imitator: An imitator who is to be profiled walks at and with different speed settings {sp1 , sp2 , ... spp }, step lengths {sl1 , sl2 , ... slq }, step widths {sw1 , sw2 , ... swr } and thigh lifts {tl1 , tl2 , ... tls }, where p, q, r, and s are the number of different samples for each GCAT i.e. speed, step length, step width and thigh lift. This generates a total of (p + q + r + s) samples. We take all of the samples belonging to a particular GCAT and extract dominating feature set from all of them. For instance, we take all p samples generated for p different settings of speed and extract p dominating feature sets, which are represented as {(fi1 , fi2 , ..., fi5 )1 , (fj1 , fj2 , ..., fj5 )2 , ...,(fk1 , fk2 , ..., fk5 )p }. Where i, j ... k are the number of feature vectors obtained during the feature extraction for the corresponding sample. Next, we compute correlations between all features in dominating feature set and GCAT, one by one, as
follows. To get the correlation between ABS X and speed, we compute the correlation between the vector {fi1 , fj1 , ..., fk1 } and {(sp1 , sp1 , ... i times), (sp2 , sp2 , ...j times) ... (spp , spp , ... k times)}. Similarly, for RNG X, we compute the correlation between the vector {fi2 , fj2 , ..., fk2 } and {(sp1 , sp1 , ... i times), (sp2 , sp2 , ...j times) ... (spp , spp , ... k times)}. We repeat these computations for all five feature in dominating feature set. The whole process was repeated for step length, step width and thigh lift and the outcome is a correlation matrix (see Table 3) which we call the imitator profile. This matrix gives us the information for the particular imitator about which particular GCAT needs to be adjusted and how much to match the imitator’s and victim’s dominating feature sets more closely. Hence, the imitator’s profile is directly used to generate feedback for that imitator during her training process. Each value in the Table 3 can be translated to a rule. For example, correlation of 0.95 between speed and RN G Y indicated that if RN G Y needs to be increased, the feedback would be “increase the speed”. The magnitude of the increment will be computed using the difference between feature values extracted from the victim’s sample and the most recent sample generated by the imitator. Interestingly, the correlation matrix was significantly different for different imitators. This led to the conclusion that for different imitators, changes in GCAT impact the features in dominating feature set differently. Training termination criteria: We devised our own ad-hoc criteria for terminating the training process which is explained as follows. The criteria is based on the metrics of closeness of features between a victim’s and imitator’s dominating feature sets. Let I={f ip1 , f ip2 , ..., f ip5 } represent an imitator’s dominating feature set of p feature vectors and let V = {f vq1 , f vq2 , ..., f vq5 } represent a victim’s dominating feature set of q feature vectors. For each feature in I, 70% of its values must lie within the RN G of corresponding feature values in V in order for training to terminate. For instance, if the range of values of feature ABS X in V is {430 − 450} and ABS X in I have the values {420, 460, 430, 433, 448, 450, 410, 425}. The ABS X will be considered a match because six out of eight (i.e. 75%) feature values from I are within the range of the values in V. Generating the next feedback: We repeat the above procedure for every feature in the dominating feature set. If each of the features passes the 70% criteria, we terminate the training process. Otherwise, for every feature which does not pass the 70% criteria, we compute their respective means in I and V and then compute the difference between these means. The difference obtained in the previous step and the correlation values between the corresponding dominating feature and the GCAT from the imitator’s profile (see Table 3), are used to prepare the next feedback.
Dominating Features ABS X RNG X NOP X RNG Y NOP Y
Speed 0.40 0.43 0.92 0.95 -0.64
GCAT SLength SWidth -0.87 0.95 -0.40 0.81 0.69 0.29 0.80 0.81 -0.95 -0.81
TLift 0.72 0.74 0.35 0.68 0.24
Table 3. A profile of an imitator.
For example, let the dominating feature ABS X has the values {450, 460, 472, 485, 475, 465, 455, 450} in I and {425, 450, 430, 435, 428, 460, 420, 440} in V. We can see that ABS X does not passes the 70% criteria as the range of is values in V is {420 − 460} and only 50% i.e. four out of eight, of the values are in the range. The means of the feature values in I and V are 464 and 436, so the difference is 28. The correlation value between ABS X and step length (SLength) is −0.87 (see Table 3). Therefore, the feedback would be increase the step length because the correlation is highly negative and we have to reduce the values of the ABS X. Similarly, feedback about the other three GCAT can be generated by using the correlation values between each respective GCAT and ABS X.
4.2. Performance Evaluation of Attack In this section, we present the performance of our attack on the baseline GBAS. The Figures 5(a), 5(b), 5(c), 5(d), and 5(e) show the damage caused by the attack user-wise for all of the five classification algorithms used in building the baseline GBAS. We carried out the performance evaluation for all of the three attack samples collected after training imitators without any feedback. The baseline FAR is presented in the blue color, and the FAR obtained from the three attack samples are presented in cyan, yellow, and dark red. The reason we used three attack samples was to investigate if the imitator actually learned to imitate the victim in order to potentially reproduce (imitate) the pattern when needed. The FAR presented is only based on the imitator’s generated data. We can observe that for some users (e.g. user1, and user8) there is a very little to no increase in the FAR. This is because, these users could not be imitated by either of the two employed imitators. When investigated further, we found that the imitators’ physical characteristics were markedly different from these users’. The Figure 5(f) presents the increase in mean FAR computed over all of the three attack attempts on 18 users for all five of the classification algorithms. Notably, the mean FARs are increased by 549% for Bayes network, 544% for logistic regression, 580% for multilayer perceptrons, 742% for random forest and 590% for SVM. Interestingly, the performance of random forest, the best performer in baseline GBAS, has degraded the most. The FARs can be
Bayes Network
1
2
3
4
5
6
7
8 9 10 11 12 13 14 15 16 17 18 User #
Multilayer Perceptrons
1
2
3
4
5
6
7
8
1
2
3
4
5
6
7
8
9 10 11 12 13 14 15 16 17 18 User #
Random Forest
1
2
3
4
5
6
7
8
9 10 11 12 13 14 15 16 17 18 User #
(d) User-wise attack performance for Random Forest based GBAS.
SVM
0.7 Baseline
Attempt1
Attempt2
Attempt3
0.6 0.5
Mean FAR
FAR
1 0.9 0.8 0.7 0.6 0.5 0.4 0.3 0.2 0.1 0 0
1 0.9 0.8 0.7 0.6 0.5 0.4 0.3 0.2 0.1 0 0
9 10 11 12 13 14 15 16 17 18 User #
(c) User-wise attack performance for Multilayer Perceptrons based GBAS.
Logistic Regression
(b) User-wise attack performance for Logistic Regression GBAS.
FAR
FAR
(a) User-wise attack performance for Bayes Network based GBAS. 1 0.9 0.8 0.7 0.6 0.5 0.4 0.3 0.2 0.1 0 0
1 0.9 0.8 0.7 0.6 0.5 0.4 0.3 0.2 0.1 0 0
FAR
FAR
1 0.9 0.8 0.7 0.6 0.5 0.4 0.3 0.2 0.1 0 0
0.4 0.3 0.2 0.1
1
2
3
4
5
6
7 8 9 10 11 12 13 14 15 16 17 18 User #
(e) User-wise attack performance for SVM based GBAS.
0
BNet
LogReg
MulPer
RanFor
SVM
(f) Classifiers-wise mean FAR computed over all users.
Figure 5. Figures 5(a), 5(b), 5(c), 5(d), and 5(e) show the FAR before and after user-specific treadmill attack for Bayes Network, Logistic Regression, Multilayer Perceptrons, Random Forest and SVM respectively. Whereas Figure 5(f) shows the mean FAR before and after three successive attempts of attack.
increased further by employing more imitators and/or more advanced treadmills. We have not reported the changes in FRR because it was unaltered throughout the attack experiment, as the genuine samples for attack were the same as they were for the baseline GBAS.
4.3. Attack Limitations Can one imitator imitate all kinds of victims? While training the imitators during our experiment, we observed that for a few victims, none of the two employed imitators could produce the required accelerometer trace even after attempting more than 40 times. To find out the reason behind this, we compared the dominating features extracted from all the samples collected during the profiling of the imitator to the dominating features extracted from the victim’s sample. We found that some combination of dominating feature values of victims were markedly different from the ones extracted from imitator’s samples. For instance, the values of RN G X and RN G Y were between 3.0 to 4.1 and 7.5 to 10.4 respectively for the victim whereas none of the samples collected from the imitator during his or her profiling could produce this combination of feature values. Observe that the variance in the values of RN G X is very low and the variance in the
values of RN G Y is very high. When analyzed further, we found that the physical characteristics of the victim (e.g. height: 200 cm and weight: 180 lb) and the imitator (e.g. height: 165 cm and weight: 120 lb) were markedly different. Therefore, we conclude that through our training mechanism, one imitator may not be able to imitate all kinds of victims. If the physical characteristics of the victim are known and we employ imitators with similar physical characteristics, the likelihood of successful and accurate imitation is high. This, however, should not be taken as a rule, because imitators with significantly different physical characteristics from victim can potentially produce the matching accelerometer readings, and imitators with significantly similar physical characteristics are not guaranteed to produce matching accelerometer readings. We plan to explore this complex phenomena further and develop a method to predict who can imitate whom in our future work.
4.4. Advantages Over Existing Methods As mentioned in the related work, several attempts were made to imitate the walking patterns of individuals in the past. Almost every researcher had attempted to
train imitators by using various feedback based training mechanisms. The best attack [5] reported an increase in EER from 6.7% to 16%, whereas our attack is able to increase the mean FAR from 5.8% to more than 43.66%. We anticipate a further increase if a sophisticated treadmill and/or more imitators are employed. Some other advantages over existing methods are mentioned as follows: first, the attack design is very simple and easily adaptable by adversaries; second, the knowledge of physical characteristics of the victim is not necessary, although, in our attack scenario these attributes are possibly known, which makes the attack much easier, more accurate and more effective; finally, our attack requires no modifications in victim’s device which makes it unidentifiable and unstoppable by conventional software solutions.
5. Conclusions and Future Work In this paper, we present a feedback-based mechanism to train imitators over treadmill, design an attack for accelerometer based GBAS and rigourously evaluate its impact by employing two random imitators. Our attack degrades the performance of GBAS significantly, hence we conclude that authentication systems based only on accelerometer readings are vulnerable to imitation attacks. Although our attack is quite effective, there still exist various aspects which need to be studied further. For example, the impact of the attack on the other existing GBAS which use different sets of features and (or) methodology for verification, the effect of employing more and physically similar imitators, and the applicability of proposed training mechanism to design and train robots that can imitate the gait patterns of an individual. In addition, we plan to investigate whether the fusion of other context information such as rotation captured by gyroscope sensor while walking can be used to detect and prevent this kind of attack.
6. Acknowledgment We thank Sujit Poudel for his help during the design and implementation of the Android application for data collection. Vir V. Phoha was partly supported by the DARPA Active Authentication grant FA8750-13-2-0274.
References [1] M. Derawi, P. Bours, and K. Holien, “Improved cycle detection for accelerometer based gait authentication,” in IIH-MSP, 2010 Sixth International Conference on, pp. 312–317, Oct 2010. [2] J. Kwapisz, G. Weiss, and S. Moore, “Cell phone-based biometric identification,” in BTAS 2010, pp. 1–7, Sept 2010.
[3] A. Primo, V. Phoha, R. Kumar, and A. Serwadda, “Context-aware active authentication using smartphone accelerometer measurements,” in CVPRW 2014, June 2014. [4] D. Gafurov, E. Snekkenes, and P. Bours, “Gait authentication and identification using wearable accelerometer sensor,” in Automatic Identification Advanced Technologies, 2007 IEEE Workshop on, pp. 220–225, June 2007. [5] D. Gafurov, E. Snekkenes, and P. Bours, “Spoof attacks on gait authentication system,” IEEE-TIFS, pp. 491–502, Sept 2007. [6] L. Ballard, D. Lopresti, and F. Monrose, “Evaluating the security of handwriting biometrics,” in In The 10 th International Workshop on the Foundations of Handwriting Recognition, pp. 461–466, 2006. [7] A. Serwadda and V. V. Phoha, “When kids’ toys breach mobile phone security,” in Proceedings of the 2013 ACM SIGSAC, CCS ’13, pp. 599–610, ACM, 2013. [8] B. Mjaaland, P. Bours, and D. Gligoroski, “Walk the walk: Attacking gait biometrics by imitation,” in Information Security, vol. 6531 of Lecture Notes in Computer Science, pp. 361–380, Springer Berlin Heidelberg, 2011. [9] Ø. Stang, “Gait analysis: Is it easy to learn to walk like someone else?, master’s thesis,” GjØvik University CollegeDepartment of Computer Science and Media Technology, 2007. [10] I. H. Witten and E. Frank, Data Mining: Practical Machine Learning Tools and Techniques, Second Edition (Morgan Kaufmann Series in Data Management Systems). San Francisco, CA, USA: Morgan Kaufmann Publishers Inc., 2005. [11] M. H. Hassoun, Fundamentals of Artificial Neural Networks. Cambridge, MA, USA: MIT Press, 1st ed., 1995. [12] L. Breiman, “Random forests,” Mach. Learn., vol. 45, pp. 5–32, Oct. 2001. [13] C. Cortes and V. Vapnik, “Support-vector networks,” Machine Learning, vol. 20, pp. 273–297, Sept. 1995. [14] “Motion sensors.” http://developer.android. com/guide/topics/sensors/sensors_motion. html. Last accessed in 29 March, 2015. [15] S. Chernbumroong, A. Atkins, and H. Yu, “Activity classification using a single wrist-worn accelerometer,” in SKIMA 2011, pp. 1–6, Sept 2011. [16] M. A. Hall and G. Holmes, “Benchmarking attribute selection techniques for discrete class data mining,” IEEE Trans. on Knowl. and Data Eng., vol. 15, pp. 1437–1447, Nov. 2003. [17] K. Chen, “Towards better making a decision in speaker verification,” Pattern Recognition, vol. 36, no. 2, pp. 329 – 346, 2003. Biometrics. [18] A. K. Jain and A. Ross, “Learning user-specific parameters in a multibiometric system,” in ICIP 2002. [19] “Tr1200-dt5 treadmill desk.” http://www. lifespanfitness.com/tr1200-dt5treadmill-desk/. Last accessed in March, 2015.