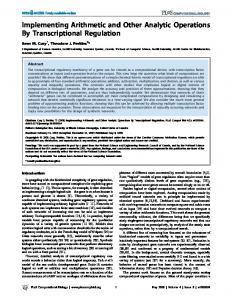
program (Sekine and Collins, 1997; Collins, 1997) have ..... The parsers were the 3 models of Collins (2003), the ...... Satoshi Sekine and Michael Collins.
Tree-distance and some other variants of evalb Martin Emms Dept. of Computer Science, Trinity College, Dublin, Ireland Abstract Some alternatives to the standard evalb measures for parser evaluation are considered, principally the use of a tree-distance measure, which assigns a score to a linearity and ancestry respecting mapping between trees, in contrast to the evalb measures, which assign a score to a span preserving mapping. Analysis of the evalb measures suggests the other variants, concerning different normalisations, the portions of a tree compared and whether scores should be micro or macro averaged. The outputs of 6 parsing systems on Section 23 of the Penn Treebank were taken. It is shown that the ranking of the parsing systems varies as the alternative evaluation measures are used. For a fixed parsing system it is also shown that the ranking of parses from best-to-worst will vary according to whether the evalb or tree-distance measure is used. It is argued that the tree-distance measure ameliorates a problem that has been noted concerning over-penalisation of attachment errors.
1. Introduction The PARSEVAL measures of parser performance (Black et al., 1991), as refined and implemented by the evalb program (Sekine and Collins, 1997; Collins, 1997) have become a widely adopted standard. Fundamentally this approach treats gold-standard and parser-generated trees G and T , as sets of labelled spans, G S and T S . The similarity of these sets is then quantified via precision and recall scores, often combined into a single F 1 figure, itself equivalent (as shown below) to applying the standard Dice measure for quantifying the similarity of two sets. Thus the evalb scoring projects trees into particular sets and applies set comparison measures. There is an alternative to this way of proceeding, which might be described as treating trees in their own right, rather than treating them via a projection into sets. That alternative is the tree-distance measure (K.Zhang and D.Shasha, 1989). The tree-distance measure on two trees G and T may be arrived at by considering the partial, one-to-one mappings, σ : G 7→ T , from the nodes of one tree to the nodes of the other. Given such a mapping, it is natural to identify the following sets of nodes D
= {n ∈ G : n 6∈ dom(σ)}
I
= {n ∈ T : n 6∈ ran(σ)}
S M
= {n ∈ G : label(n) 6= label(σ(n))} = {n ∈ G : label(n) = label(σ(n))}
where D, I, S and M stand for deleted, inserted, swapped and matched. Based on these sets, a cost can be assigned to a mapping, with the standard arrangement setting this cost to be a sum of set sizes1 : D + I + S. Amongst all possible mappings σ : G 7→ T , the tree-distance measure considers only those mappings that (T1) preserve left-to-right order (T2) preserve ancestry 1
Using the roman version of a set’s name to stand for its size, hence D for |D| etc. This arrangement effectively assigns a unit cost to each individual deletion, insertion or swap. There are applications of tree-distance in which the costs are parametrized according to the labels of the nodes (Punyakanok et al., 2004).
so one can also say that the mappings are required to be homomorphisms on the two dimensions of structure characteristic of a tree. Call a T1/T2-conformant mapping a T -mapping. The tree-distance between G and T can then be defined as the cost of the least costly T -mapping. An example of a least-costly T -mapping between a pair of trees G and T is shown in Figure 1. Deleted nodes have B< B B t1
t2
x
y
C t3
B
>B
t4
z
t1
t2
z
x
y
Figure 1: a T -mapping < affixed to their label (and are red), inserted nodes have > prefixed (and are green), swapped nodes are shown linked with a dotted arrow (and are blue), and matched nodes are shown at the same height, with no linking arrow (and are black). The cost associated with this T -mapping is 4, from 1 deletion, 2 substitutions and 1 insertion. There is an equivalent definition of tree-distance via the notion of an edit-script, being a sequence of edit operations on one tree, to derive a second tree, where the operations are deletion, insertion and re-labelling. See K.Zhang and D.Shasha (1989) or Bille (2005) for proofs that the costs of the least costly mapping and the least costly edit-script are identical, and for details of efficient algorithms for the computation of this measure. Though tree-distance has been applied to questionanswering and entailment recognition (Punyakanok et al., 2004; Kouylekov and Magnini, 2005; Emms, 2006a; Emms, 2006b) it has not been applied to parser evaluation. The main aim of the work reported below is to compare outcomes using tree-distance to the outcomes using the standard evalb measures. Some further dimensions of contrast to the standard set-
up will also be explored, to describe which some further definitions are required. First of all we note how it is possible to subsume the evalb measures under the costed-mapping perspective that underlies the tree-distance measure. To begin with, the T1/T2 requirements on mappings should be replaced with the requirements that they (E1) preserve node labels (E2) preserve lexical spans Call an E1/E2-conformant mapping from G to T an E-mapping. Note that E1/E2 make the choice of Emapping practically deterministic – the exception being unary branches on which the same label recurs – quite unlike the set of possible T -mappings. For the same imaginary G/T pair as considered in Figure 1., the corresponding E-mapping is shown in Figure 2. If we derive a cost
B< B< B t1
t2
x
y
>C t3
B
>t4
z
t1
t2
z
x
y
Figure 2: an E-mapping from this E-mapping in the same way as for a T -mapping, the cost is 6, from 3 deletions and 3 insertions – from the evalb-perspective, the deletions are recall errors and the insertions are precision errors. We show now how the evalb quantities can be derived from an E-mapping. First a technicality. Let the roof of a tree be the nodes which are not terminal or pre-terminal. The evalb labelled recall and precision quantities refer to the roof parts of the compared trees: pre-terminals are dealt with separately. We will use ˆ. to signify the restriction to the roof part of trees. Given a (least-costly) E-mapping, Table 1., gives formulae defining the labelled recall, labeled precision of evalb, and their F1 combination2.
The second line concerning F1 gives an equivalent formula, which can be obtained when the formulae for R and P are substituted in: ˆ /G ˆ×M ˆ /Tˆ)/(M ˆ /G ˆ+M ˆ /Tˆ) (2 × M ˆ × (1/G ˆ Tˆ)/(1/G ˆ + 1/Tˆ) 2M
F1 = =
ˆ × (1/G ˆ Tˆ)/((G ˆ + Tˆ)/G ˆ Tˆ) 2M ˆ ˆ ˆ 2M /(G + T )
= =
The result is the Dice formula for comparing 2 sets (van Rijsbergen, 1979). This quantifies the similarity by considering the size of their intersection (multiplied by 2) and normalises by the sum of their sizes; the multiplication by 2 is to ensure a quantity between 0 and 1, with 1 for identical sets. Seeing the F1 score in this light invites the consideration of other normalizations of the match score, in particular by ˆ ∪ Tˆ, giving the Jaccard score, forthe size of the union G mulae for which are given in the 4th row of Table 1. This Jaccard normalisation is another of the variants of the standard evalb-based scores that will be considered below. As noted above, the evalb measures report labelled precision and recall confined to the roof part of trees. Another alternative which will be considered below is to apply the definitions with pre-terminals included, and this will be referred to as the whole-tree variant. To fix ideas the following table takes the E-mapping shown in Figure 2 and gives the values for R, P , E Dice, and E Jaccard for the case of restriction to roof-trees ˆ G 3
Tˆ 3
ˆ D 2
ˆ M 1
Iˆ 2
G-W 6
T-W 6
D 3
M-W 3
ˆ G ˆ 1 − D/
= = =
ˆ + I)/( ˆ G ˆ + Tˆ ) 1 − (D
= = =
ˆ + I)/( ˆ G ˆ ∪ Tˆ ) 1 − (D
= = =
Table 1: Scores definable from an E-mapping ˆ and Tˆ are used interchangeably in these formulae both for G a set of nodes and its size. 2
E Dice 0.33
E Jacc 0.2
I 3
R 0.5
P 0.5
E Dice 0.5
E Jacc 0.33
All of the scores derivable from an E-mapping that were given Table 1. can be seen as different normalisations of the ˆ . They can all also be seen as the inverses match-count M of similarly normalised ’cost-counting’ measures, using the ˆ = G− ˆ D ˆ = Tˆ − I, ˆ and |G ˆ ∪ Tˆ| = fact that under E1/E2, M ˆ ˆ ˆ G + T − M: =
ˆ /G ˆ M ˆ ˆ M /T 2RP/(R + P ) ˆ /(G ˆ + Tˆ) = 2M ˆ /|(G ˆ ∪ Tˆ)| M ˆ ˆ + Tˆ − M ˆ) = M /(G
P 0.33
and the following table gives the corresponding values for the whole-tree variant where pre-terminals are included.
ˆ Tˆ 1 − I/
labelled recall R labelled precision P F1 = E Dice E Jaccard
R 0.33
ˆ − D)/ ˆ G ˆ (G ˆ ˆ M /G ˆ Tˆ (Tˆ − I)/ ˆ ˆ M /T ˆ + Tˆ − (D ˆ + I))/( ˆ ˆ + Tˆ ) (G G ˆ ˆ ˆ ˆ ˆ + Tˆ ) ((G − D) + (T − I))/(G ˆ /(G ˆ + Tˆ ) 2M ˆ ˆ ˆ − (D ˆ + I))/( ˆ ˆ ∪ Tˆ) (G + T − M G ˆ − D) ˆ + (Tˆ − I) ˆ −M ˆ )/(G ˆ ∪ Tˆ) ((G ˆ ˆ M/(G ∪ T )
Taking up again the topic of tree-distance, this suggests that to undertake a comparision with evalb, we should consider corresponding normalisations of the tree-distance measure and then invert this into a similarity measure. Now
tree-distance is a general measure for comparing trees, applicable to trees with different lexical yields, unlike the evalb scoring. In the above-defined recapitulation of the evalb score via an E-mapping, the lexical items are always mapped to each other in an E-mapping and do not contribute to the match count or to any set sizes in normalisations. In a least-cost T -mapping, from a gold to a test tree, lexical items predominantly are mapped to each other, though not exclusively. The normalisation should reflect this and diminish the significance of large numbers of word matches. Table 2 gives the Dice-style and Jaccard-style normalisations which will be used. If you take the worst-case T -mapping to be one where all of G’s non-terminals are deleted, all of T ’s non-terminals are inserted, whilst all terminals are matched, both the Dice and Jaccard normalisations range between 0 and 1.
1−
D+I +S (G − W ) + (T − W )
T Jaccard 1 −
D+I +S D+S +M +I −W
T Dice
Table 2: Scores definable from a T -mapping To illustrate, for the T -mapping shown in Figure 1., we obtain G-W 6
T-W 6
D 1
S 2
M-W 3
I 3
T Dice 0.66
T Jacc 0.43
At this point a number of potential variants on the standard evalb scoring have been touched on: basing on T mappings vs E-mappings, Dice vs Jaccard normalisations and (for E-mappings) whether or not to restrict to roof trees. There is one final variation which will be considered. In the definitions given so far, scores have been defined for a single pair of trees. Extending this to a collection of pairs of trees, the micro-averaging approach simply averages the scores obtained on each tree pair. The standardly reported evalb scores are macro-averaged for a large collection, by summing the numerators and denominators over all treepairs, and then carrying out the divisions.
2.
A priori considerations
preservation does not imply ancestry-preservation. not
T2: if (i1 , j1 ) and (i2 , j2 ) are in the mapping, then anc(i1 , i2 ) iff anc(j1 , j2 ) The pictures below show a contrived a case where span
exists
not
alive
alive
A 1
The ancestry-preserving aspect of T -mappings is
exists
exists
exists not
alive
alive
The left-hand picture shows an E-mapping. The ’exists’ and ’not’ nodes have the same span and are mapped to each other by the E-mapping, but have reversed ancestry relationships in the two trees, and so cannot be mapped to each other by a T -mapping. The cost associated with the E-mapping is 0, and correspondingly the evalb measures would score this pair of trees as perfectly matched. The right-hand picture shows a minimum cost T -mapping, where its respect for ancestry requires it to leave ’not’ out of the mapping on either side, and so incurs a cost of 2. This example involves unary branching, and a little analysis shows that unary-branching will be the hallmark of cases where an E-mapping is not a T -mapping. Suppose (i1 , j1 ) and (i2 , j2 ) are pairs in an E-mapping . First of all, if ¬anc(i1 , i2 ) and ¬anc(i2 , i1 ), then span(i1 ) and span(i2 ) are disjoint, so by E2, span(j1 ) and span(j2 ) are disjoint, and ¬anc(j1 , j2 ) and ¬anc(j2 , j1 ). Now suppose anc(i1 , i2 ). Then span(i2 ) ⊆ span(i1 ). If span(i2 ) ⊂ span(i1 ), then span(j2 ) ⊂ span(j1 ) and anc(j1 , j2 ). However, if span(i2 ) = span(i1 ) – which applies iff there is unary branching between i1 and i2 – then E2 guarantees span(j2 ) = span(j1 ), from which it only follows that one or other of anc(j1 , j2 ) or anc(j2 , j1 ) holds. A corollorary of this is that when working with a tree (or roof of a tree) without unary branching, the E-mapping is a T -mapping, and because tree-distance chooses the least costly T -mapping, the cost of the E-mapping will be greater than or equal to the cost of the least costly T mapping. Once costs are inverted to similarities, this means that in these cases one would expect an E-score to be lower than a corresponding T -score. It has sometimes been noted that when a parser makes an attachment mistake, attaching high up a constituent which should have been attached low down, this implies span errors all along the path between the high and the low attachment sites (Bangalore et al., 1998). This is illustrated by the E-mapping to the left below, which incurs a cost of 6, and E Dice score of 0.25.
It is not the case that every E-mapping is a T -mapping. The span-preserving aspect of E-mappings is E2: if (i, j) is in the mapping, then span(i) = span(j)
not
A A
A
2
>A
3
>A 4
A 1
A A
2
1 A
3 5
A 2
A 4
A 3
5
5
A 4
The T -mapping has the option to treat this situation differently, as shown in the right-hand picture. The T -
ˆ D 5558 5292 5294 4860 4624 4541
Iˆ 5408 5188 5188 4525 4460 4409
Tˆ 44126 44172 44170 43941 44112 44144
E Dice 87.59 88.15 88.15 89.36 89.72 89.87
E Jac 77.93 78.81 78.81 80.77 81.36 81.62
Table 3: E scores, referring to the roof-only part of the tree The E Dice column, as argued above, is equivalent to the standard F1 of the evalb-defined R and P , and this equivˆ I, ˆ and Tˆ columns, toalence can be verified from the D, ˆ gether with the fact that G = 44276. The parsers are listed in order of increasing E Dice score (which coincides with the E Jaccard ordering), and Petrov et al. (2006) point out that on this basis, their parser beats those of Collins (2003) and Charniak (2000). However, on the web-site from which their parser may be downloaded they also note that the model reached after 6 split/merge iterations is ’overfitting the Wall Street Journal’ and recommend use of the model reached after 5 split/merge iterations.
94.5 94.0
+
+
+ +
92.5
93.0
93.5
+
+
+
T Dice +
+
2
3
E Dice
+ 1
4
5
6
Figure 3: E vs T whole tree macro averaged. On the xaxis 1-3 = Collins 1/2/3, 4 = Petrov 5, 5 = Charniak, 6 = Petrov 6. Same in later plots
Whole vs. roof-trees If the E Dice scores for whole trees (Table 4) and roof trees (Table 3) are compared, switching from whole trees to roof trees reverses the Charniak < Petrov 5 ordering. The plot in Figure 4 shows this. The effect persists with the Jaccard normalisation. + +
+
93
Parser Collins 1 Collins 2 Collins 3 Petrov 5 Charniak Petrov 6
+ +
+
+
+ 92
For 6 different parsers we took the test parses produced on Section 23 of the Penn Treebank (Marcus et al., 1994) to see if the alternatives to the standard evalb scoring that were noted in section 1. give a different relative ordering of the parsers than that obtained by the standard evalb measures3 . The parsers were the 3 models of Collins (2003), the maximum entropy inspired parser of Charniak (2000), and the 5 and 6 split-merge cycle versions of the parser of Petrov et al. (2006). In all the results reported below, E scores are derived from E-mappings and T scores are derived from T -mappings. For the software used to obtain the T -scores see Emms (2008). Table 3 gives the E score outcomes, macro-averaged.
91
3. Comparing Collins, Charniak and Petrov
Table 4 gives the E and T scores, for whole trees, macroaveraged. The ordering of the parsers by T -scores is different to that by E-scores in this case, with T giving Petrov 5 < Charniak and E giving Charniak < Petrov 5. The plot in Figure 3 shows this for the Dice normalisation. The effect persists with the Jaccard normalisation. Note that in line with expectation, the T scores are higher than the E scores.
whole E Dice roof E Dice
90
mapping is able to maps nodes to each other though they have different spans. For the nodes participating in the attachment error, the ancestry difference means they must be treated as deleted and inserted, and the T -mapping incurs a cost of 2, and T Dice score of 0.75.
+
Evalb vs. Tree-distance
+
Parser Collins 1 Collins 2 Collins 3 Petrov 5 Charniak Petrov 6
E Dice 92.39 92.73 92.71 93.37 93.30 93.61
E Jac 85.86 86.45 86.42 87.58 87.44 87.99
T Dice 93.62 93.91 93.91 94.50 94.55 94.72
T Jac 87.87 88.41 88.41 89.47 89.54 89.87
88
89
+
+
+
2
3
+ 1
4
5
6
Figure 4: Whole and Roof Tree, E Dice, macro-averaged
Table 4: E and T scores, whole tree, macro-averaged 3
The scores refer to all sentences, not the length ≤ 40 subset, and the standard parameter settings was used, implying principally parse normalisations in which punctuation and nodes dominating traces are deleted.
Choice of normalisation Thus far, varying between the Dice and Jaccard normalisations has not been shown to have any effect. The plots in Figure 5 and Figure 6 shows micro and macro averaged outcomes with the two normalisations. For the micro-averaged
95.0
E score, changing the normalisation from Dice to Jaccard changes the ranking of the parsers.
m
m
m
94.5
M
94.0 93.5
M
93.0
m
m
m
m
M
M m
m M m
m
M
M
M
m M
M
m
m
Micro T Dice
M m
M m
Macro T Dice
M
M
Macro E Dice
Micro E Dice
Besides comparing how the different measures rank parsers, we can also consider how they rank parses. The plot in Figure 7 plots E-score against T -score, with the Jaccard normalisation, for the Petrov 5 parses. A smeared-out band results, indicating that more than one T score can correspond to a single E-score, and vice-versa. A similar plot results with the other parsers, and other Dice normalisation. This is an indicator that the E and T scores will not produce the same ranking of parses. The kendalltau measure (S.Siegel and N.J.Castellan, 1988) of the difference between the E and T rankings of parses was computed. This figure can be interpreted as how often, when a pair of parses is picked from one ranking, the pair will appear differently ordered in the other ranking. It comes out at 4-5%, for all the parsers, and with either normalisation.
92.0
92.5
M
M
4. Comparing best-to-worst parse rankings
2
3
4
5
6
1.0
1
90
M
M
m
m
m
m
M M
m M
87
m
m
Micro T Jacc
86
M m M
M m M
Macro T Jacc Micro E Jacc Macro E Jacc
M
M
3
4
0.2
0.4
0.6
0.8
1.0
E Jacc
Figure 7: T Jacc vs E Jacc. Petrov 5 parses in both cases
M 2
+ 0.0
M
m
1
++ +
m M
M
+
0.2
m
0.0
89
+
M m
88
m
T Jacc
m
m
0.4
91
0.6
0.8
Figure 5: Micro vs Macro averaging (whole tree, E/T, Dice norm)
+ ++++++ ++ + + ++ ++ + + + ++ +++++ + + + + +++ + + + + ++ + + + + + + + + + ++ + + + + + + ++ ++ + + + + ++ + + + + + + + + + ++ + + + + + + + + + + + ++ +++ + ++ + ++++++ ++ ++ + + ++ ++ + ++ ++ + +++ + ++ + ++++ + + ++ + + ++ ++ + +++ + + ++ ++ +++ + + ++ + + + ++ + + ++++ ++ + + ++ +++ ++ + + ++ + ++ + + + + + + + + + + + ++ + + + + + +++ ++++++++ ++ +++ ++++++ +++++ ++++ +++++++ +++ ++++ + ++++++++ + ++ + + ++ ++++ +++ + + + + + + + + + + + + ++++++++ +++ + + +++++++ ++ ++ ++++ + + + ++++ + ++++ + ++ + ++ + + +
5
6
Figure 6: Micro vs Macro averaging (whole tree, E/T, Jaccard norm)
Micro vs. Macro averaging Looking at the plots in Figure 5 and Figure 6, there is tendency for the micro-averaged scores to place Charniak farther ahead of Petrov 5 then do the macro-averaged scores, and in the case of the E Dice measure (Figure 5) the switch from micro to macro-averaging switches the Charniak > Petrov 5 ordering. Thus all of the dimensions of contrast to the standard evalb figures which defined in section 1. can lead to a differing ranking of the parsers investigated. None of the variants seem unnatural, so this ought to lead one to temper the importance attributed to the evalb ranking. The E vs T contrast is the most interesting of all, as the treedistance measure seems particularly natural, being based on the mathematically natural notion of a homomorphism.
The plot in Figure 8 plots the Jaccard and Dice normalisations of the E-scores against each other. This is closer to a single line, which is an indicator that varying the normalisation will not produce much change in the ranking of parses. When the kendall-tau measure of the difference between the Dice and Jaccard-normalised rankings of parses is computed it comes out 0.5% for the E-score, and 0.75% for the T -score. Sentence 159 in the Section 23 test set was Vincent Bajakian manager of the $ 1.8 billion Wellington Fund added to his positions in BristolMyers Squibb Woolworth and Dun & Bradstreet Friday and in the reference parse Friday is attached high as a daughter of the top-most vp-node, whereas in the Petrov 5 parse it is attached low. This parse is ranked 504 places lower under the E scoring than under T , the largest rank difference amongst the 2416 trees. The first (resp. second) picture below shows its G-to-T alignment for the E (resp. T ) scorings. To save space some identical matched parts are elided as dots. This is a concrete case of the theoretical possibility mentioned at the end of section 2.
1.0 0.4
E Jacc
0.6
0.8
+ +++ +++ +++ + + + +++ +++ +++ + + +++ +++ +++ + + + ++ +++ +++ +++ + + + ++++ +++ ++ ++ ++ + +
0.2
+ +
+
0.0
+ + 0.0
0.2
0.4
0.6
0.8
1.0
E Dice
Figure 8: E Dice vs E Jaccard. Petrov 5 parses in both cases
s
s
np
vp
.
np vp
vbd pp< .
.
to np
pp
np
np to np >pp
in np< .
.
.
. np< .
.
in
>np
in
.
.
. >np
. nnp
.
.
Friday s np .
to np .
Friday
.
vbd pp
nnp
nnp >Friday
5. Related and future work The nearest related work is that of Roark (2002), who basically applies the linear edit distance (V.I.Levenshtein, 1966) to various linearisations of trees, rather than applying the 2 dimensional version of edit distance that we use here. He did not find a variation in the ranking of parsers that he considered, whereas we do. He essentially also considered only measures on roof trees. One aspect of his approach that it would be interesting to explore is an explicit modeling of movement, whereby an attachment error is recognised by a typical signature of paired deletions and insertions and re-costed. This is because although T -mappings
References
Srinivas Bangalore, Anoop Sarkar, Christy Doran, and Beth-Ann Hockey. 1998. Grammar and parser evaluation in the xtag project. In Proceedings of LREC Workshop on Evaluation of Parsing Systems. Philip Bille. 2005. A survey on tree edit distance and related problems. Theor. Computer. Sci., 337(1-3):217– 239. Ezra Black, Steven P. Abney, D. Flickenger, Claudia Gdaniec, Ralph Grishman, P. Harrison, Donald Hindle, Robert Ingria, Frederick Jelinek, Judith L. Klavans, Mark Liberman, Mitchell P. Marcus, Salim Roukos, Beatrice Santorini, and Tomek Strzalkowski. 1991. A procedure for quantitatively comparing the syntactic coverage of english grammars. In Proceedings of HLT. Eugene Charniak. 2000. A maximum-entropy-inspired parser. In Proceedings of NAACL 2000, pages 132–139. Michael Collins. 1997. Three generative, lexicalized models for statistical parsing. In Proceedings of ACL 97. Michael Collins. 2003. Head-driven statistical models for natural language parsing. Computational Linguistics, 29(4):589–637.
Martin Emms. 2006a. Clustering by tree distance for parse tree normalisation. In Proceedings of NLUCS 2006, pages 91–100. Martin Emms. 2006b. Variants of tree similarity in a question answering task. In Proceedings of the Workshop on Linguistic Distances, pages 100–108, Sydney, Australia, July. Association for Computational Linguistics. Martin Emms. 2008. Tree distance software at www.cs.tcd.ie/Martin.Emms/tdist. Milen Kouylekov and Bernardo Magnini. 2005. Recognizing textual entailment with tree edit distance algorithms. In Ido Dagan, Oren Glickman, and Bernardo Magnini, editors, Pascal Challenges Workshop on Recognising Textual Entailment. K.Zhang and D.Shasha. 1989. Simple fast algorithms for the editing distance between trees and related problems. SIAM Journal of Computing, 18:1245–1262. Mitchell P. Marcus, Beatrice Santorini, and Mary Ann Marcinkiewicz. 1994. Building a large annotated corpus of english: The penn treebank. Computational Linguistics, 19(2):313–330. Slav Petrov, Leon Barret, Romain Thibaux, and Dan Klein. 2006. Learning accurate, compact, and interpretable tree annotation. In Proceedings of COLING/ACL 2006, pages 433–440. Vasin Punyakanok, Dan Roth, and Wen tau Yih. 2004. Natural language inference via dependency tree mapping: An application to question answering. Computational Linguistics. Ines Rehbein and Josef van Genabith. 2007. Treebank annotation schemes and parser evaluation for German. In Proceedings of the 2007 Joint Conference on Empirical Methods in Natural Language Processing and Computational Natural Language Learning (EMNLP-CoNLL), pages 630–639. B. Roark. 2002. Evaluating parser accuracy using edit distance. In Proceedings of the LREC 2002 workshop: Beyond PARSEVAL: Towards Improved Evaluation Measures for Parsing Systems, pages 30–36. Geoffrey Sampson and Anna Babarczy. 2003. A test of the leaf-ancestor metric for parse accuracy. Nat. Lang. Eng., 9(4):365–380. Satoshi Sekine and Michael Collins. 1997. evalb software at nlp.cs.nyu.edu/evalb. S.Siegel and N.J.Castellan. 1988. Non-Parametric Statistics for the Behavioural Sciences. McGraw-Hill. C. J. van Rijsbergen. 1979. Information Retrieval, 2nd edition. Dept. of Computer Science, University of Glasgow. V.I.Levenshtein. 1966. Binary codes capable of correcting insertions and reversals. Sov. Phys. Dokl, 10:707–710.