based on technical analysis, fundamental analysis, time series forecasting, and
artificial ...... Hurst, J. (2000) The Profit Magic of Stock Transaction Timing.
Asia Pacific Management Review 18(2) (2013) 181-195
www.apmr.management.ncku.edu.tw
Trend-Oriented Training for Neural Networks to Forecast Stock Markets Chun-Teh Lee, Jia-Shiang Tzeng Department of Information Management, Da-Yeh University, Taiwan Received 17 April 2011; Received in revised form 29 October 2011; Accepted 20 March 2012
Abstract A trend-oriented training is developed for neural network training to enhance technical analysis predictions of stock market trends. Predefined trend targets based on a moving average are used for machine learning. Three technical indicators, Bias, %R, and MACD, and their combinations are chosen as input signals to test the system. Accurate prediction rates of about 70% are achievable over a two-year out-of-sample test period when one single input indicator is used. When multiple input indicators are properly combined, the accurate prediction rates can be improved to 74.3% or 83.1% if neutral trends are excluded. A simple trading strategy based on the turning points predicted by the system yields much higher investment returns than a reference neural network system and the buy-and-hold model. The experimental results have demonstrated the effectiveness of this trend-oriented training which gives the system reliable learning targets to capture dynamic price trends. Keywords: Moving averages, neural networks, stock market trends, trend-oriented training 1. Introduction Stock market analysts have adopted many tools in predicting stock market behavior, based on technical analysis, fundamental analysis, time series forecasting, and artificial intelligence techniques. Each of these tools provides analysts with information about how the stock market will move. Technical analysis is usually considered by the investment community slightly more useful in forecasting price trends than fundamental analysis, but significantly more useful in predicting turning points (Lui and Mole, 1998). Time series forecasting using financial models based on precise hypotheses and/or mathematical equations is incapable of dynamic learning, forecasting changing financial patterns, and identifying sophisticated moving trends, and thus generally cannot effectively explain real stock market behaviour (Lin et al., 2007). Therefore, Artificial Intelligence (AI) tools have been proposed as new approaches to financial decision-making. Yao et al. (1999) used artificial neural networks and technical indicators to predict the KLCI stock index, and got better returns when compared with conventional ARIMA and buy-and-hold models. Chang et al. (2009) combined dynamic time windows, case based reasoning, and neural networks for stock trading prediction, and obtained promising results. Armano et al. (2005) presented a hybrid genetic-neural expert system with inputs encoding information retrieved from technical analysis for stock indexes forecasting, and showed that their system outperformed the buy-and-hold strategy. In addition,
Corresponding author. Email:
[email protected] DOI: 10.6126/APMR.2013.18.2.04
181
C.-T. Lee, J.-S. Tzeng / Asia Pacific Management Review 18(2) (2013) 181-195
genetic programming (Kaboudan, 2000) and genetic network programming (Chen et al., 2009) have also been proposed to support stock trading predictions. Neural networks are one of the mostly adopted AI tools in financial modeling (e.g., Armano et al., 2005; Freitas et al., 2009; Glaria-Bengoechea et al., 1996; Lee and Chen, 2007; Yao et al., 1999; Zhu et al., 2008) due to their exceptional fitting or learning capability to extract dynamic financial patterns for making predictions. A common training used for neural network stock-forecasting systems is to predict targeted stock prices/indices (e.g., GlariaBengoechea et al., 1996; Yao et al., 1999). This quantitative method often results in frequent price fluctuations and significant differences between predicted prices and actual prices. These phenomena get much worse in a highly volatile market. However, it is the price direction, not the daily price value, which matters to trading purposes. How to define price directions and targets therefore becomes an important subject. In this study, a new trend-oriented training is proposed for neural network training based on predefined trend targets instead of price targets. Our neural network forecasting system provides one-day-ahead predictions of price trends. In order to effectively control investment timing through better predictions of price trends and turning points, technical indicators are selected as input signals to test the neural network forecasting system. The remainder of this study is organized as follows. Section 2 discusses neural network topologies selected for the study and the three basic technical indicators chosen to test the neural network forecasting system. Next, Section 3 describes the trend-oriented method for training the neural network and testing the validity of each individual indicator and their combinations. The experiments are then conducted on the time series data of a major Taiwan stock index TAIEX (Taiwan Stock Exchange Capitalization Weighted Stock Index). Section 4 further proposes a simple trading strategy based on the system predictions to test the effectiveness of the forecasting system in improving investment returns. In Section 5, the percentages of accurate predictions for different network topologies, different transfer functions, and different combinations of the three basic technical indicators are then presented. Moreover, the investment return achieved from the proposed trading system is compared with those from a reference neural network system and the buy-and-hold strategy. Finally, Section 6 presents the conclusions by giving important findings and practical implications. 2. Neural network topologies and technical indicators A multilayer back-propagation neural network topology is adopted in this study. The neural network consists of an input layer with one to six source neurons, at least one hidden layer for computational neurons, and an output layer with one computational neuron. The input signals in the input layer are technical indicators. The number of these input signals varies from one to six depending on the number of technical indicators that are chosen. Either the tan-sigmoid or the linear transfer (or activation) function may be used in the hidden layers. In the output layer, only the tan-sigmoid transfer function is adopted. Lee and Chen (2007) have shown that proper combinations of multiple technical indicators can improve the accuracy of neural network forecasts as compared with single technical indicators. It requires a step-by-step search for these technical indicators and their optimized parameters. The search process starts from single technical indicators, and gradually combines those which have shown good performance. Three basic technical indicators, Bias, %R, and MACD, and their combinations are chosen as input signals to test the neural network forecasting system. The Bias indicator is the deviation ratio of prices from a particular moving average of prices. The value of an N-day Bias indicator ending on the nth day, Bias(N, n), is calculated as: 182
C.-T. Lee, J.-S. Tzeng / Asia Pacific Management Review 18(2) (2013) 181-195
C (n) - MA( N, n) ×100% MA( N, n)
Bias(N, n) =
(1)
where C(n) is the closing price on the nth day, and MA(N, n) is the moving average of prices in N days ending and located on the nth day. The %R indicator, also known as the WMS%R indicator, was proposed by Larry Williams in 1973 (Colby, 2002). The value of an N-day %R indicator ending on the nth day, %R(N, n), is given by: %R(N, n) =
H ( N, n) - C (n) × 100 H ( N, n) - L( N, n)
(2)
where L(N, n) is the lowest price in N days ending on the nth day, H(N, n) is the highest price in N days ending on the nth day, and you might recall that C(n) is the closing price. The %R indicator may be regarded as the strength of selling power because of the H(N, n) C(n) term in Equation 2. The values of the %R indicator are between 0 and 100. The common trading rules separate the %R indicator into three regions. The market is in a bull trend when the %R indicator stays below 20, or in a bear trend when the %R indicator stays above 80. In between 20 and 80, the market is in a transition or undefined region. In this study, continuous values of the %R indicator are used as the input signals to the forecasting system. The macd (Moving Average Convergence and Divergence) indicator was proposed by Gerald Appel and Fredrick Hitschler in 1979 (Colby, 2002). The value of an N-day macd indicator ending on the nth day, macd(L, M, N, n), can be derived from the difference DIF(L, M, n) between a short L-day exponentially-smoothed moving average EMA(L, n) and a long M-day exponentially-smoothed moving average EMA(M, n) as follows: EMA(L, n) =
EMA( L, n 1) ( L 1) C (n) 2 L 1
EMA(M, n) =
EMA( M, n 1) ( M 1) C ( n) 2 M 1
DIF(L, M, n) = EMA(L, n) – EMA(M, n) macd(L, M, N, n) =
macd( L, M , N , n 1) ( N 1) DIF( L, M , n) 2 N 1
(3)
The trading rules for the macd indicator are quite simple. When the DIF(L, M, n) line penetrates the macd(L, M, N, n) line upward forming a golden cross, the market enters a bullish (upward) trend and it is a “buy” signal. A bearish (downward) trend begins when the DIF(L, M, n) line penetrates the macd(L, M, N, n) line downward forming a dead cross, and this is a “sell” signal. Alternatively, we can define an MACD indicator as: MACD(L, M, N, n) = Step{DIF(L, M, n) macd(L, M, N, n)} where Step{x} is a step function which is equal to 1 if x≧1 or 0 if x < 1.
183
(4)
C.-T. Lee, J.-S. Tzeng / Asia Pacific Management Review 18(2) (2013) 181-195
3. Trend-oriented training and testing Supervised learning (Negnevitsky, 2005) is adopted to train the neural network forecasting system. The training is emphasized on learning the macroscopic price trends rather than the microscopic price variations because the price direction is more important than the daily price variation for the trading purpose. How to define price directions and targets for the neural network training therefore becomes a critical subject. 3.1 Moving average based trend definitions and training targets In this study, predefined trend targets based on a moving average are used for the training of neural networks. Three price trends, bullish, bearish, and neutral trends, must be defined before the training. First, we plot several moving averages on top of the training data to see how well they match the actual price trends. Here, the moving-average data point is at the exact center of the span of days whose daily price means were added together to obtain the average. The value of an N-day moving average ending on the nth day and located at the n-(N1)/2 day, MA[N, n (N 1)/2], can be expressed as follows: n
MA[N, n (N 1)/2] =
P /N
(5)
i
i n-N 1
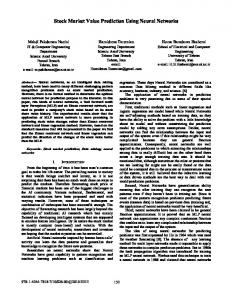
where Pi is the price on the ith day, and N must be an odd number to keep the moving-average data point on the data grid. This means that the data point of a 9-day moving average is placed at the 5th day of its data span. While the shape of the moving average plot is generally similar to the shape of the price plot, it is considerably smoother. A moving average with a short time span normally fluctuates significantly. On the other hand, a long-span moving average may miss too much detailed information of the price movement. Figure 1 shows TAIEX daily prices from 2002 to 2003 and their 9- and 31-day moving averages. A time span between 5 and 9 days is observed to be a good trade-off. In our case, we conducted a few preliminary experiments and picked a time span of 5 days for the moving average based on the resulting hit rates and investment returns. A moving average is a numerical filter, which filters short waves out of the complex price movement and greatly reduces the magnitude of all fluctuations of duration less than or equal to the time span of the moving average (Hurst, 2000; Millard, 1999). Therefore, it is a good representation of the price trend.
6300.00
5800.00
TAIEX
5300.00
4800.00
Price 9MA 31MA
4300.00
1 10 19 28 37 46 55 64 73 82 91 100 109 118 127 136 145 154 163 172 181 190 199 208 217 226 235 244 253 262 271 280 289 298 307 316 325 334 343 352 361 370 379 388 397 406 415 424 433 442 451 460 469 478 487 496
3800.00
Time (days)
Figure 1. TAIEX daily prices from 2002 to 2003 and their 9- and 31-day moving average
184
C.-T. Lee, J.-S. Tzeng / Asia Pacific Management Review 18(2) (2013) 181-195
We basically adopt the price trend of the selected moving average, and ignore the price fluctuations within a price trend. Occasionally, there may be some price trends that contain only a very few time series points. Therefore, a smoothing process is further made by reversing the price trends of these few time series points. After the smoothing process, all the defined price trends contain at least three time series points. This process can be done automatically with a spreadsheet program (e.g., Excel). Next, we pick actual price crests/troughs near the moving average’s crests/troughs as the turning points of price trends. Then, a strongly bullish trend is defined if the up-swing from a trough to its nearest crest is more than 10%, and the targets are assigned a value of 1 for those data points located in the strongly bullish trend. A strongly bearish trend is defined if the down-swing from a crest to its nearest trough is more than 10%, and the targets are assigned a value of 0 for those data points located in the strongly bearish trend. A value of 0.6 is assigned to a weakly bullish trend where the up-swing from a trough to its nearest crest is between 5% and 10%. A value of 0.4 is assigned to a weakly bearish trend where the down-swing from a crest to its nearest trough is between 5% and 10%. The data points in a neutral trend—side movements—are assigned a target of 0.5. The fluctuation (up-swing or down-swing) in the neutral trend is defined to be smaller than 5%. The trend target of the nth day, t(n), can be expressed as follows: When n is located in a upward trend, Hmax(nl)-Lmin(nf)>0 and t(n) = 1 if
H max (nl ) L min ( nf ) >0.1 L min (nf )
= 0.6 if 0.1≧
H max (nl ) L min (nf ) ≧0.05 L min (nf )
= 0.5 if 0.05>
H max (nl ) L min (nf ) >0 L min (nf )
When n is located in a downward trend, Lmin (nl) Hmax (nf)<0 and t(n) = 0 if
L min (nl ) H max (nf ) <-0.1 H max (nf )
= 0.4 if -0.1≦
= 0.5 if -0.05<
L min ( nl ) H max (nf ) ≦-0. 05 H max (nf ) L min ( nl ) H max (nf ) <0 H max (nf )
185
C.-T. Lee, J.-S. Tzeng / Asia Pacific Management Review 18(2) (2013) 181-195
where Hmax and Lmin are the maximum and minimum prices of the price trend in which the nth day resides, respectively. They can occur on either the first day nf or the last day nl of the price trend depending on the direction of the trend. We define price trends for all the training and testing data. The price trends of the training data are used as training targets. The price trends of the testing data are used to calculate hit rates. The hit rate is defined as the percentage of accurate predictions, and equals the number of correct predictions (days) divided by the total number of predictions (days). Our system provides one-day-ahead predictions of price trends. Therefore, the total number of predictions equals to the number of days tested in the experiment. 3.2 Inputs and outputs Three basic technical indicators, Bias, %R, and MACD, and their combinations are chosen as input signals to the neural network forecasting system. The values of the input indicators are calculated from the daily data of the TAIEX and then normalized to between 0 and 1. These input indicators and the predefined training targets described in Section 3.1 are then presented to a back-propagation neural network for training. During the training, the neural network adjusts itself in order to match the output trend targets. The training is stopped when the resulting mean square error (MSE) reaches a predefined value or levels off. It takes several hundred epochs in less than a minute for a current desktop PC to finish the training process. The trained neural network, which is now ready for forecasting price trends, is then tested using input signals calculated from the testing data. The output of the trained neural network, which gives one-day-ahead predictions of the price trend, is a numeric value between 0 and 1. Based on our empirical results described later in Section 5.3, an output from our neural network forecasting system is interpreted as a bull trend if its value is greater than 0.52 or a bear trend if its value is less than 0.48. Otherwise, it is considered as a neutral trend. 3.3 Training and testing data This study is conducted on the time series data of a major Taiwan Stock Exchange Corporation (TSEC) index, the TAIEX. The TAIEX data contain five-year historical data ranging from January 2001 to December 2005. The first three years data are used for training the neural network forecasting system and the last two years data for testing. In either the training period or the test period, the market experienced many ups and downs, as shown in Figure 1. 4. Trading strategies A simple trading strategy is exercised in order to investigate the effectiveness of the forecasting system in improving investment returns. The trading strategies, shown in Table 1, used for this neural network forecasting system are based on the turning points of price trends predicted by the system. A buy signal is generated when the market trend changes bullishly, i.e., from neutral to bullish or from bearish to neutral or bullish. When the market trend changes bearishly, i.e., from neutral to bearish or from bullish to neutral or bearish, a selling signal is generated. When the market trend changes from neutral to bearish, either one long position or one short position could be established previously. We must exit one long futures position and enter one short futures position at the closing price of that day if one long futures position was established. Otherwise, no action must be taken if one short futures position was already established. A similar strategy is used when the market trend changes from neutral to bullish. In Taiwan, the futures markets open 15 minutes earlier and close 15 minutes later than the actual stock markets. The aforementioned entry/exit of one long/short futures position at the closing price of that day can be executed without any problem. Futures prices having 186
C.-T. Lee, J.-S. Tzeng / Asia Pacific Management Review 18 (2) (2013) 181-195
different expiration dates are normally different at any given time. For the sake of simplicity, the futures prices used in this study are assumed to be the same as the actual market prices. Table 1. Trading signals and strategies Trading signal Buy
Price trend prediction bearish to neutral bearish to bullish
Trading strategy short exit + long entry short exit + long entry short exit + long entry no action if a long exists long exit + short entry long exit + short entry long exit + short entry no action if a short exists hold the existing position
neutral to bullish bullish to neutral bullish to bearish
Sell
neutral to bearish Hold
same market trend
5. Results and discussions Results shown in Tables 2-12 and in Figure 2 are obtained on the testing data using the previously trained neural networks. 5.1 Neural network optimization The number of hidden layers and the number of neurons per hidden layer in the neural network are determined by several experiments. The transfer function used in all these neural networks is the tan-sigmoid function. Table 2. Percentage of accurate predictions on the testing data using different network topologies Network topology 1 hidden layer 1 neuron/hidden layer 1 hidden layer 2 neurons/hidden layer 1 hidden layer 10 neurons/hidden layer 1 hidden layers 30 neurons/hidden layer 2 hidden layer 2 neurons/hidden layer 2 hidden layers 30 neurons/hidden layer
Input indicator Bias(16) MACD(14,45,5) %R(28) Bias(16) MACD(14,45,5) %R(28) Bias(16) MACD(14,45,5) %R(28) Bias(16) MACD(14,45,5) %R(28) Bias(16) MACD(14,45,5) %R(28) Bias(16) MACD(14,45,5) %R(28)
187
Hit rate 70.22% 70.02% 72.43% 70.22% 70.02% 71.43% 67.40% 70.02% 69.82% 62.58% 70.02% 69.22% 69.62% 70.02% 71.43% 64.99% 70.02% 67.81%
C.-T. Lee, J.-S. Tzeng / Asia Pacific Management Review 18 (2) (2013) 181-195
Table 2 compares the hit rates of accurate TAIEX trend predictions for different neural network topologies. It shows that neither multiple hidden layers nor multiple neurons per hidden layer provide more accurate predictions than the simplest topology with one hiddenlayer and one neuron per hidden layer. Thereafter, our study will be conducted on this simplest topology that is capable of generating above 70% hit rates for all the three input technical indicators. Contrary to the other two indicators, Bias(16) and %R(28), the hit rates for the MACD(14,45,5) indicator are insensitive to the neural network topologies, as shown in Table 2. This is probably due to the binary characteristic of the MACD indicator. Table 3. Percentage of accurate predictions on the testing data using different transfer functions Transfer function Linear
Tan-sigmoid
Input indicator Bias(16) MACD(14,45,5) %R(28) Bias(16) MACD(14,45,5) %R(28)
Hit rate 69.21% 70.02% 71.43% 70.22% 70.02% 72.43%
Table 3 shows the percentages of accurate TAIEX trend predictions obtained from two different transfer functions, linear and tan-sigmoid. In general, the tan-sigmoid transfer function gives slightly better results than the linear transfer function. As mentioned in the previous section, the one hidden-layer and one neuron per hidden layer topology is used here. Since the tan-sigmoid transfer function provides better prediction accuracy than the linear transfer function, it will be adopted for all the subsequent works. 5.2 Definitions of the neutral trend The neutral trend occurs when stock prices move sideways, and is defined to have a price fluctuation of less than 5% and assigned a target value of 0.5 during the neural network training. Its corresponding output values from the forecasting system are still to be defined in the testing phase. Table 4 shows the hit rates of the forecasting system for two different definitions of the neutral trend. The 0.48-0.52 choice generally gives higher hit rates than the 0.45-0.55 choice, and thus will be adopted for all the system tests throughout the rest of this study. Table 4. Percentage of accurate predictions on the testing data using different definitions of the neutral trend Neutral trend region 0.48-0.52
0.45-0.55
Input indicator Bias(16) MACD(14,45,5) %R(28) Bias(16) MACD(14,45,5) %R(28)
Hit rate 70.22% 70.02% 72.43% 67.61% 70.02% 69.82%
5.3 Combinations of technical indicators In this section, the effectiveness of different combinations of the Bias, %R, and MACD indicators in predicting price trends is investigated. Table 5 shows the hit rates of the TAIEX 188
C.-T. Lee, J.-S. Tzeng / Asia Pacific Management Review 18 (2) (2013) 181-195
trend forecasting using one single technical indicator. All the three single indicators can provide a hit rate of around 70%. Different settings of indicator parameters can affect the hit rates significantly. The best hit rate of 72.43% goes to the %R(28) indicator. Table 5. Percentage of accurate predictions on the testing data using a single technical indicator Input indicator Bias
MACD
%R
Day 8 16 32 12,26,5 12,26,9 13,39,5 13,39,9 14,45,5 14,45,9 7 28 112
Hit rate 68.41% 70.22% 67.00% 68.41% 67.00% 69.82% 68.41% 70.02% 68.41% 68.61% 72.43% 56.94%
Table 6. Percentage of accurate predictions on the testing data using two technical indicators of the same kind Input indicators Bias(8), Bias(16) %R(7), %R(28) MACD(13,39,5), MACD(14,45,5) MACD(13,39,9), MACD(14,45,9) MACD(14,45,5), MACD(14,45,9)
Hit rate 70.62% 72.43% 70.42% 68.61% 70.02%
Table 7. Percentage of accurate predictions on the testing data using two different kinds of technical indicators Input indicators Bias(8), MACD(13,39,5) Bias(8), MACD(14,45,5) Bias(16), MACD(13,39,5) Bias(16), MACD(14,45,5) Bias(8), %R(7) Bias(8), %R(28) Bias(16), %R(7) Bias(16), %R(28) %R(7), MACD(13,39,5) %R(28), MACD(13,39,5) %R(7), MACD(14,45,5) %R(28), MACD(14,45,5)
Hit rate 72.64% 71.23% 69.82% 69.23% 65.19% 74.04% 70.82% 68.21% 71.63% 71.23% 71.63% 72.64%
Table 6 shows the hit rates of the TAIEX trend forecasting using two technical indicators of the same kind, with different values assigned to their parameters. All the combinations 189
C.-T. Lee, J.-S. Tzeng / Asia Pacific Management Review 18 (2) (2013) 181-195
provide hit rates slightly better or equal to their single indicator counterparts. The best hit rate obtained from two technical indicators of the same kind only shows a marginal improvement or no improvement compared with its single indicator counterpart. The %R(7) and %R(28) combination gives a best hit rate of 72.43% which is the same as that obtained from the %R(28) indicator. Table 7 shows the hit rates of the TAIEX trend forecasting using two different kinds of technical indicators. The hit rates range from 65.19% to 74.04%. Some combinations provide better hit rates than their single indicator counterparts but some do not. The best hit rate of 74.04% shown in Table 7 goes to the Bias(8) and %R(28) combination, which is better than 72.43% obtained from two technical indicators of the same kind. Table 8. Percentage of accurate predictions of the TAIEX trend on the testing data using three different kinds of technical indicators Input indicators Bias(8), %R(7), MACD(13,39,5) Bias(8), %R(7), MACD(14,45,5) Bias(8), %R(28), MACD(13,39,5) Bias(8), %R(28), MACD(14,45,5) Bias(16), %R(7), MACD(13,39,5) Bias(16), %R(7), MACD(14,45,5) Bias(16), %R(28), MACD(13,39,5) Bias(16), %R(28), MACD(14,45,5)
Hit rate 72.23% 73.44% 73.64% 74.25% 69.22% 70.22% 71.43% 67.61%
Table 8 shows the hit rates of the TAIEX trend forecasting using three different kinds of technical indicators. As in the case of two different kinds of technical indicators, some combinations result in better hit rates than their single indicator counterparts but some do not. Three combinations in Table 8 are capable of providing a hit rate of higher than 73%. The Bias(8), %R(28), and MACD(14,45,5) combination provides the best hit rate of 74.25%. Table 9 depicts the hit rates of the TAIEX trend forecasting using one to six input technical indicators. These seven combinations of the input indicators almost represent the best choice for each number of input indicators ranging from one to six used in this study. Initially, increasing the number of input indicators slightly improves the hit rate from 72.43% to 74.25% which can be obtained from the Bias(8), %R(28), and MACD(14,45,5) combination. This combination consists of each of the three basic technical indicators used in this study. Therefore, multiple input indicators can provide better prediction accuracy than single input indicator. However, adding more input indicators by assigning different values to the parameters of the same kind of indicators will not further improve the best hit rate already achieved. As shown in Table 9, those combinations having more than three indicators cannot provide better hit rates than 74.25%. Moreover, the combination that has six indicators gives the worst hit rate of 69.01% which is even worse than the hit rates of some single indicators. If an input indicator does not have a strong correlation with the market movement, it certainly contributes little improvement to the prediction accuracy. It may even degrade the prediction accuracy by increasing additional noises.
190
C.-T. Lee, J.-S. Tzeng / Asia Pacific Management Review 18 (2) (2013) 181-195
Table 9. Percentage of accurate predictions on the testing data using different numbers of technical indicators Input indicators
No. of indicators %R(28) 1 Bias(8), %R(28) 2 Bias(8), %R(28), MACD(14,45,5) 3 Bias(8), %R(7), %R(28), MACD(14,45,5) 4 Bias(8), %R(28), MACD(13,39,5), MACD(14,45,5) 4 Bias(8), %R(7), %R(28), MACD(13,39,5), MACD(14,45,5) 5 Bias(8), Bias(16), %R(7), %R(28), MACD(13,39,5), MACD(14,45,5) 6
Hit rate 72.43% 74.04% 74.25% 74.25% 74.04% 74.04% 69.01%
The neutral trend is usually the most difficult part that can be accurately predicted. When a stock market stays in a neutral trend, the investment return won’t be significantly affected by whichever prediction or investment decision is made. If accurate predictions are scattered around and not consecutive to some extent, they may become useless for making investment decisions. Table 10 includes the percentages of accurate TAIEX trend predictions excluding the neutral trend and/or under the condition that at least five consecutive days must show the same market trend. Seven forecasting systems with different combinations of input indicators are selected here. Their hit rates range from 74.25% to 69.23%, and decrease to 70.62%62.17% if the aforementioned condition is imposed. The hit rates increase to 83.52%-76.89% when the neutral trend is excluded. The requirement of at least five consecutive days showing the same trend brings down the hit rates to 80.32%-70.71%. Table 10. Percentage of accurate predictions on the testing data for some selected forecasting systems Hit rate Input indicators Bias(8), %R(28), MACD(14,45,5) Bias(8), %R(28) Bias(8), %R(28), MACD(13,39,5) Bias(8), %R(7), MACD(14,45,5) %R(7), %R(28) %R(7), MACD(14,45,5) Bias(16), MACD(14,45,5)
74.25% 74.04% 73.64% 73.44% 72.43% 71.63% 69.23%
consecutivea 70.62% 70.62% 69.82% 69.82% 64.78% 65.59% 62.17%
Hit rate excluding neutral trends
83.07% 83.52% 82.38% 83.52% 82.38% 81.01% 76.89%
consecutivea 80.32% 80.32% 79.41% 79.41% 73.68% 74.59% 70.71%
a: At least 5 consecutive days must show the same trend
5.4 Knowledge waning effect Braun and Chandler (Braun and Chandler, 1987) used a learning-from-example approach and observed that the effectiveness of the rules wanes as the time from rule generation to rule application widens. Table 11 depicts the hit rates of the TAIEX trend forecasting in different testing periods. For every combination of input indicators listed in Table 11, its 2nd-year hit rate is higher than its 1st-year hit rate. The testing results indicate that there is no waning effect of the knowledge acquired from the network training. The lower 1st-year hit rate is believed to be caused by the price pattern. Turning signals revealed from a forecasting system 191
C.-T. Lee, J.-S. Tzeng / Asia Pacific Management Review 18 (2) (2013) 181-195
based on technical indicators are often lagging behind actual turning points. This phenomenon also applies to our neural network forecasting system. Therefore, highly fluctuated (i.e., no obvious price trend) and volatile price patterns are harder for network training and normally have lower hit rates than less fluctuated and volatile price patterns. Table 11. Percentage of accurate predictions on the testing data in different time periods Input indicators
Hit rate (1st year)
(2nd year)
(Total)
Bias(8), %R(28), MACD(14,45,5) Bias(8), %R(28) Bias(8), %R(28), MACD(13,39,5) Bias(8), %R(7), MACD(14,45,5) %R(7), %R(28)
69.60% 70.40% 70.00% 70.00% 69.60%
78.95% 77.73% 77.33% 76.92% 75.30%
74.25% 74.04% 73.64% 73.44% 72.43%
5.5 Investment returns The effectiveness of our neural network forecasting system in improving investment returns is investigated using the Bias(8), %R(28), and MACD(14,45,5) combination and the aforementioned trading strategies. The trained forecasting system is tested on the TAIEX data ranging from January 2004 to December 2005. The resulting investment return is then compared with those obtained from a price-oriented reference neural network system and the buy-and-hold strategy. The reference neural network system is duplicated from the best model and the best trading strategy presented by Yao, Tan, and Poh (1999). It has a 6-4-3-1 neural network and receives six input indicators. The six input indicators are the index/price values at time t-1 and t (It-1 and It), moving averages (MA5 and MA10), Relative Strength Index (RSI), and momentum (M). The reference system uses price targets for network training to predict one-day-ahead stock prices/indices. Their best trading strategy is based on the difference between predictions. Table 12. Comparison of investment returns on the testing data for different trading systems (including transaction costs) Bias(8),%R(28),MACD(14,45,5) Reference system Initial TAIEX 6041.56 6041.56 Total transaction cycles 55 247 Winning transaction cycles 27 99 5399.9 8556.0 Profitsa from winning cycles Average profitsa/cycle 200 86.4 Losing transaction cycles 28 148 a Losses from losing cycles -2016.9 -9057.5 Average lossesa/cycle -72 -61.2 3383.0 -501.6 Total profits or lossesa Total profits or losses (%) 56.0% -8.3% Mean of accumulated 1839.20 -341.91 profits/lossesa Standard deviation of 804.7 396.1 accumulated profits/lossesa a: The unit of profits or losses is the TAIEX point
192
Buy & hold 6041.56 1 1 503.8 503.8 0 0 0 503.8 8.3% 19.78 329.3
C.-T. Lee, J.-S. Tzeng / Asia Pacific Management Review 18 (2) (2013) 181-195
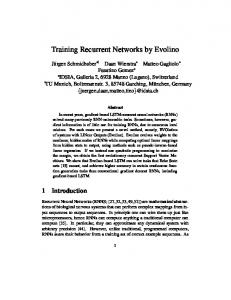
Both the investment return and the transaction cost are expressed in TAIEX points. The transaction cost per each long or short unit of Futures is 1.5 TAIEX points. A transaction cycle includes a long position and a short position. As shown in Table 12, the investment return of 3548 points achieved through our system is about 7 and 14.8 times as many as the 506.8 and 239.4 points through the buy-and-hold strategy and the reference system, respectively. Even if the transaction costs are included, our system (3383.0) still nicely outperforms the buy-and-hold strategy (503.8) and the reference system (-501.6). Positive investment profits are achieved in 27 out of 55 transaction cycles. Though only about half of the transaction decisions lead to positive returns, the average profit per winning cycle (203) significantly outnumbers the average loss per losing cycle (-69). In our opinion, this is due to the trend component in the stock market movement and these trends are predictable. The above results are consistent with the high hit rate of 70.62% achieved for the Bias(8), %R(28), and MACD(14,45,5) combination under the condition that at least 5 consecutive days must show the same trend. Highly fluctuated price predictions from the reference system results in a high transaction cost (247 transaction cycles) and low prediction accuracy (99 winning cycles versus 148 losing cycles). Figure 2 shows the accumulated profits or losses during the testing period for the three different trading systems. As can be seen, our system is able to take advantage of bearish trends, and still maintains reasonably good performance in bullish and neutral trends. However, this system may not obtain a significant gain in highly fluctuated and volatile regions, such as the region near the beginning of the testing period.
3500
this study
Accumulated Profits/Losses
buy & hold reference
2500
1500
500
-500
-1500 1
51
101
151
201
251
301
351
401
451
Time (days)
Figure 2. Accumulated profits or losses on the testing data for different trading systems 6. Conclusion An effective trend-oriented method based on a moving average has been presented for training neural networks to predict price trends. The method has been successfully demonstrated on a simple back-propagation neural network with the use of three technical indicators, Bias, %R, and MACD indicators. Accurate prediction rates of about 70% are achievable when one single indicator is used. When multiple input indicators are properly combined, the accurate prediction rates can be improved to around 74.3% or 83.1% if 193
C.-T. Lee, J.-S. Tzeng / Asia Pacific Management Review 18 (2) (2013) 181-195
neutral trends are excluded. Increasing the number of input indicators does not necessarily improve the prediction accuracy if the input signals create more noises than correlations to the market movement. No waning effect of the knowledge acquired from training of this forecasting system is observed. A simple trading strategy based on the price trend predictions of our forecasting system yields much higher investment returns than a price-oriented reference neural network system and the buy-and-hold strategy. The results demonstrate the effectiveness of this trendoriented training which emphasizes on learning the macroscopic price trends rather than the microscopic price variations. A moving average is a smoother of time series and a good representation of the price trend, and thus suitable for the trend targets. Our method gives the system reliable learning targets to capture dynamic financial patterns as well as identify price trends. A trade-off between fluctuation reduction and loss of detailed information has to be made when choosing a moving average as a trend target. References Armano, G., Marchesi, M., Murru, A. (2005) A hybrid genetic-neural architecture for stock indexes forecasting. Information Sciences, 170, 3-33. Braun, H., Chandler, J. (1987) Predicting stock market behavior through rule induction: An application of the learning-from-example approach. Decision Sciences, 18, 415-429. Chang, P.C., Liu, C.H., Lin, J.L., Fan, C.Y., Ng, C. (2009) A neural network with a case based dynamic window for stock trading prediction. Expert Systems with Applications, 36, 6889-6898. Chen, Y., Mabu, S., Shimada, K., Hirasawa, K. (2009) A genetic network programming with learning approach for enhanced stock trading model. Expert Systems with Applications, 36, 12537-12546. Colby, R.W. (2002) The Encyclopedia of Technical Market Indicators (2nd ed.). McGrawHill, New York. Freitas, F.D., De Souza, A.F., de Almeida, A.R. (2009) Prediction-based portfolio optimization model using neural networks. Neurocomputing, 72, 2155-2170. Glaria-Bengoechea, A., Ordofiez-Ureta, C., Marchant-Saavedra, M., Opaz0-Medina, N. (1996) Stock market indices in Santiago de Chile: Forecasting using neural networks. Proceedings of the IEEE International Conference on Neural Networks, 2172-2175. Hurst, J. (2000) The Profit Magic of Stock Transaction Timing. Traders Press, Greenville, SC. Kaboudan, M. (2000) Genetic programming prediction of stock prices. Computational Economics, 16, 207-236. Lee, C.T., Chen, Y.P. (2007) The efficacy of neural networks and simple technical indicators in predicting stock markets. Proceedings of the International Conference on Convergence Information Technology, 2292-2297. Lin, H.Y., Juan, Y.F., Chen, A.P. (2007) Hybrid intelligent trading approach—XCS neural network model for Taiwan stock index trend forecasting. Proceedings of the International Conference on Convergence Information Technology, 1408-1414. Lui, Y.H., Mole, D. (1998) The use of fundamental and technical analyses by foreign exchange dealers: Hong Kong evidence. Journal of International Money and Finance, 17, 535-545. Millard, B.J. (1999) Channels and Cycles: A Tribute to J. M. Hurst. Traders Press, Greenville, SC. Negnevitsky, M. (2005) Artificial Intelligence: A Guide to Intelligent Systems (2nd ed.). Pearson Education, New York. 194
C.-T. Lee, J.-S. Tzeng / Asia Pacific Management Review 18 (2) (2013) 181-195
Yao, J., Tan, C.L., Poh, H.L. (1999) Neural networks for technical analysis: A study on KLCI. International Journal of Theoretical and Applied Finance, 2, 221-241. Zhu, X., Wang, H., Xu, L., Li, H. (2008) Predicting stock index increments by neural networks: The role of trading volume under different horizons. Expert Systems with Applications, 34, 3043-3054.
195