Trends in Midlevel Provider Utilization in Emergency Departments from 1997 to 2006 Michael D. Menchine, MD, MPH, Warren Wiechmann, MD, MBA, and Scott Rudkin, MD, MBA
Abstract Objectives: The objective was to quantify the expansion of midlevel provider (MLP) practice in U.S. emergency departments (EDs) over the past decade. Specifically, we sought to quantify the absolute number of patients seen by MLPs, the annual growth rate of patients seen by MLPs, and the expansion in the proportion of EDs using MLPs. Methods: Data were analyzed from the ED portion of the 10 most recent years (1997 to 2006) National Hospital Ambulatory Medical Care Survey (NHAMCS), a nationally representative survey of ED visits compiled by the Centers for Disease Control and Prevention (CDC). The main outcomes of interest were the proportion and absolute numbers of ED patients seen by MLPs during the 10-year study period. National estimates derived from sample weights are reported. In addition, a multivariate logistic regression model was created with ‘‘seen by midlevel provider’’ as the dependent variable to determine factors associated with being seen by a MLP. Results: Between 1997 and 2006, 8.23% (95% confidence interval [CI] = 7.31% to 9.15%) of ED patients were seen by a MLP. The proportion of ED patients seen by MLPs increased from 5.5% (95% CI = 3.8% to 7.1%) in 1997 to 12.7% (95% CI = 10.5% to 14.9%) in 2006 (13% annual growth). This corresponds to an increase in the number of ED patients seen by MLPs from 5.2 million in 1997 to 15.2 million in 2006. The proportion of hospitals using MLPs in the ED increased from 28.3% (95% CI = 22.4% to 34.1%) in 1997 to 77.2% (95% CI = 71.2% to 83.3%) in 2006 (17% annual growth). Slightly over half of MLP cases (54.9%; 95% CI = 49.1% to 60.7%) were also seen by staff physicians. On multivariate regression, younger patient age, non–southern geographic region, and triage acuity were associated with increased MLP use. Conclusions: The number of ED patients seen by MLPs has increased sharply, from 5.2 million in 1997 (5.5% of all ED cases) to 15.2 million in 2006 (12.7% of all ED cases). Similarly, the proportion of EDs reporting use of MLPs has increased from 28.3% in 1997 to 77.2% in 2006. ACADEMIC EMERGENCY MEDICINE 2009; 16:963–969 ª 2009 by the Society for Academic Emergency Medicine Keywords: nurse practitioner, physician assistant, ED staffing, National Hospital Ambulatory Medical Care Survey, midlevel providers
U
nited States emergency department (ED) utilization increased 25% annually over the past decade.1 EDs now care for 119 million patients annually. Poor access to primary care and subsequent increases in nonurgent cases have been purported to be a major cause of this increase.2,3 Despite increases in the number of emergency medicine (EM) residency programs, the number of trained emergency physicians From the Department of Emergency Medicine, University of California School of Medicine (MDM, WW, SR), Irvine, CA. Dr. Menchine is currently with the Department of Emergency Medicine, University of Southern California, Los Angeles, CA. Received May 5, 2009; revision received May 24, 2009; accepted June 10, 2009. Address for correspondence and reprints: Michael Menchine, MD, MPH; e-mail:
[email protected]. A related commentary appears on page 984.
ª 2009 by the Society for Academic Emergency Medicine doi: 10.1111/j.1553-2712.2009.00521.x
(EPs) has not met the current demand.4,5 A recent workforce analysis suggested that the supply of EPs would not meet the demand for a minimum of 30 years.6 These workforce shortages may be more pronounced in rural EDs.7,8 As a result, ED nurse practitioners and physician assistants (collectively termed midlevel providers [MLPs]) have been lauded as a potential solution to this workforce shortage.9–11 While less costly on an hourly basis, these MLPs’ qualifications are not tightly regulated by a board certification process specific to EM; MLPs are generally trained to provide care in collaboration with physicians, not replace them. The available literature is largely positive with respect to MLPs in the ED. Several reports have shown that MLPs are accepted by patients and can provide quality care with improvement in patient satisfaction and a reduction in wait times.12–17 Little is known about the numbers and types of patients seen by MLPs in the ED. MLPs may treat those
ISSN 1069-6563 PII ISSN 1069-6563583
963
964
Menchine et al.
patients who access the ED for uncomplicated, primary care services. Under this assumption, the more highly skilled and more costly EPs can care for more complex ED cases. Alternatively, MLPs may care for a case mix that closely approximates that seen by fully trained EPs. In this latter case, where MLPs are performing a service similar to EPs, the lower wages MLPs command may undercut EP wages and compromise the standards set forth by the American Board of Emergency Medicine.18 Guidelines from professional societies regarding the use of MLPs have been vague. Specific recommendations describing scope and supervision of MLP practice have been deferred to individual institutions or physicians.19–21 Administrators, policy experts, and professional societies should understand the scope and evolution of MLP practice to inform policy decisions. We sought to quantify the expansion of MLP practice in U.S. EDs over the past decade. Specifically, we sought to 1) quantify the absolute number and the annual growth rate of patients seen by MLPs, 2) describe the expansion in the proportion of EDs using MLPs, and 3) determine the types of cases for which MLPs provided care and whether this case mix has changed over time. METHODS Study Design This was a retrospective analysis of MLPs in EDs using the National Hospital Ambulatory Medical Care Surveys (NHAMCS) database. This investigation was certified exempt from institutional review board review. Study Data Set The only national database containing information on the use of MLPs in the ED is the NHAMCS. We utilized the 10 most current years of data (1997–2006). The Centers for Disease Control and Prevention’s (CDC) National Center for Health Statistics obtains NHAMCS data annually through a national sample of visits to the EDs of noninstitutional general and short-stay hospitals, exclusive of federal, military, and Veterans Administration hospitals, within the United States. The purpose of the survey is to provide reliable national estimates of the characteristics of patients seen and services rendered in U.S. EDs. To this end, the survey utilizes a four-stage probability design with samples of geographically defined areas, hospitals within these areas, clinics within the outpatient departments, and emergency service areas within the EDs of these hospitals and patient visits to these clinics and emergency services areas. Data are abstracted from the ED medical records by trained abstractors at each participating institution during randomly assigned 4-week blocks. Nonresponse rates and errors in transcription or data collection are systematically reviewed and generally considered to be very low. The details of the quality assurance program are in the public record.22 Measures Our primary variable of interest was whether the patient was cared for by an MLP or an EP. NHAMCS does not define MLP, but records whether the patient
•
TRENDS IN MIDLEVEL PROVIDER UTILIZATION IN EDS
was evaluated by a nurse practitioner or a physician assistant. We created a summary variable termed ‘‘midlevel provider’’ that included both of these provider groups. In addition, from 1997 to 2004, NHAMCS recorded whether a staff physician saw the patient. In 2005 and 2006, the data collection sheet was changed and different practitioner choices were included. For this reason we limit the analysis of which patients were seen by a staff physician to those seen between 1997 and 2004. The NHAMCS collects data on the patient’s triage acuity. There are five possible categories, to be seen in: 1) less than 15 minutes, 2) 15–60 minutes, 3) 60–120 minutes, 4) >120 minutes, and 5) missing. Data regarding wait times, length of stay, reason for visits, and demographic categories such as race, sex, and age are also recorded. Data Analysis All estimating procedures accounted for the complex sampling design using the ‘‘svy’’ function in STATA 9.2 (StataCorp, College Station, TX) and the weighting procedures described by the National Center for Health Statistics.23 Specifically, we employed the ultimate cluster design (single-stage sampling) in variance and 95% confidence interval (CI) calculations utilizing masked stratum and primary sampling unit identifiers provided with the NHAMCS public use data set, as described by the ambulatory statistics branch of the CDC.23 Prior efforts by the organizers of the data set at the CDC have shown that this method provides correct point estimates and conservative variance estimates.24 Validity of the weighting procedures used was confirmed by comparing results obtained in our study with previously published weighted results from the CDC.1 Estimates of the number and proportion of patients seen by MLPs were calculated with 95% CIs accounting for the survey design. Trend analyses in case-mix acuity were conducted using least squares linear regression. Specifically, we divided the study period into months and calculated the proportion of patients in each triage category by month. We then used linear regression to determine the relationship between the proportion of patients in each triage category and time. In addition to the primary objectives of this study, we theorized that the odds of being seen by a MLP might be influenced by patient demographic characteristics, disease factors, hospital characteristics, and changes over time. We considered that MLPs are less costly than EPs. Therefore, factors that result in lower reimbursement, such as uninsurance, may be associated with higher MLP use. Similarly, for-profit hospitals might have differing rates of MLP use compared with not-for-profit hospitals. In addition, we thought regional variation, particularly with respect to rural and nonrural areas, may affect MLP use. Finally, we hypothesized that more ill patients would be less likely to be seen by MLPs. To evaluate these potential associations, we conducted multivariate logistic regression using ‘‘seen by MLP’’ as the dependent variable. Specific independent variables included in the model were selected based on the theoretic considerations described above and not through automatic statistical
ACAD EMERG MED • October 2009, Vol. 16, No. 10
•
www.aemj.org
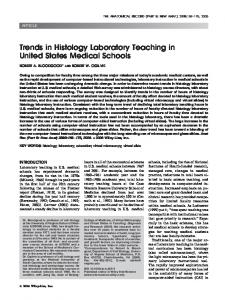
procedures. Specific patient demographic factors that were considered were insurance status, race, ethnicity, sex, and age. Insurance status is coded in NHAMCS as the expected source of payment. Hospital factors considered included the region of the country in which the hospital is located, whether or not it is in a metropolitan statistical area, and the ownership of the hospital. NHAMCS categorizes hospital ownership as ‘‘forprofit,’’ ‘‘not for-profit,’’ and ‘‘government.’’ We used triage immediacy as a surrogate for severity of patient illness. The multivariate regression was conducted using STATA 9.2 and the estimated odds ratios (ORs) generated accounted for the sampling design. Interaction terms were generated to evaluate the possibility of significant effect modification of the main variables. In particular, year was interacted with hospital ownership, insurance type, age, and triage immediacy. These interaction terms demonstrated less than 10% effect modification and were, therefore, omitted from the final model. The regression model goodness-of-fit was assessed using ‘‘svylogitgof’’ command that determines the Hosmer-Lemeshow statistic and suggested no evidence of lack of fit (p = 0.43).25 RESULTS Overall, 8.23% (95% CI = 7.31% to 9.15%) of ED patients were seen by an MLP from 1997 to 2006. While ED census had an annual growth rate of 2.6%, during the study period, the number of patients cared for by MLPs increased 19% annually, from 5.2 million visits in 1997 to 15.2 million in 2006. The proportion of ED patients seen by MLPs increased from 5.5% (95% CI = 3.8% to 7.1%) in 1997 to 12.7% (95% CI = 10.5% to 14.9%) in 2006, a 13% annual growth (Figure 1). Similar findings were observed when nurse practitioners and physician assistants were analyzed individually. The proportion of ED patients seen by nurse practitioners increased annually from 1.6% in 1997 to 4.1% (15%
965
annual growth) in 2006, and the proportion of patients seen by physician assistants increased from 3.9% to 8.7% (12% annual growth). The proportion of EDs that used MLPs increased from 28.3% (95% CI = 22.4% to 34.1%) in 1997 to 77.2% (95% CI = 71.2% to 83.3%) in 2006, representing a 17% annual growth rate. Table 1 displays characteristics of the patients seen by MLPs compared to those not seen by MLPs. Most demographic and insurance categories were equally distributed between these two groups. Notable differences between the groups were seen in the triage urgency of patients, where MLP patients were more likely to be triaged to less urgent categories. However, 11.4% of all patients seen by MLPs were in the highest triage category, and 8.0% (95% CI = 7.0% to 8.9%) of their patients were admitted to the hospital (compared with 17 and 14%, respectively, of patients seen by EPs). The case mix of MLPs changed during the study period (Figure 2). The proportion of MLP patients in the highest (most acute) two triage categories decreased from 44.4% to 39.9%. Simultaneously, the proportion of EP patients in the lowest (least acute) two triage categories increased from 49.4% to 53.1%. The proportion of MLP patients admitted to the hospital increased slightly from 7.8% to 8.7% during the study period. Of patients treated by MLPs, 54.9% (95% CI = 59.6% to 70.2%) were also noted to have been seen by an EP during the study period. The proportion of MLP patients also seen by an attending decreased from 57.7% to 54.3%. Patients seen by MLP waited on average 57.9 minutes (95% CI = 53.0 to 62.9 minutes), while those only seen by EPs waited 47.4 minutes (95% CI = 45.3 to 49.4 minutes) after adjusting for year and triage acuity. Table 2 shows the results of the multivariate logistic regression. Insurance and race categories had little association with MLP use, while southern region (OR = 0.65, 95% CI = 0.45 to 0.95), age over 65 years (OR = 0.78, 95% CI = 0.68 to 0.90), and for-profit hospital (OR = 0.64, 95% CI = 0.44 to 0.92) were negatively associated with MLP use. Low triage acuity was associated with the largest OR of being seen by an MLP (OR = 2.71, 95% CI = 2.56 to 2.86) compared with the highest triage acuity. Patients in nonmetropolitan areas had a similar chance of being seen by an MLP (OR = 0.85, 95% CI = 0.59 to 1.21), compared with patients in metropolitan areas. DISCUSSION
Figure 1. Trends in MLP use from 1997 to 2006. MLP = midlevel provider.
The use of MLPs in U.S. EDs has expanded dramatically in the past decade, in terms of both the proportion of patients seen by MLPs and the proportion of EDs using MLPs. Five and a half percent of ED cases were seen by MLPs in 1997, while 12.7% were seen by MLPs in 2006 (13% annual growth). This corresponds to an absolute increase from 5.2 million patients seen by MLPs in 1997 to 15.2 million in 2006. Simultaneously, the proportion of EDs utilizing MLPs increased from 28.3% in 1997 to 77.2% in 2006 (17% annual growth). Potential reasons for this increased MLP utilization include relatively lower wages, workforce shortages among board-certified or board-eligible physicians, and increased numbers of lower-acuity patients seeking
966
Menchine et al.
•
TRENDS IN MIDLEVEL PROVIDER UTILIZATION IN EDS
Table 1 Characteristics of Patients Characteristic Population size (estimate) Private insurance Medicare insurance Medicaid insurance Self-pay Hispanic ethnicity White race Black or African American race Asian race Other race West region Northeast region Midwest region Southern region Owner nonprofit Owner for-profit Owner government Age, yr Triage (minutes) 120 Admitted Wait time (minutes)
Not Seen by Midlevel, % (95% CI)
Seen by Midlevel, % (95% CI)
993 39.3 15.3 20.2 15.6 11.2 75.1 21.9 1.9 1.1 17.4 18.9 24.4 39.3 71.3 11.4 17.3 35.9
million (38.3–40.3) (14.4–15.8) (19.4–21.0) (15.0–16.1) (9.8–12.6) (73.3–76.8) (20.2–23.6) (1.5–2.2) (0.8–1.3) (14.7–20.1) (17.0–20.8) (21.3–27.5) (35.7–42.8) (68.2–74.5) (9.3–13.4) (14.6–19.9) (SD ±23.7)
89 43.0 11.4 20.1 16.6 11.7 75.6 21.3 2.1 0.8 20.3 23.4 24.6 31.7 79.6 7.1 13.3 33.5
million (41.0–44.9) (10.4–12.23) (19.3–22.6) (15.5–17.6) (9.9–13.4) (72.8–78.4) (18.7–24.0) (1.6–2.6) (0.5–1.2) (15.8–24.8) (17.9–28.9) (19.9–29.2) (26.5–36.9) (74.3–84.9) (4.6–9.6) (8.2–18.3) (SD ±36.2)
33.7 17.6 10.3 17.8 14 47.4
(32.2–35.2) (16.4–18.8) (9.3–11.3) (16.6–19.0)
29.5 26.8 18.2 11.4 9 57.9
(27.2–31.8) (23.9–29.7) (15.7–20.7) (9.5–13.4)
(45.3–49.4)
Figure 2. Case-mix of patients seens by MLPs from 1997–2006.
care at EDs.2,3 While EP shortages may warrant some degree of MLP staffing, the dramatic expansion noted in this study calls for careful scrutiny over the scope and supervision of services they provide. We found that MLPs treat the less ill or injured, compared to EP counterparts. Patients in the lowest triage category comprise 18.2% of patients seen by MLPs, compared with 10.3% of patients seen by EPs. However, 11% of patients seen by MLPs are in the highest triage category and 8% require general hospital admission (compared with 13.6% by EPs). The case-mix analysis demonstrated a change over time with the proportion of MLP patients in the highest triage categories decreasing from 44.4% to 39.9%, while the proportion of EP patients in the lowest (least acute) triage categories increased from 49.4% to 53.2%. The proportion of MLP patients admitted to the hospital changed slightly from 7.8% to 8.7% during the study. At a minimum, this suggests that MLPs are not increasingly becoming ‘‘physician-like’’ in their case mix. Still, a large proportion of MLP patients
(53.0–62.9)
are in the highest triage acuity groups, suggesting that the expansion in MLP use has not been restricted to lower acuity patients. Some cases seen by MLPs (45.1%) were not documented to have been seen by a staff physician. The trend analysis did not demonstrate a meaningful change in the proportion of patients seen by MLPs who were also seen by an EP over time. Our analysis does not allow a determination of the level of supervision MLPs receive during their patient care duties. To the best of our knowledge, there are currently no published studies that detail the level of supervision MLPs receive in the ED. The existing literature confirms that MLPs efforts have helped mitigate crowding, curbed a rise in waiting times, and allowed for lower ED operational costs.26,27 Other reports document that ED patients are satisfied with and may even prefer the care they receive from MLPs.16,17,28,29 Still, Larkin et al.30 showed that senior EM residents were largely unwilling to be treated by MLPs, particularly if they had nonminor illness or injury, suggesting some perceived differences in quality of care. Efforts to develop assessment tools and define the scope of practice of emergency MLPs have been published but not widely adopted.31–33 It is important to consider that MLPs have been successfully utilized in primary care settings for decades.34 However, in primary care, the MLP and physician supervisor work closely on a daily basis, thereby establishing the appropriate level of autonomy to be granted. This does not reflect the complexity of ED staffing. Further, ED patients have no or very little choice as to who their provider will be and extremely limited ability to directly determine the quality of medical care they are receiving. For decades EM professional societies have contentiously debated the appropriate path to physician
ACAD EMERG MED • October 2009, Vol. 16, No. 10
•
www.aemj.org
967
Table 2 Multivariate Logistic Regression: Dependent Variable Is ‘‘Seen by Midlevel Provider’’ OR (95% CI) Private insurance Medicare Medicaid Self pay White race Black or African American race Asian race Hispanic ethnicity West region Northeast region Midwest region South region Nonprofit hospital For-profit hospital Government hospital Age (yr) 65 Triage acuity (minutes) 120 Metropolitan statistical area Year Male
Reference 0.92 (0.82–1.03) 0.94 (0.84–1.06) 0.99 (0.91–1.07) Reference 0.95 (0.83–1.09) 1.01 (0.82–1.24) 0.99 (0.81–1.07) Reference 0.92 (0.64–1.34) 0.81 (0.54–1.22) 0.65 (0.45–0.95) Reference 0.64 (0.44–0.92) 0.68 (0.45–1.15)
p-value 0.16 0.30 0.72 0.472 0.949 0.303 0.674 0.311 0.024 0.016 0.166
Reference 1.14 (1.05–1.24) 0.95 (0.86–1.04) 0.78 (0.68–0.90)
0.001 0.231