AQUATIC MICROBIAL ECOLOGY Aquat Microb Ecol
Vol. 24: 83–97, 2001
Published March 28
Trophic interactions between zooplankton and the microbial community in contrasting food webs: the epilimnion and deep chlorophyll maximum of a mesotrophic lake Rita Adrian1,*, Stephen A. Wickham2, Nancy M. Butler 3 1
Institut für Gewässerökologie und Binnenfischerei, Müggelseedamm 301, 12587 Berlin, Germany 2 Zoologisches Institut, Universität zu Köln, Weyertal 119, 50923 Köln, Germany 3 Department of Biology, Gustavus Adolphus College, St. Peter, Minnesota 56082, USA
ABSTRACT: Trophic interactions between the mesozooplankton and the microbial web (bacteria, protozoa) were studied in 2 in situ grazing experiments in the epilimnion and the deep chlorophyll maximum (DCM) of a mesotrophic lake. We combined the Landry-Hassett dilution technique, whereby growth and grazing rates can be determined simultaneously, with the presence or absence of mesozooplankton and additional nutrients. The epilimnion was cladoceran-dominated, and had relatively high ciliate, and low heterotrophic nanoflagellate (HNF) abundance, while the DCM was rotifer-dominated, with fewer ciliates, but higher HNF abundance. Temperature differed by 13°C (22°C in the epilimnion; 9°C in the DCM). The community differences between the epilimnion and DCM and the experimental manipulations had their greatest effects on ciliates, lesser effects on HNF, and essentially no net effect on bacteria. Bacteria growth rates and grazing losses did not differ between the epilimnion and DCM, despite the large differences in chlorophyll a and abiotic parameters, and were independent of nutrient addition or mesozooplankton removal. In contrast, the experimental manipulations produced relatively moderate changes in HNF growth rates and grazing losses in both the epilimnion and DCM. Although HNF densities were 3 times higher in the DCM than the epilimnion, epilimnetic HNF growth rates were approximately twice the rate found in the DCM. This was consistent with both higher temperature and a release from predation through indirect predatory effects on alternative HNF predators like ciliates. In the DCM, crustacean zooplankton were less abundant and therefore had smaller direct and indirect effects on the HNF, while the metazoan microzooplankton (mainly rotifers) were more important. Ciliate growth rates were lower in the epilimnion than in the DCM, but only in the epilimnion were ciliate growth rates enhanced by the addition of nutrients. The cladoceran-dominated community of the epilimnion was able to reduce ciliate growth rates to negative values, while in the rotifer-dominated DCM, ciliate growth rates were always positive along a predator density gradient. These results demonstrate that while ciliates, and to a lesser extent heterotrophic flagellates, respond quickly to changes in predator community composition, there are so many other direct and indirect pressures on bacteria that changes in the mesozooplankton community composition have no net effect on their adundance. KEY WORDS: Trophic interactions · Microbial web · Deep chlorophyll maximum · Mesozooplankton Resale or republication not permitted without written consent of the publisher
INTRODUCTION It is well established that protist abundance and growth rates can be negatively affected by daphnids, copepods, and rotifers (Sanders & Wickham 1993, *E-mail:
[email protected] © Inter-Research 2001
Wiackowski et al. 1994, Dobberfuhl et al. 1997, Merrell & Stoecker 1998, Wickham 1998, Mohr & Adrian 2000). On the other hand, manipulations of crustacean zooplankton have only rarely resulted in changes in bacterial biomass (Pace & Funke 1991, Wickham & Gilbert 1991, Pace 1993, Wickham 1998, Adrian & SchneiderOlt 1999; but see Jürgens et al. 1994), and chlorophyll
84
Aquat Microb Ecol 24: 83–97, 2001
is not a good predictor of bacterial abundance (Pace 1993). Predatory effects of zooplankton on the microbial community are species-specific (Brett et al. 1994, Burns & Schallenberg 1996, Wickham 1998, Adrian & Schneider-Olt 1999, Mohr & Adrian 2000). Thus, the trophic links should differ in the course of the seasonal planktonic succession (Sanders et al. 1994) or in different compartments of the same habitat such as the welloxygenated epilimnion, microaerobic zones such as the metalimnion, or anoxic zones of the hypolimnion. If the effects of trophic interactions on protozoans are similar to those on phytoplankton, then metazoan zooplankton (metazooplankton) communities dominated by small species will be less efficient grazers on protozoans than communities dominated by large-bodied species (sensu Vanni & Findlay 1990). A commonly found phenomenon in lakes of moderate productivity such as the mesotrophic lake we focus on here, is the development of a deep chlorophyll maximum (DCM) occurring in association with sharp gradients of temperature and oxygen (Fee 1976, Cullen 1982, Kasprzak et al. 2000). Such maxima are often formed by largely monospecific blooms of cyanobacteria, cryptophytes or chrysophytes, and are frequently associated with high ciliate abundance (Pedrós-Alió et al. 1987, Lindholm & Mörk 1990, Gasol et al. 1992a, Adler et al. 2000). Common features of DCMs are that organisms are present not only in high abundance, but they also persist through time. It has been hypothesized that the absence of succession in time may be largely due to lack of efficient predation (Fee 1976, Gasol et al. 1992b). However, many rotifers which feed on phytoplankton and the microbial community form mass aggregations in close association with the DCM (Lindholm 1992, Dolan & Marrasé 1995, Pedrós-Alió et al. 1995). Moreover, larger zooplankton, such as copepods and cladocerans, accumulate closely above the DCM, where oxygen is largely depleted but H2S is not yet present (Kettle et al. 1987, Gasol et al. 1995), a phenomenon also present in our study lake (Adrian unpubl. data). This research focussed on contrasting the trophic interactions between the zooplankton and the microbial web in the epilimnion with those in the DCM of a mesotrophic lake during summer. The plankton community differs considerably between the epilimnion and the DCM, and this heterogeneity at most trophic levels may influence the trophic links within the different compartments. This is the first study which focuses on mechanisms underlying protozoan dynamics in contrasting food webs within a small vertical spatial scale. We used a modification of the dilution technique (Landry & Hassett 1982) for in situ grazing experiments in the epilimnion and the DCM to estimate growth and grazing rates of the microbial community (bacteria, heterotrophic nanoflagellates, ciliates) in the
presence and absence of mesozooplankton predators (herein defined as cladocerans, copepodites and adult copepods). We tested the hypothesis that despite the spatial proximity of the epilimnion and DCM, the different biotic and abiotic conditions of the 2 habitats would generate large differences in the control mechanisms of their respective microbial food webs.
METHODS Study site. The Großer Vätersee (0.12 km2; maximum depth 11.5 m; mean depth 5.2 m) is a shallow, mesotrophic, dimictic lake north of Berlin, Germany (52° 58’ N, 13° 50’ E). Epilimnetic soluble reactive phosphorus (SRP) concentrations are usually below 10 µg l–1 (annual mean between 1995 and 1997 = 6.4 ± 3.3 µg l–1). The epilimnetic annual mean chlorophyll a concentration is 4.52 ± 0.29 µg l–1. At the onset of thermal stratification, oxygen concentrations below the thermocline decline to levels beneath detection limits. At the same time, a pronounced DCM dominated by the filamentous cyanobacteria Planktothrix sp. becomes established in the microaerobic zone at 7 to 8 m water depth from July through September. (For details on the fish and plankton communities see Kasprzak et al. 2000.) In situ measurements of temperature, oxygen and fluorescence. In situ profiles of water temperature and oxygen concentrations (H20 Multiparameter Water Quality Data Transmitter, Hydrolab Corporation) were taken at 1 m intervals above and below the DCM and at 10 cm intervals in and around the DCM. The location of the DCM was indicated by in situ fluorescence profiles (Backscat Fluorometer, Dr Haardt, Model 1302). Dilution experiments. Dilution experiments were conducted in the epilimnion (12 to 15 August 1996) and in the DCM (19 to 22 August 1996) of the Großer Vätersee. The experimental protocol followed that of Landry & Hassett (1982), combined with the presence or absence of mesozooplankton and additional nutrients. Lake water (120 l) was collected at 2 m water depth from the epilimnion and at 7.3 m with a horizontal van Dorn sampler in the DCM (where a fluorescence profile had revealed the location of the chlorophyll maximum, see Fig. 1). The day prior to the experiments, 100 l water was collected from the same depth, brought to the laboratory, filtered through 0.2 µm pore size membrane filters, and stored overnight at 20°C. Experiments were run in 5 l clear plastic bags; the bags were filled in random order. Filtered and unfiltered water was added to the bags to produce dilutions of 100, 65, 50, 25, 10% unfiltered water. These dilutions were then cross-classified with either the addition of nutrients, or the removal of zooplankton
Adrian et al.: Trophic interactions between zooplankton and microbial community
larger than 63 µm from half the bags. Nutrient solutions (2 ml) were added to appropriate bags to yield final concentrations of 25 µg l–1 PO43+, 400 µg l–1 NO3– and 10 µg l–1 NH4+. In the minus-zooplankton treatments whole water was filtered through a 63 µm-mesh net to remove mesozooplankton prior to filling the bags. The plus-zooplankton treatments were therefore composed of the natural epilimnetic or DCM plankton community. Each dilution was combined with each of the following nutrient and zooplankton treatments: (1) –nutrients –zooplankton; (2) +nutrients –zooplankton; (3) –nutrients +zooplankton; (4) +nutrients +zooplankton. Each treatment combination had 2 replicates per dilution for a total of 40 bags per experiment (4 treatment combinations × 5 dilutions × 2 replicates). Bags were incubated at 1.5 m (7.3 m for the DCM experiment) suspended from a 1.5 m × 1.5 m wooden frame supported by floats at the water surface and anchored with a wire cable. Weights were attached to the bags to ensure that they stayed at the appropriate depth. The bags were incubated for 48 h. Three initial whole-water samples were taken for enumeration of bacteria and heterotrophic nanoflagellates (HNF) (50 ml fixed in 2% formaldehyde final concentration) and ciliates (95 ml fixed in 5 ml Bouin’s fixative). Zooplankton (3.5 l, triplicate samples) were collected on 22.4 µm mesh and fixed with sucrose formaldehyde to a final concentration of 4%. Triplicate samples (500 ml each) for nutrient analyses were taken from the whole water, the filtered water (< 0.2 µm) and the whole water plus nutrient additions. For bacteria and HNF enumeration, 1 ml subsamples were filtered onto 0.2 µm pore-size black polycarbonate membranes, stained with DAPI, and counted with an epifluorescence microscope (Porter & Feig 1980). Bacteria and HNF samples were filtered within 2 wk after fixation and immediately frozen (–18°C). Ciliates were counted according to Utermöhl (1958). Groups were identified using the Skibbe (1994) modification of the Montagnes & Lynn (1987) quantitative protargol stain. Zooplankton were counted under a stereomicroscope at ×40 magnification. At the end of the experiment, the bags were collected in the order in which they were set out. The bags were drained into a pail, and whole-water samples were taken in the same manner as for the initial samples. The remaining water was filtered through a 22.4 µm-mesh net for zooplankton analysis. SRP, ammonium and nitrate were measured in subsamples filtered through 0.6 µm membrane filters following the ‘Deutsche Einheitsverfahren’ (DEV 1982-1996) (DIN 38405-D11, DIN 38406-E5 and DIN 38405-D19). For total phosphorus (TP) determinations, unfiltered water samples were disintegrated with H2O2 and H2SO4 at 150°C for 10 h (DIN 38405-D11). Total nitro-
85
gen (TN) concentrations were analyzed by chemiluminescence (TN-Analyzer Abimed TN-05) following DIN 38 409-H27. Statistical analysis. The final abundances of the zooplankton predator groups (nauplii, rotifers and crustaceans) were analyzed by 3-way factorial ANOVAs, with dilution as a discrete factor. The growth rates of the prey groups (bacteria, HNF and ciliates) were analyzed using the Gallegos (1989) variation of the Landry & Hassett (1982) dilution methodology. The Landry & Hassett methodology is based on the assumption that in more dilute samples the encounter rate between predator and prey will be reduced without changing the growth rate of the prey. Thus, the apparent growth rate of the prey (i.e. growth minus grazing loss) will depend on the degree of dilution. The apparent growth rate of the prey over a range of dilutions can then be regressed against the dilution fraction. The slope of the regression is the grazing rate of the predators, and the intercept (at a theoretical 0% unfiltered water) is the growth of the prey in the absence of grazing. The Gallegos variation of this methodology recognizes that there will be a linear relationship between the dilution fraction and apparent prey growth rate only at prey densities beneath the maximal ingestion rate (the incipient limiting level, or ILL) of the predator. Above the ILL, the ingestion rate will be constant, and the regression of apparent growth rate against dilution fraction should produce a flat line. An assumption of the Landry-Hassett methodology is that at the various dilutions, prey growth rate is constant, and only the predation rate varies. This assumption is usually met by adding nutrients to all experimental containers. We tested whether nutrients were limiting in any of the dilutions by adding nutrients to half of the experimental bags. Growth rates in groups with and without a nutrient addition were tested with an ANOVA. Before statistical analysis, initial and final abundances were converted to growth rates, using the equation
µj =
N fj ln Ni ⋅ Dj
(1)
time
where µ j is the growth rate at dilution fraction j, Nfj is the final abundance in dilution j, N i is the abundance in undiluted initial samples, Dj is the dilution fraction (the proportion of undiluted water used), and time is the time elapsed in days. The statistical analysis of the data comprised 3 parts and was carried out in a hierarchical fashion. The dependent variables were initially analyzed in a 3-way factorial ANOVA, with mesozooplankton presence/ absence, additional nutrient presence/absence, and dilution percentage as factors. This was done before any regression analysis in order to clarify the basic
86
Aquat Microb Ecol 24: 83–97, 2001
questions of whether there were differTable 1. Initial nutrient concentrations (µg l–1) in the epilimnion (2 m water depth) and deep chlorophyll maximum (DCM) (7.3 m water depth) experiments. Data ences in growth rates at different diluare mean (± SD) concentrations for 2 (epilimnion) and 3 (DCM) replicates. Lake: tions, whether growth rates differed concentrations in the lake at the end of the experiments, represented by single due to the presence or absence of samples. TN: total nitrogen; TP: total phosphorus; SRP: soluble reactive phosphorus either mesozooplankton or nutrients, and whether one effect was dependent Experiment TN NH4+ NO3– TP SRP on another. Dilution percentage was included as a discrete, rather than conEpilimnion Filtered water (< 0.2 µm) 830 ± 28 50 ± 0 10 ± 0 15 ± 1 6±1 tinuous variable, in order to make the Whole water 935 ± 60 55 ± 7 40 ± 40 17 ± 4 6±4 initial analysis independent of any Whole water plus nutrients 1610 ± 140 60 ± 0 575 ± 7 57 ± 4 27 ± 4 assumptions of the form of the relationLake (15 Aug 1996) 710 40 20 18 32 ship between growth rates and the DCM amount of dilution. The data were then Filtered water (< 0.2 µm) 770 ± 30 40 ± 0 ILL
(2b)
where µmax = the intercept and the maximal growth rate in the absence of grazing; g = the slope of the line and the grazing rate; D = the dilution fraction and ILL = the incipient limiting level. The maximum grazing rate was calculated as the slope of the regression line (the grazing rate) times the ILL, when the latter was present. Above the ILL, the grazing rate does not increase; therefore the slope of the regression alone overstates the actual grazing impact on the prey. When no ILL is present, the maximum grazing rate is g, the slope of the regression.
RESULTS Experimental conditions
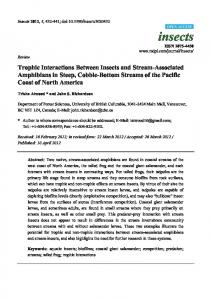
Fig. 1. In situ profiles of water temperature, oxygen saturation and chlorophyll a in Großer Vätersee (19 August 1996). These profiles were consistent throughout August
During the experimental period (12 to 20 August 1996), the lake was thermally stratified (Fig. 1). The thermocline lay between 5 and 7 m water depth. A pronounced deep chlorophyll maximum developed between 7 and 8 m water depth in the microaerobic zone
Adrian et al.: Trophic interactions between zooplankton and microbial community
Table 2. Initial prey concentrations (cells ml–1) in epilimnion (12 August 1996) and DCM (19 August 1996) in Großer Vätersee. Chlorophyll a was not determined for DCM Prey
Epilimnion
DCM
Bacteria HNF Chlorophyll a Ciliates
4.2 × 10⁶ 402 3.65 (µg l–1) 6.2
4.8 × 10⁶ 1314 2.9
(the water layer in which oxygen was beneath detection limits but H2S had not yet developed: Kasprzak et al. 2000). Nutrient additions enhanced the initial soluble nitrogen (NO3 plus NH4) by 570 and 440%, and SRP by 350 and 100% in the epilimnion and DCM, respectively (Table 1). In the plus-nutrient treatments at the end of the experiments, SRP had declined by 46% in the epilimnion and by 11% in the DCM. In contrast, soluble N (NO3 + NH4) concentrations in the experimental bags increased by 45% in the epilimnion and 27% in the DCM. There was no significant difference in the final soluble nutrient concentrations attributable to either the dilutions or zooplankton presence/absence in the plus-nutrients treatments (p > 0.05). For all dilutions, final soluble nutrient concentrations in the plus-nutrient treatments were at least twice the initial in situ concentrations. Initial bacterial densities were similar in the epilimnion and the DCM, whereas HNF were 3 times higher in the DCM than in the epilimnion (Table 2). In the epilimnion, the phytoplankton was dominated by cyanobacterial autotrophic picoplankton (APP) and Ceratium spp. Initial epilimnetic chlorophyll a concentrations did not differ significantly (p > 0.05) between the whole-water and the minus-zooplankton fraction (< 63 µm) (Table 3). In the DCM, the phytoplankton was dominated by the filamentous cyanobacteria Planktothrix sp. With a mean filament length of 155 ±
87
74 µm (June–September 1997, U. Siedel pers. comm.), Planktothrix sp. may be non-edible for most zooplankton. A total of 21 ciliate species was present in the initial epilimnetic samples, with a total initial abundance of 6.2 cells ml–1 (Table 2). The species were grouped into oligotrich ciliates (Pelagiohalteria cirrifera and 5 species of the genus Strobilidium and Strombidium with an initial abundance of 2.7 cells ml–1 and 2 species of the genus Codonella [tintinnid ciliates] with an initial abundance of 1.4 cells ml–1) and prostomid ciliates (Urotricha sp. with an initial abundance of 0.75 cells ml–1). The ciliate community in the DCM comprised 17 species with an initial total abundance of 2.9 cells ml–1 (Table 2). The species were grouped into prostomes (Prorodon sp. and Urotricha sp., initial abundance 0.37 cells ml–1) and oligotrichs (Strobilidium sp. Strombidium sp. and Pelagiohalteria cirrifera, initial abundance 1.5 cells ml–1). The main differences between the ciliate community in the DCM and that in the epilimnion were the greater importance of the small prostomes and the lesser importance of Codonella spp. in the DCM. Keratella cochlearis was the dominant rotifer species in both the epilimnion and the DCM (69 and 80% total rotifer abundance, respectively) experiments. However, total rotifer abundance was more than twice as high in the initial DCM samples than in the initial epilimnion samples (Table 3). Total rotifer abundance increased significantly with increasing percentage of unfiltered water (Table 4, Fig. 2). In the DCM, rotifer density did not differ significantly between the plusminus-zooplankton treatments (Table 3) while a reduction was found in the epilimnion in the minus-zooplankton treatments (Table 3). The crustacean zooplankton was comprised of daphnids (Daphnia cucullata), bosminids (Bosmina longirostris, B. coregoni), calanoid copepods (Eudiaptomus graciloides) and cyclopoid copepods (Thermocyclops oithonoides, Diacyclops bicuspidatus, Mesocyclops
Table 3. Initial abundances (ind. l–1) of different zooplankton groups in epilimnion (12 to 15 August 1996) and DCM (19 to 22 August 1996) experiments. Data are mean (± SD) abundances of 3 replicates. Lake: abundances in the lake at the end of the experiments, represented by single samples. Chl a: chlorophyll a Experiment Epilimnion Filtered water (< 63 µm) Whole water Lake (15 Aug 1996) DCM Filtered water (< 63 µm) Whole water Lake (22 Aug 1996)
Chl a
Rotifers
Nauplii
Daphnia cucullata Bosmina spp.
3.58 ± 0.04 3.65 ± 0.8 5.24
6±4 127 ± 80 133
43 ± 17.87 13.71 ± 3.99 29.71
0±0 31 ± 22 22
0.29 ± 0.70 13 ± 11 35
165 ± 56 275 ± 23 470
2.14 ± 1.89 17.14 ± 14.1 8.57
0.95 ± 1.65 18.6 ± 8.9 14.29
0.71 ± 0.71 4.29 ± 1.43 1.43
Calanoids
Cyclopoids
0±0 13 ± 4 39
0.29 ± 0.70 24 ± 14 16
0.71 ± 1.24 0.48 ± 0.82 17.14 ± 7.56 33.8 ± 19.4 11.43 34.29
88
Aquat Microb Ecol 24: 83–97, 2001
leuckarti). Unlike rotifer abundances, crustacean zooplankton abundance was much higher in the epilimnion than in the DCM (Table 3, Fig. 2). Moreover, while cyclopoid copepods dominated in the DCM, cladocerans were most abundant in the epilimnion (Table 3). The crustacean zooplankton (excluding nauplii) were largely absent in the minus-zooplankton
treatments (Fig. 2, Table 3). The total number of nauplii and crustaceans increased significantly with increasing percentage of unfiltered water in the epilimnion and in the DCM (Table 4, Fig. 2). Nutrient additions had no effect on the abundance of zooplankton predators such as nauplii, rotifers and crustacean zooplankton (Table 4).
Fig. 2. Abundance of total rotifers, nauplii and crustacean zooplankton (cladocerans and copepods) at the end of the incubation period in the different dilution series in the epilimnion (12 to 15 August 1996) and the DCM (19 to 22 August 1996). For details of species composition see ‘Results’. +nut, + 700: nutrient or zooplankton additions; –nut, –700: no nutrient or zooplankton additions
89
Adrian et al.: Trophic interactions between zooplankton and microbial community
Table 4. Epilimnion: p-values of ANOVAs for growth rates of the main prey groups and abundance of the main metazooplankton predators. HNF: heterotrophic nanoflagellates; Chl a: chlorophyll a. Dilution is included as a discrete rather than continuous variable in order to test the effect of the dilution series and its interaction with the zooplankton and nutrient treatments without any assumptions as to the form of the relationship between growth rates and dilution series. Rotifer data are the total rotifer abundance; crustacean data comprise total crustacean zooplankton (calanoid and cyclopoid copepods [adults and copepodites] and cladocerans) Variable
Bacteria
Chl a
HNF
Ciliates Oligotrichs Prostomes
Total Dilution (D) < 0.0001 Nutrients (N) 0.185 D×N 0.481 Zooplankton (Z) 0.131 D×Z 0.293 N×Z 0.993 N×D×Z 0.821 Model R2
Nauplii
Zooplankton Rotifers Crustaceans
< 0.0001 0.126 0.961 0.0025 0.059 0.934 0.900
< 0.0001 0.0011 0.153 0.113 0.640 0.737 0.708
< 0.0001 0.003 0.392 < 0.0001 0.017 0.319 0.418
0.018 0.001 0.476 < 0.0001 0.018 0.019 0.902
< 0.0001 0.091 0.368 < 0.0001 0.008 0.113 0.059
< 0.0001 0.470 0.862 0.0001 0.469 0.185 0.420
< 0.0001 0.957 0.458 0.035 0.497 0.562 0.371
< 0.0001 0.764 0.102 < 0.0001 < 0.0001 0.754 0.050
0.87
0.86
0.95
0.89
0.95
0.85
0.82
0.94
0.98
Epilimnion experiment
Heterotrophic nanoflagellates
Bacteria
HNF were affected by both dilution and the presence or absence of mesozooplankton (Table 4). Polynomial regression indicated non-linearity in the minusmesozooplankton data, and an ILL was found at 35% unfiltered water, giving a maximum grazing rate of 0.60 d–1 (Table 6, Fig. 3). In plus-mesozooplankton treatments, HNF growth rates declined linearly with increasing proportion of unfiltered water, and the grazing rate was 0.75 d–1 (Table 6, Fig. 3). The addition of nutrients had no effect on HNF growth rates. Growth rates without predators (the intercept of the growth rate-dilution regression) were quite high in both the plus-minus-mesozooplankton treatments (1.93 and 2.16 d–1, respectively), and were not less than 1.25 d–1 in the dilutions with the highest predator densities (Table 6, Fig. 3). Despite the presence of an ILL in the minus-mesozooplankton treatments, the difference in maximum grazing rates on HNF in the plus- and
In the epilimnion, only the dilution series had strong effects on bacterial growth rates. The initial ANOVA revealed that dilution had a significant effect on bacterial growth rates (p < 0.0001; Table 4), but neither nutrient additions nor mesozooplankton removal affected bacterial growth rate (p > 0.13; Table 4). Given the relatively high nutrient status of the lake (Table 1), a strong bottom-up effect on bacterial production is unlikely. A polynomial regression indicated that the bacterial growth rate-dilution relationship was nonlinear, and a piece-wise regression was then fit to the data. This produced a curve with an ILL at 58% unfiltered water and a maximal bacterial growth rate of 1.23 d–1. The grazing rate up to the ILL at 58% unfiltered water was 1.79 d–1, giving a maximum grazing rate at the ILL of 1.04 d–1 (Table 6, Fig. 3).
Table 5. Deep chlorophyll maximum (DCM): p-values of ANOVAs for growth rates of main prey groups and abundance of the main metazooplankton predators. Further details as in Table 4 legend Variable
Dilution (D) Nutrients (N) D×N Zooplankton (Z) D×Z N×Z N×D×Z Model R2
Bacteria
< 0.0001 0.813 0.851 0.252 0.428 0.158 0.858 0.95
HNF
0.0005 0.284 0.235 0.650 0.531 0.013 0.540 0.73
Total
Ciliates Oligotrichs
Prostomes
Nauplii
Zooplankton Rotifers Crustaceans
< 0.0001 0.449 0.208 < 0.0001 0.468 0.309 0.733
0.005 0.224 0.030 < 0.0001 0.011 0.036 0.221
< 0.0001 0.952 0.419 < 0.0001 0.253 0.820 0.581
0.0005 0.057 0.119 < 0.0001 0.0015 0.130 0.110
< 0.0001 0.884 0.921 0.322 0.949 0.601 0.850
0.0007 0.232 0.392 < 0.0001 0.0018 0.516 0.260
0.91
0.85
0.91
0.87
0.88
0.87
90
Aquat Microb Ecol 24: 83–97, 2001
polynomial regressions of total oligotrich growth rates against dilution (dilution2 effect, p > 0.05; Fig. 4). As a result, an ANCOVA model was fitted to the data with dilution as a continuous factor, and nutrients and mesozooplankton as discrete factors. The interactions between nutrients and dilution and between mesozooplankton and dilution were included to test whether either nutrient addition or mesozooplankton removal influenced the slope of the regression (i.e. the grazing rate). The main effects of nutrients and mesozooplankton tested whether these factors affected the intercept of the regression (i.e. the growth in the absence of grazers). The results of the ANCOVA indicated that there was a significant grazing effect on oligotrichs, but that the grazing rate was strongly influenced by the presence or absence of mesozooplankton (p = 0.0002 for both dilution effect and dilution × mesozooplankton interaction: Fig. 4). In the absence of mesozooplankton, there Fig. 3. Net growth rates of bacteria and heterotrophic nanoflagellates (HNF) as was no grazing on oligotrichs, but a function of the dilution fraction in experiments with and without nutrient addigrazing pressure was high in the tions and with and without removal of the mesozooplankton in the epilimnion presence of mesozooplankton. The and the DCM. Absence of dashed lines (regressions of no-additional nutrient treatments) and thin lines (minus-mesozooplankton treatments) indicate no sigaddition of nutrients increased olignificant effects for these treatments: data were pooled for the regressions. Lines otrich growth rates in the absence of are shown for significant fits of the dilution model only grazing by 0.16 d–1, and this was independent of the grazer density minus-mesozooplankton treatments was only 0.16 d–1. (nutrient effect: p = 0.035; nutrient × dilution interacFor HNF and ciliates, being at an intermediate level of tion: p = 0.94). The growth rate of the prostomes (small the food web, the assumption of the Landry-Hassett Urotricha sp.) was affected by only the dilution series dilution technique (no resource limitation for prey at and by mesozooplankton, with an interaction between all dilutions) is not fully met, since they are likely to the 2 factors (Table 4). Polynomial regression on the have lower encounter rates with their prey at low prodata indicated non-linearity in the plus-mesozooplankportions of undiluted water (see ‘Discussion’). ton (ILL at 53% unfiltered water), but not in the minusmesozooplankton data. Microzooplankton (here defined as nauplii and rotifers) reduced the growth rate Ciliates of prostomes by 0.65 d–1. Mesozooplankton such as daphnids and copepods reduced the growth rate to a Total ciliate growth rates, and in particular the greater extent (1.61 d–1), attaining maximal ingestion growth rates of oligotrichs, the dominant ciliate group rate at 53% unfiltered water (Table 6). in the epilimnion, were significantly enhanced by the removal of mesozooplankton and the addition of nutrients, as well as by the dilution series (Table 4). As a Deep chlorophyll maximum result, the regression analysis was conducted separately for the 4 zooplankton and nutrient presence/ Bacteria absence treatment combinations. With or without the In the DCM, bacterial growth rates responded to the addition of nutrients, both the plus- and minus-mesozooplankton groups showed no non-linearities in the experimental manipulations in a fashion very similar to
Adrian et al.: Trophic interactions between zooplankton and microbial community
91
Heterotrophic nanoflagellates HNF growth rates in the DCM were approximately half those in the epilimnion, and were affected by dilution and by an interaction between nutrient additions and the presence of mesozooplankton (Fig. 3, Table 5). When mesozooplankton were present, the addition of nutrients slightly enhanced HNF growth rates, but when mesozooplankton were absent, nutrient addition had the opposite effect (Table 6, Fig. 3). Grazing rates on HNF were the same in all treatments, independent of the presence or absence of the mesozooplankton (Table 6).
Ciliates Total ciliate growth rates were significantly enhanced by the dilution series and by the removal of the mesozooplankton (Table 5, Fig. 4). The ciliate growth rate-dilution relationship was non-linear, with an ILL at 42% (mesozooplankton present) and 33% (mesozooplankton absent) unfiltered water (Table 6). Reflecting the lower crustacean, and higher rotifer abundance in the DCM compared to the epilimnion, the maximum grazing rate was lower in the DCM than in the epilimnion with mesozooplankton present, but higher with mesozooplankton absent. Unlike the epilimnion experiment, the addition of inorganic nutrients did not result in higher ciliate growth rates. Prostome and oligotrich growth rates were significantly enhanced by the removal of zooplankton. However, while the prostome growth rates-dilution relationship showed nonFig. 4. Net growth rates of total ciliates (A,D), prostome ciliates (B,E), and oligolinearity with an ILL at 46 and 59% trich ciliates (C,F) as a function of the dilution fraction in experiments with and unfiltered water (mesozooplankton prewithout nutrient additions and with and without removal of the mesozooplankton in the epilimnion and DCM. Further details as in Fig. 3 legend sent and absent, respectively), there was no ILL evident in the oligotrich growth data, either with or without mesozooplankton (Table 6, Fig. 4). In the absence of those in the epilimnion. Only the dilution series prozooplankton, there was no grazing on oligotrichs, but, duced significant differences in bacterial growth rates as observed in the epilimnion, strong grazing pressure (Table 5). Polynomial regression showed non-linearity occurred in the presence of zooplankton (Table 6, in the data, and a 2-piece regression with an ILL at 71% Fig. 4). Maximal prostome growth rates were higher in unfiltered water was fit to the data (Table 6). The bactethe dilution series without mesozooplankton (1.26 d–1) rial growth rate in the absence of grazing was 1.28 d–1.
92
Aquat Microb Ecol 24: 83–97, 2001
than in the dilution series with mesozooplankton (0.98 d–1) (Table 6, Fig. 4).
DISCUSSION An assumption of the Landry-Hassett dilution technique is that in all dilutions, resources are not limiting for the prey species. We attempted to meet this assumption by adding inorganic nutrients, which would directly benefit only the phytoplankton and, to a certain extent, bacteria. Bacteria growth rates were high and identical with or without added nutrients (Fig. 3), making reasonable the assumption that they were not under nutrient limitation. HNF and ciliates, however, were at an intermediate level of the food web, being neither the top predators nor benefiting directly from the additional inorganic nutrients. It is therefore likely that the assumptions of the Landry-Hassett methodology were not fully met in these instances. At lower proportions of undiluted water, HNF and ciliates would be not only under lower predation pressure, but have lower encounter rates with their bacterial and algal prey. Bacteria growth rates were positive at all dilutions, and the highest dilutions were sufficiently high to make it probable that the HNF were at most weakly resource-limited (Fig. 3). Adding inorganic nutrients in the epilimnion also significantly increased ciliate growth rates, most likely as an indirect response to phytoplankton growth. As a result, resource-limitation for ciliates, at least when nutrients were added, was also likely to be slight. Nevertheless, if at higher dilutions, HNF and ciliate net growth rates were reduced by reduced encounter rates with their prey, then the slope and intercept of the regression line (the grazing rate and growth in the absence of grazing) are likely to have been underestimated.
Predation on bacteria The experiments showed strong direct top-down effects extending as far as protists, and weak bottomup effects. The weak bottom-up effects may be related to the relatively high nutrient level in the lake (Table 1), consistent with studies which have shown that bacterial growth may be stimulated by an increase in nutrient supplies (e.g. Gurung & Urabe 1999). In both the epilimnion and the DCM there appeared to be a clear uncoupling of the bacteria from the classic food web. Bacteria were clearly under strong predation pressure, with net growth rates being reduced to almost zero at the highest predator densities. However, neither addition of nutrients nor removal of mesozooplankton changed either bacterial growth rates or
grazing losses, which confirms the results of numerous studies with crustacean zooplankton (Pace & Funke 1991, Wickham & Gilbert 1991, Pace 1993, Pace & Vaqué 1994, Wickham 1995a, 1998, Adrian & Schneider-Olt 1999) and rotifers (Sanders et al. 1989, Pace et al. 1990). In our study, the most likely explanation for the lack of a bacterial response is that the HNF, normally the main predators on bacteria, were only moderately affected by the experimental manipulations. However, there were large differences between the epilimnion and DCM in initial HNF abundance, as well as in temperature, chlorophyll a and zooplankton, which may have contributed to the overall similarity in the response on the bacterial level in both the epilimnion and the DCM (Figs. 1 & 2). Although HNF in the epilimnion had lower initial abundance than in the DCM, they had a higher growth rate (Table 6), possibly due to the 9°C warmer temperature in the epilimnion. When the geometric mean abundance of HNF and bacteria are plotted (a measure of HNF and bacteria abundance in the middle of the experiment), a remarkably similar picture emerges (Fig. 5). The bacteria: HNF ratio was different between dilutions, but between experiments, it was the same at any given dilution. The dilution series had a greater effect on bacterial growth rates than HNF growth rates, resulting in more HNF per bacteria at lower dilutions (Fig. 5). Sanders et al. (1992) proposed that the commonly observed bacteria:HNF ratio of close to 1000:1 would only be found when bacterial growth and grazing losses were in equilibrium. In both the epilimnion and DCM, net bacterial growth rates were always positive, but were closest to zero in the undiluted samples, where the bacteria:HNF ratio was also closest to the equilibrium ratio proposed by Sanders et al. As treatments became more dilute, net bacterial growth rates became more strongly positive and the bacteria:HNF ratio dropped further beneath the equilibrium ratio, with the slopes of the bacteria-HNF regressions significantly less than that of the equilibrium slope of Sanders et al. (α = 0.05; Figs. 3 & 5). The low numbers of fast-growing HNF in the epilimnion and the higher numbers of slower growing HNF in the DCM produced the same grazing pressure on bacteria, in accordance with the model proposed by Sanders et al.
Predation on HNF Unlike the bacteria, the HNF did respond to the removal of mesozooplankton. It was unforeseen that the high Daphnia cucullata abundance in the epilimnion (initial abundance, 31 D. cucullata l–1) would reduce HNF growth rates by only 40%, with rates remaining well above zero at all predator concentra-
Fig. 5. Geometric mean of log(HNF ml–1) plotted against geometric mean of log(bacteria ml–1) in the epilimnion and DCM experiments (all treatments combined). Geometric means give an estimate of abundance at the mid-point of the experiments. Circles represent dilutions, with the largest circles being the undiluted treatments and the smallest circles the 10% unfiltered water treatment. Line in each graph is the Sanders et al. (1992) line for the HNF-bacteria relationship in 600 marine and freshwater planktonic communities; equation of the line: log (HNF abundance) = 0.90 × log(bacteria abundance) – 2.4
Adrian et al.: Trophic interactions between zooplankton and microbial community
93
tions and with only small differences between rates with and without mesozooplankton (Fig. 3). However, ciliates, particularly the small oligotrichs abundant in the epilimnion, are known to have high grazing rates on HNF (Jürgens et al. 1996), and mesozooplankton reduced ciliate growth rates to strongly negative values. Increasing the proportion of unfiltered water therefore had both the direct effect of increasing the D. cucullata grazing rate on HNF, but also the indirect effect of decreasing the ciliate grazing rate on HNF as the ciliates themselves were preyed upon. In the DCM, however, HNF growth rates were lower, despite less efficient predation pressure by copepods and Keratella cochlearis as compared to the daphnids dominant in the epilimnion. The water temperature in the DCM was 9°C lower than in the epilimnion, which could be expected to result in the observed overall lower HNF growth rates here compared to the epilimnion. Jürgens et al. (1996) and Adrian & Schneider-Olt (1999) found cyclopoid copepods, the dominant mesozooplankters in the DCM, to be inefficient grazers on HNF. This explains the lack of an ILL or large differences in HNF growth rates in the plus- and minus-zooplankton treatments. While it might be expected that the high rotifer abundance in the DCM would strongly influence community grazing rates on HNF, the dominant rotifer species was K. cochlearis, which in comparison to the ciliates present has a relatively low grazing rate on HNF (Sanders & Wickham 1993, Cleven 1996, Jürgens et al. 1996). Assuming a K. cochlearis ingestion rate of 50 HNF K. cochlearis–1 h–1 (Sanders & Wickham 1993, Jürgens et al. 1996) and a ciliate ingestion rate of 10 HNF ciliate–1 h–1 (Cleven 1996, Jürgens et al. 1996), then at the beginning of the experiment the community ciliate grazing rate on HNF was twice the rate of K. cochlearis grazing on HNF.
Predation on ciliates by mesoversus microzooplankton The study confirms the importance of topdown effects by the crustacean zooplankton in structuring ciliate communities. Cladocerans and copepods, the main predators in the epilimnion and the DCM, are known to negatively
94
Aquat Microb Ecol 24: 83–97, 2001
affect ciliate growth rates (Wickham & Gilbert 1991, Pace & Vaqué 1994, Wiackowski et al. 1994, Adrian & Schneider-Olt 1999). The mesozooplankton were obviously more effective grazers on ciliates than the microzooplankton. In the cladoceran-dominated epilimnion, the mesozooplankton were able to drive ciliate growth rates negative (< –0.4 d–1), with large differences between plus- and minus-mesozooplankton treatments (Fig. 4). In the rotifer dominated DCM, the minimum ciliate growth rates were always positive (≥ 0.13 d–1), and there was a smaller difference between plus- and minus-mesozooplankton treatments. There is relatively little information on the grazing impact of rotifers on ciliates in general (Sanders & Wickham 1993). However, Bogdan & Gilbert (1982) found that Keratella cochlearis (the dominant rotifer in our experiments) had low grazing rates on algae in the 20 to 70 µm size range of the ciliates found in our experiments. It is also known that although the species of the rotifer predator and ciliate prey play a large role in determining the grazing rate, ingestion rates are in the range of 0.1 to 5 ciliates rotifer–1 h–1 (Gilbert & Jack 1993, Sanders & Wickham 1993, Mohr & Adrian 2000). Species-specific ingestion rates for the crustacean zooplankton exceed those of rotifers by factor of up to 150 (Wickham 1995b, Adrian & Schneider-Olt 1999). Given these differences, the moderate impact of the microzooplankton on ciliates in our experiments was not unexpected, despite the high rotifer densities. Ciliate growth rates in the DCM in the absence of grazing were quite high (0.6 d–1; Fig. 4), given the low temperature (0.6 d–1, 8.9°C), indicating that ciliates in the DCM were not under strong bottom-up control. In contrast, in the epilimnion the addition of nutrients increased ciliate (particularly oligotrich) growth rates, indicating both bottom-up as well as top-down control of ciliate adundance. Because the main ciliate species found in the experiments were not mixotrophic, but were feeding on the algae, nutrient conditions could only affect ciliates through higher algal production. The generally higher growth rates of ciliates in the DCM despite low water temperature were consistent with the higher densities of resources (HNF, algae and the somewhat higher bacteria densities in the DCM) in conjunction with moderate predation pressure (by rotifers mainly). This expectation is consistent with higher (by an average factor of 7) ciliate abundance in the DCM compared to the epilimnion in the Großer Vätersee (Adrian unpubl. data). Moreover, the in situ ciliate dynamics in the DCM were very well matched by the dilution experiments. High ciliate growth rates and moderate predation pressure by rotifers (Table 6, Fig. 5) should result in an increase in ciliate abundance, a tendency we found in the lake 2 wk later (Adrian unpubl. data). High variation in ciliate abundances in the DCM
over time may be related to a changing grazing impact by migrating crustacean zooplankton from the epilimnion (Adrian unpubl. data). Besides differences in the extent of predatory effects, rotifers and the crustacean zooplankton differed in their impact on different ciliate groups. In both the epilimnion and the DCM, oligotrichs were largely resistant to predation by the microzooplankton, but not by the mesozooplankton. Many oligotrichs have a jumping response to a pressure wave (jumping is known for Halteria spp., the dominant species in the DCM); this has been shown to be an effective defence against predation from copepods and the predatory rotifer Asplanchna sp. (Jonsson & Tiselius 1990, Gilbert 1994). This response would appear to be an effective defence against both the Keratella cochlearis dominated DCM micrometazoan community and the nauplii-dominated epilimnion, but not against crustacean zooplankton. Small prostomes, however, were preyed upon by the micro- and mesozooplankton in both the epilimnion and the DCM. The ILL for prostomes (mostly Urotricha sp.) is, however, hard to explain. Since prostomes were present in rather low abundance (0.75 cells ml–1: epilimnion; 0.37 cells ml–1: DCM), lack a jumping response, and are edible in terms of prey size, the mesozooplankton should not show an ILL. It is possible that Urotricha sp. and other prostomes may have a chemical defense which makes them less susceptible to predation. Williamson (1980) noted that Mesocyclops edax could capture, but rarely ingested, the peritrich ciliate Epistylus sp., consistent with a chemical defence.
Conclusions Our study indicates that the control mechanisms underlying the dynamics of microbial communities in the microaerobic DCM differ from those in the epilimnion. This is clearly related to differences in predator and prey species. The study was characterized by strong responses of the ciliates to the experimental manipulations, weak responses by the HNF and, with the exception of the dilution series itself, no response by the bacteria. Moreover, there were considerable differences between the epilimnion and DCM in the growth rates and grazing losses of ciliates and HNF, but virtually no difference in the growth and grazing rates of bacteria. The strength of and differences in the ciliate responses can be attributed to their trophic closeness to the experimental manipulations. Removing mesozooplankton removed the main ciliate grazers, and this had a greater impact in the epilimnion than in the DCM due to the higher abundance of cladocerans and copepods in the epilimnion compared
95
Adrian et al.: Trophic interactions between zooplankton and microbial community
to the DCM. Added nutrients in the epilimnion, where ciliate growth rates were lower than in the DCM, were transferred immediately from the algae to the ciliates, indicating that in the epilimnion both bottom-up and top-down control are important factors in the ciliate community. HNF, however, were both directly impacted by the removal of mesozooplankton and indirectly by reduced grazing on the ciliates that could then graze the HNF. The bacteria were one step further removed from the manipulations, and the net effect was of no net change in bacterial growth and loss rates. Thus, while the impact of the different conditions in the epilimnion and DCM could be seen in the upper levels of the microbial food web, the lower levels
remained relatively immune. This implies that part of the McQueen et al. (1986) top-down bottom-up hypothesis for classic pelagic food webs, i.e. that top-down effects become diluted in lower trophic levels, also applies to microbial food webs. Whether the biomass accumulated in the DCM contributes to the food requirements of the migrating zooplankton from the epilimnion, where food availability is scarce, remains an interesting question for future research. Acknowledgements. We would like to thank Beate Schneider-Olt for assistance in the field and chlorophyll analysis and Ulrike Berninger for valuable comments on the manuscript.
Table 6. Linear and non-linear regressions of net growth rates against dilution fraction for epilimnion and DCM experiments. Data used: data groups, based on the outcome of the ANOVAs (Tables 4 & 5). Non-linearity: value of the quadratic term of a quadratic regression of growth rate against dilution, used as test of non-linear tendency in the data; when the quadratic term was significant at α = 0.05, then a 2-piece regression with an incipient limiting level (ILL) was fit to the data; when all the groups of data for a variable showed no non-linear tendency, then an ANCOVA was fit to the data to estimate grazing rate (g) and growth rate (µ) in the absence of grazing and to test whether these estimates were independent of the removal of mesozooplankton or the addition of nutrients. R2 is the proportion of variance explained by the model. Where a significant regression could not be fit to the data, estimates are not given. +N, +Z: nutrient or zooplankton additions; –N, –Z: no nutrient or zooplankton additions Variable
Epilimnion Bacteria
Data,used
µmax (d–1)
g (d–1)
ILL (proportion whole water)
R2
< 0.00010
1.230
1.790
0.581
0.94
+/–N, +Z +/–N, –Z
0.0660 0.0001
1.930 2.160
0.754 1.730
– 0.345
0.78 0.71
Total ciliates
+N, +Z +N, –Z –N, +Z –N, –Z
0.6400 0.8100 0.1200 0.1500
–0.0270 0.303 –0.1250 0.205
0.475 0.167 0.475 0.167
– – – –
0.89
Oligotrichs
+N, +Z +N, –Z –N, +Z –N, –Z
0.3400 0.8000 0.180v 0.670v
0.075 0.274 –0.0930 0.106
0.523 0.0004 0.523 0.0004
– – – –
0.85
+/–N, +Z +/–N, –Z
0.0150 0.7220
0.101 0.810
1.610 0.645
0.526 –
0.62 0.63
HNF
Prostome DCM Bacteria HNF
Total ciliates Oligotrichs
Prostomes
All,data
Non-linearity
All,data
< 0.00010
1.280
1.620
0.711
0.85
+N, +Z +N, –Z –N, +Z –N, –Z
0.6200 0.5920 0.1830 0.0580
0.983 0.681 0.809 0.995
0.862 0.666 0.806 0.610
– – – –
0.48
+/–N, +Z +/–N, –Z
0.0060 0.0090
0.553 0.728
0.991 1.020
0.423 0.327
0.75 0.73
+N, +Z +N, –Z –N, +Z –N, –Z
0.0840 0.3200 0.8300 0.8300
0.421 0.506 0.518 0.484
0.340 0.027 0.350 0.037
– – – –
0.67
+/–N, +Z +/–N, –Z
0.0006 0.0100
0.987 1.260
1.930 1.220
0.458 0.588
0.78 0.76
Aquat Microb Ecol 24: 83–97, 2001
96
LITERATURE CITED Adler M, Gervais F, Siedel U (2000) Phytoplankton species composition in the chemocline of mesotrophic lakes. Arch Hydrobiol Spec Issues (Adv Limnol) 55:513–530 Adrian R, Schneider-Olt B (1999) Top-down effects of the crustacean zooplankton on pelagic microorganisms in a mesotrophic lake. J Plankton Res 21:2175–2190 Bogdan KG, Gilbert JJ (1982) Seasonal patterns of feeding by natural populations of Keratella, Polyartha and Bosmina: clearance rates, selectivities and contributions to community grazing. Limnol Oceanogr 27:918–934 Brett MT, Wiackowski K, Lubnow FS, Mueller-Solger A, Elser JJ, Goldman CR (1994) Species-dependent effects of zooplankton on planktonic ecosystem processes in Castle Lake, California. Ecology 75:2243–2254 Burns CW, Schallenberg M (1996) Relative impacts of copepods, cladocerans and nutrients on the microbial food web of a mesotrophic lake. J Plankton Res 18:683–714 Cleven EJ (1996) Indirectly fluorescently labelled flagellates (IFLF): a tool to estimate the predation on free-living heterotrophic flagellates. J Plankon Res 18:429–442 Cullen JJ (1982) The deep chlorophyll maximum: comparing vertical profiles of chlorophyll a. Can J Fish Aquat Sci 39: 791–803 DEV (1982–1996) Deutsche Einheitsverfahren zur Wasser-, Abwasser- und Schlammuntersuchung. Verlag Chemie, Weinheim Dobberfuhl DR, Miller R, Elser JJ (1997) Effects of a cyclopoid copepod (Diacyclops thomasi) on phytoplankton and the microbial food web. Aquat Microb Ecol 12:29–37 Dolan JR, Marrasé C (1995) Planktonic ciliate distribution relative to a deep chlorophyll maximum: Catalan Sea, N.W. Mediterranean, June 1993. Deep-Sea Res 42:1965–1987 Elser JJ, Frees DL (1995) Microconsumer grazing and sources of limiting nutrients for phytoplankton growth: application and complications of a nutrient- deletion/dilution-gradient technique. Limnol Oceanogr 40:1–16 Fee EJ (1976) The vertical and seasonal distribution of chlorophyll in lakes of the Experimental Lakes Area, northwestern Ontario: implications for primary production estimates. Limnol Oceanogr 21:767–783 Gallegos C (1989) Microzooplankton grazing on phytoplankton in the Rhode River, Maryland: non-linear feeding kinetics. Mar Ecol Prog Ser 57:23–33 Gasol JM, Guerrero R, Pedrós-Alió C (1992a) Spatial and temporal dynamics of a metalimnetic Cryptomonas peak. J Plankton Res 14:1565–1579 Gasol JM, Peters F, Guerrero R, Pedrós-Alió C (1992b) Community structure in Lake Cisó: biomass allocation to trophic groups and differing patterns of seasonal succession in the meta- and epilimnion. Arch Hydrobiol 123: 275–303 Gasol JM, Jürgens K, Massana R, Calderón-Paz JI, PedrósAlió C (1995) Mass development of Daphnia pulex in a sulfide-rich pond (Lake Cisó). Arch Hydrobiol 132: 279–296 Gilbert JJ (1994) Jumping behavior in the oligotrich ciliates Strobilidium velox and Halteria grandinella, and its significance as a defense against rotifer predators. Microb Ecol 27:189–200 Gilbert JJ, Jack JD (1993) Rotifers as predators on small ciliates. Hydrobiologia 255:247–253 Gurung TB, Urabe J (1999) Temporal and vertical difference in factors limiting growth rate of bacteria in Lake Biwa. Microb Ecol 38:136–145 Jonsson, PR Tiselius P (1990) Feeding behavior, prey detection and capture efficiency of the copepod Acartia tonsa
feeding on planktonic ciliates. Mar Ecol Prog Ser 60: 35–44. Jürgens K, Gasol JM, Massana R, Pedrós-Alió C (1994) Control of heterotrophic bacteria and protozoans by Daphnia pulex in the epilimnion of Lake Cisó. Arch Hydrobiol 131: 55–78 Jürgens K, Wickham SA, Rothhaupt KO, Santer B (1996) Feeding rates of macro- and microzooplankton on heterotrophic nanoflagellates. Limnol Oceanogr 41:1833–1839 Kasprzak P, Gervais F, Adrian R, Weiler W, Radke R, Jäger I, Steiner S, Siedel U, Schneider-Olt B, Böhme M, Eckmann R, Walz N (2000) Trophic status and pelagic food web structure of two mesotrophic lakes in Brandenburg (Germany). Int Rev Hydrobiol 85:167–189 Kettle WD, Moffett MF, deNoyelles F Jr (1987) Vertical distribution of zooplankton in an experimentally acidified lake containing a metalimnetic phytoplankton peak. Can J Fish Aquat Sci 44:91–95 Landry MR, Hassett RP (1982) Estimating the grazing impact of marine microzooplankton. Mar Biol 67:283–288 Lindholm T (1992) Ecological role of depth maxima of phytoplankton. Arch Hydrobiol Beih Ergeb Limnol 35:33–45 Lindholm T, Mörk AC (1990) Depth maxima of Mesodinium rubrum (Lohmann) Hamburger & Buddenbrock — examples from a stratified Baltic Sea inlet. Sarsia 75:53–64 McQueen DJ, Post JR, Mills EL (1986) Trophic relationships in freshwater pelagic ecosystems. Can J Fish Aquat Sci 43: 1571–1581 Merrell JR, Stoecker DK (1998) Differential grazing on protozoan microplankton by developmental stages of the calanoid copepod Eurytemora affinis Poppe. J Plankton Res 20:289–304 Mohr S, Adrian R (2000) Functional responses of the rotifers Brachionus calyciflorus and Brachionus rubens feeding on armoured and unarmoured ciliates. Limnol Oceanogr 45: 1175–1179 Montagnes DJS, Lynn DH (1987) A quantitative protargol stain (OPS) for ciliates: method description and test of its quantitative nature. Mar Microb Food Webs 2:83–93 Pace ML (1993) Heterotrophic microbial processes. In: Carpenter SR, Kitchell JF (eds) The trophic cascade in lake ecosystems. Cambridge University Press, Cambridge, p 252–277 Pace ML, Funke E (1991) Regulation of planktonic microbial communities by nutrients and herbivores. Ecology 72: 904–914 Pace ML, Vaqué D (1994) The importance of Daphnia in determining mortality rates of protozoans and rotifers in lakes. Limnol Oceanogr 39: 985–996 Pace ML, McManus GB , Findley SEG (1990) Planktonic community structure determines the fate of bacterial production in a temperate lake. Limnol Oceanogr 35:795–808 Pedrós-Alió C, Gasol JM, Guerrero R (1987) On the ecology of a Cryptomonas phaseolus population forming a metalimnetic bloom in Lake Cisó, Spain: annual distribution and loss factors. Limnol Oceanogr 32:285–298 Pedrós-Alió C, Massana R, Latasa M, García-Cantizano J, Gasol JM (1995) Predation by ciliates on a metalimnetic Cryptomonas population: feeding rates, impact and effects of vertical migration. J Plankton Res 17:2131–2154 Porter KG, Feig YS (1980) The use of DAPI for identifying and counting aquatic microflora. Limnol Oceanogr 25:943–948 Sanders RW, Wickham SA (1993) Planktonic protozoa and metazoa: predation, food quality and population control. Mar Microb Food Webs 7:197–223 Sanders RW, Porter KG, Bennet SJ, DeBiase AE (1989) Seasonal pattern of bacterivory by flagellates, ciliates, rotifers,
Adrian et al.: Trophic interactions between zooplankton and microbial community
97
and cladocerans in a freshwater planktonic community. Limnol Oceanogr 34:673–687 Sanders RW, Caron DA, Berninger UG (1992) Relationship between bacteria and heterotrophic nanoplankton in marine and fresh waters: an inter-ecosystem comparison. Mar Ecol Prog Ser 86:1–14 Sanders RW, Leeper DA, King CH, Porter KG (1994) Grazing by rotifers and crustacean zooplankton on nanoplanktonic protists. Hydrobiologia 288:167–181 Skibbe O (1994) An improved quantitative protargol stain for ciliates and other planktonic protists. Arch Hydrobiol 130: 339–347 Utermöhl H (1958) Zur Vervollkommnung der quantitativen Phytoplankton-Methodik. Mitt Int Ver Theor Angew Limnol 9:1–38 Vanni MJ, Findlay DL (1990) Trophic cascades and phytoplankton community structure. Ecology 71:921–937 Wiackowski K, Brett MT, Goldman CR (1994) Differential
effects of zooplankton species on ciliate community structure. Limnol Oceanogr 39:486–492 Wickham SA (1995a) Trophic relations between cyclopoid copepods and ciliated protists: complex interactions link the microbial and classic food webs. Limnol Oceanogr 40: 1173–1181 Wickham SA (1995b) Cyclops predation on ciliates: speciesspecific differences and functional response. J Plankton Res 17:1633–1646 Wickham SA (1998) The direct and indirect impact of Daphnia and Cyclops on a freshwater microbial food web. J Plankton Res 20:739–755 Wickham SA, Gilbert JJ (1991) Relative vulnerabilities of natural rotifer and ciliate communities to cladocerans: laboratory and field experiments. Freshw Biol 26:77–86 Williamson CE (1980) The predatory behavior of Mesocyclops edax. Predator preferences, prey defences, and starvation induced changes. Limnol Oceanogr 25:903–909
Editorial responsibility: Robert Sanders, Philadelphia, Pennsylvania, USA
Submitted: August 14, 2000; Accepted: January 23, 2001 Proofs received from author(s): March 22, 2001