Figure 5.2 Screenshot of the environments used: desktop VR on the left and HMD on the ...... was a Lenovo desktop computer with dedicated graphic memory.
Trust in Virtual Reality DAVIDE SALANITRI
Thesis submitted to the University of Nottingham for the degree of Doctor of Philosophy
2017/2018
i
ii
Abstract The current era has seen unrestrained technological progress. New technologies are replacing common work practices and processes in several fields, such as industry, healthcare, and commerce. The main reasons for using these technologies is the reduction of time to develop products, increased quality of products and processes, and increases in security and communication. This thesis focuses on Virtual Reality (VR). VR is currently replacing old systems and modifying practices and processes in fields such as automotive, healthcare, training and psychological therapies. However, when applying technologies, it is fundamental to study the interaction between the technology and the end users. This thesis takes into consideration one aspect of human-computer interaction: trust. Trust has been seen as fundamental in technologies such as e-commerce, e-marketing, autonomous systems and social networks. This is because trust has been found to be associated with the intention to use a technology, and lack of trust could deter users from adopting the technology. This concept is particularly important for VR, since it is only recently gaining widespread adoption. However, studies on users’ trust in VR systems are limited in the literature and there is uncertainty regarding the factors which could influence end user trust. This research aimed at developing a model to investigate trust in VR. The goal was to identify the factors which have a theoretical influence on trust in VR through an analysis of the literature on trust in VR and trust in technology in general. This permitted the creation of a framework with usability, technology acceptance and presence as possible predictors of trust in VR. In order to validate this framework, six user experiments were conducted. The experiments investigated the relationships among the factors identified in the literature and their influence on trust. The first study was designed to explore possible methodological issues. The next three studies, conducted in
i
collaboration with researchers at the University of Nottingham, analysed further the relationship between usability and trust and between technology acceptance and presence with trust. The fifth experiment was conducted to specifically explore the influence of presence on trust. The last study looked at all factors, and validated the framework, demonstrating that technology acceptance and presence are predictors of trust in VR, and usability has an indirect effect on trust, as it is a strong predictor of technology acceptance. This research generated a model which includes well-studied factors in human computer interaction and human factors and could be applied to study trust in VR for different systems. This model increases the amount of information on VR, both on an academic and industrial point of view. In addition, guidelines based on the model were generated to inform the evaluation of existing VR systems and the design of new ones.
ii
Acknowledgments My first thank goes to my first supervisor, Dr. Glyn Lawson for his endless support both for work and personal matters. Acknowledgments go to Jaguar Land Rover, in the person of Mr. Brian Waterfield for the opportunity to work in such an important environment. I am also thankful to my second supervisor, Prof. Sarah Sharpless for helping and sharing her knowledge. I would also like to thank my examiners Dr. Sue Cobb and Prof. Anthony Steed, for their precious suggestions during and after the VIVA. I would like to thank the Human Factors Research Group at the University of Nottingham for the incredible work environment and the awesome cakes. Particular thanks go to Dr. Harshada Patel and Dr. Mirabelle D’Cruz for their support and encouragement. A special acknowledgment goes also to the PGSA and Nomads for allowing me to vent my frustration in the pitch. Thanks to my “Nottingham” friends: Chrissie, Jacob, Maria Laura, Simone, Sofia and Violetta. Special thanks go to my best friends Daniele, Gianluca and Paolo, for being always there when needed the most. A particular acknowledgment goes to Daniele for his time wasted trying to explain statistics to me. This thesis would not have been possible without the support of my entire Italian and Spanish family, so a special thank you for everything you gave, give and will give to me. Dulcis in fundo, my greatest thank goes to the person this thesis is dedicated to: my life companion Maria. Thank you for listening to me, for helping me, for supporting me, for laughing with me and for making my life awesome every day.
iii
iv
Table of Contents Abstract ...........................................................................................................i Acknowledgments ......................................................................................... iii Table of Contents............................................................................................v Table of Figures ........................................................................................... viii Table of Tables............................................................................................... xi Acronyms...................................................................................................... xii 1.
2.
3.
Introduction ........................................................................................... 1 1.1
Background .............................................................................................. 1
1.2
Contributions ........................................................................................... 3
1.3
Aims ........................................................................................................ 4
1.4
Research approach .................................................................................. 5
1.5
Thesis Overview ....................................................................................... 9
Chapter 2 – Literature Review .............................................................. 13 2.1
Chapter Overview .................................................................................. 13
2.2
VR .......................................................................................................... 13
2.3
Trust ...................................................................................................... 26
2.4
Technology acceptance. ......................................................................... 33
2.5
Presence ................................................................................................ 40
2.6
Usability................................................................................................. 45
2.7
Chapter Conclusion ................................................................................ 50
Chapter 3 – Research method and pilot study ...................................... 52 3.1
Chapter Overview .................................................................................. 52
3.2
Measures ............................................................................................... 52
3.3
Data analysis .......................................................................................... 56
3.4
Pilot Study: Introduction ........................................................................ 58
3.5
Hypothesis ............................................................................................. 58
3.6
Method .................................................................................................. 59
3.7
Results ................................................................................................... 67
v
4.
5.
6.
7.
8. vi
3.8
Discussion .............................................................................................. 80
3.9
Chapter Conclusion ................................................................................ 82
Chapter 4 – Single and paired factors ................................................... 84 4.1
Chapter overview................................................................................... 84
4.2
Introduction ........................................................................................... 84
4.3
Contribution to the studies .................................................................... 85
4.4
Study 1 (Desktop VR) ............................................................................. 86
4.5
Study 2 (Flight simulator) ....................................................................... 91
4.6
Study 3 (Virtual Boot) ............................................................................. 97
4.7
General Discussion ............................................................................... 106
Chapter 5- Presence Study ................................................................. 108 5.1
Chapter description ............................................................................. 108
5.2
Introduction ......................................................................................... 109
5.3
Method ................................................................................................ 111
5.4
Results ................................................................................................. 117
5.5
Discussion ............................................................................................ 126
5.6
Conclusion ........................................................................................... 130
Chapter 6 – Final Validation ............................................................... 131 6.1
Chapter Overview ................................................................................ 131
6.2
Introduction ......................................................................................... 131
6.3
Design.................................................................................................. 134
6.4
Method ................................................................................................ 141
6.5
Results ................................................................................................. 142
6.6
Discussion ............................................................................................ 156
6.7
Conclusion ........................................................................................... 162
Chapter 7 – Discussion and conclusion ............................................... 164 7.1
Chapter overview................................................................................. 164
7.2
Summary of results .............................................................................. 164
7.3
Discussion ............................................................................................ 169
7.4
Limitations ........................................................................................... 179
7.5
Future steps ......................................................................................... 182
7.6
Conclusion ........................................................................................... 183
References ......................................................................................... 185
9.
Appendices .........................................................................................201 9.1
Questionnaires..................................................................................... 201
9.2
Recruitment posters ............................................................................ 242
9.3
Information sheets............................................................................... 245
vii
Table of Figures Figure 1.1 The framework to investigate trust in VR ________________________________ 6 Figure 1.2 Pilot study shown on the framework of trust in VR _______________________ 10 Figure 1.3 Studies 2,3,4 shown on the framework of trust in VR ______________________ 11 Figure 1.4 Study 5 shown on the framework of trust in VR __________________________ 11 Figure 1.5 Final study shown on the framework of trust in VR _______________________ 12 Figure 2.1 Real-virtual continuum (above) and EWK continuum. Source: Milgram and Colquhoun Jr., 1999). _______________________________________________________ 19 Figure 2.2 RF continuum for real objects (above) and virtual objects (below). Source: Milgram and Kishino, 1994. _________________________________________________________ 20 Figure 2.3 EPM continuum (below) and progress of display media (below). Source: Milgram and Kishino, 1994._____________________________________________________________ 21 Figure 2.4 The simplified representation of the uncanny valley. Source: Mori, 1970 (translation by MacDorman and Minato). ________________________________________________ 24 Figure 2.5 Model of trust in technology. Source: Lippert and Swiercz, 2005 _____________ 30 Figure 2.6. Model of trust. Source: McKnight et al., 2011 ___________________________ 31 Figure 2.7 Scheme of the TAM3. Source: Venkatesh and Bala, 2008. __________________ 36 Figure 2.8 Model of TAM grouping all the factors. Source: Venkatesh and Bala, 2008 ____ 37 Figure 2.9 Determinants of presence following Lessiter et al. (2001) work. _____________ 42 Figure 2.10 Model of quality in use ____________________________________________ 47 Figure 2.11 Determinants of usability. Source: Bevan, 1991 _________________________ 48 Figure 3.1 Example of a car model displayed in the JLR CAVE ________________________ 60 Figure 3.2. Representation of the first task: "Rotate the car at 90 degrees"_____________ 62 Figure 3.3 Representation of the second task: "Zoom the car using the fly menu" ________ 63 Figure 3.4 Representation of the third task: "Move the front part of the car and reset the position"_________________________________________________________________ 63 Figure 3.5 Representation of the fourth task: "Measure the car's logo" ________________ 64 Figure 3.6 Representation of the fifth task: "Cut the car until the front wheels disappear" _ 65 Figure 3.7 Representation of the sixth task: "Take a snapshot of the car logo" __________ 65 Figure 3.8 Scatter-dot plot of the responses to the SUS questionnaire _________________ 69 Figure 3.9 Scatter-dot plot of the responses to the technology acceptance questionnaire. _ 70 Figure 3.10 Scatter-dot plot of the responses to the ITQ-SOPI questionnaire. ___________ 70 Figure 3.11 Scatter-dot plot of the responses to the trust questionnaire. _______________ 71 Figure 3.12 Levels of cybersickness as measured with the SSQ (1=none, 2= slightly, 3=Moderate, 4=Severe). _______________________________________________________________ 71 Figure 3.13 Scatter-dot plot of the interaction between SUS and trust. ________________ 73
viii
Figure 3.14 Scatter-dot plot of the interaction between technology acceptance and trust.__ 74 Figure 3.15 Scatter-Dot plot of the relationship between ITC-SOPI and trust. ____________ 75 Figure 3.16 Scatter-dot plot of the interaction between spatial presence and trust. _______ 76 Figure 3.17 Scatter-dot plot of the interaction between engagement and trust. __________ 76 Figure 3.18 Scatter-dot plot of the interaction between ecological validity and trust. ______ 77 Figure 3.19 Scatter-dot plot of the interaction between negative effects and trust. _______ 77 Figure 3.20 Scatter-dot plot of the interaction between pre-interaction trust and trust. ____ 79 Figure 4.1 Real (left) and virtual (right) model of the car. Image from Borsci et al. (2016) __ 88 Figure 4.2 Scatter-dot plot of the responses to the SUS questionnaire. _________________ 89 Figure 4.3 Scatter-dot plot of the responses to the trust questionnaire. ________________ 90 Figure 4.4 Scatter-dot plot of the interaction between SUS and trust. __________________ 90 Figure 4.5 Scatter-dot plot of the responses to the SUS questionnaire. _________________ 94 Figure 4.6 Scatter-dot plot of the responses to the trust questionnaire. ________________ 95 Figure 4.7 Scatter-dot plot of the interaction between SUS and trust. __________________ 95 Figure 4.8 image of the real car (left) and the virtual model (right) used during the experiment. Image from Lawson et al. (2017). ______________________________________________ 99 Figure 4.9 Scatter-dot plot of the responses to the WS questionnaire. _________________ 103 Figure 4.10 Scatter-dot plot of the responses to the technology acceptance questionnaire. 103 Figure 4.11 Scatter-dot plot of the responses to the trust questionnaire. ______________ 104 Figure 4.12 Scatter-dot plot of the interaction between technology acceptance and trust._ 104 Figure 4.13 Scatter-dot plot of the interaction between technology acceptance and trust._ 105 Figure 5.1 Equipment used in the study. ________________________________________ 112 Figure 5.2 Screenshot of the environments used: desktop VR on the left and HMD on the right. ________________________________________________________________________ 112 Figure 5.3 Setting of the experiment. __________________________________________ 116 Figure 5.4 Box-plot of the trust questionnaire responses for the control group and the VR group. ________________________________________________________________________ 118 Figure 5.5 Box-plot of S.U.S responses for the control group and the VR group. _________ 119 Figure 5.6 Box-plot of the PQ responses for the control group and the VR group. ________ 119 Figure 5.7 Levels of cybersickness as measured with the SSQ (1=none, 2= slightly, 3=Moderate, 4=Severe) for the VR group. _________________________________________________ 120 Figure 5.8 Scatter-dot plot of the interaction between PQ and trust.__________________ 121 Figure 5.9 Scatter-dot plot of the interaction between S.U.S. and trust. _______________ 121 Figure 5.10 Scatter-dot plot of the interaction between S.U.S. and trust for the VR group. _ 123 Figure 5.11 Scatter-dot plot of the interaction between S.U.S. and trust for the control group. ________________________________________________________________________ 124 Figure 5.12 Scatter-dot plot of the interaction between pre-interaction trust and trust. ___ 125 Figure 6.1. Example of a high presence environment. _____________________________ 137
ix
Figure 6.2. Example of a low presence environment. _____________________________ 138 Figure 6.3. Example of a completed task. ______________________________________ 139 Figure 6.4 Setting of the experiment. _________________________________________ 141 Figure 6.5 Box-plot of the PQ responses for each condition. ________________________ 145 Figure 6.6 Box-plot of the technology acceptance questionnaire responses for each condition. _______________________________________________________________________ 145 Figure 6.7 Box-plot of the SUS responses for each condition. _______________________ 146 Figure 6.8 Box-plot of the PQ responses for each condition. ________________________ 146 Figure 6.9 Levels of cybersickness as measured with the SSQ (1=none, 2= slightly, 3=Moderate, 4=Severe). ______________________________________________________________ 147 Figure 6.10 Scatter-dot plot of the interaction between PQ and trust. ________________ 149 Figure 6.11 Scatter-dot plot of the interaction between technology acceptance and trust. 149 Figure 6.12 Scatter-dot plot of the interaction between SUS and trust. _______________ 150 Figure 6.13. New model without the direct influence of Usability. ___________________ 158 Figure 6.14. Definitive model with Technology acceptance as trust main predictor, presence as minor influencer and Usability as main predictor of Technology acceptance and presence as minor influencer. _________________________________________________________ 159 Figure 7.1 Evaluation timeline of a trust issue referring to the trust model. ____________ 175
x
Table of Tables Table 1.1 list of all the experiments conducted, the aims and the method used. ___________ 9 Table 2.1 Difference between trust in people and trust in technology. Source: McKnight et al., 2011_____________________________________________________________________ 28 Table 3.1 Demographic frequencies. ____________________________________________ 69 Table 3.2 List of regression performed __________________________________________ 73 Table 3.3 Coefficients of the regression with usability, technology acceptance and Presence as independent variable and trust as dependent variable. _____________________________ 78 Table 3.4 Regression with Usability, Technology acceptance, presence and pre-interaction trust as independent variables and trust as dependent variable. __________________________ 80 Table 4.1 Frequencies of the demographic data for VR experience. ___________________ 102 Table 5.1 Frequencies of the demographic data for VR experience. ___________________ 117 Table 5.2 T-test for PQ, S.U.S., trust and EDA between the two groups. _______________ 123 Table 6.1. Environments designed for the experiment. _____________________________ 136 Table 6.2. Frequencies of the participants demographic information. _________________ 144 Table 6.3 Descriptive of PQ, technology acceptance questionnaire, SUS and trust questionnaire for all the conditions._______________________________________________________ 144 Table 6.4. Correlations among usability, technology acceptance, presence, trust and cybersickness. The significant correlation have been highlighted in bold. ______________ 148 Table 6.5 Results of the double regressions. _____________________________________ 150 Table 6.6 Coefficients of the regressions with PQ and technology acceptance as independent variables and trust as dependent variable. ______________________________________ 150 Table 6.7 Coefficients of the regressions with SUS and technology acceptance as independent variables and trust as dependent variable. ______________________________________ 151 Table 6.8 Coefficients of the regressions with PQ and SUS as independent variables and trust as dependent variable. _____________________________________________________ 151 Table 6.9 Coefficients of the regression with SUS, PQ and technology acceptance as independent variables and trust as dependent variable. ___________________________ 151 Table 6.10. Coefficients of the regression (method: forward) with SUS, PQ and technology acceptance as independent variables and trust as dependent variable . _______________ 152 Table 6.11. Coefficients of the regression (method: forward) with SUS, PQ and technology acceptance as independent variables and trust as dependent variable. _______________ 153 Table 6.12 T-Tests results for each factor (presence, usability and technology acceptance). 154 Table 7.1 Summary of results from each study. __________________________________ 167
xi
Acronyms
xii
•
AR: Augmented reality
•
EDA: Electro-Dermal Activity
•
EPM: Extent of presence metaphor
•
EWK: Extent of World Knowledge
•
HCI: Human Computer Interaction
•
HF: Human Factors
•
HMD: Head Mounted Display
•
HRIS: Human resources information system
•
ITC-SOPI: ITC Sense Of Presence Inventory
•
MR: Mixed reality
•
PI: Place illusion
•
PQ: Presence Questionnaire
•
PSI: Plausibility illusion
•
RF: Reproduction fidelity
•
S.U.S.: Slater, Usoh and Steed questionnaire
•
SSQ: Simulator Sickness Questionnaire
•
SUS: System Usability Scale
•
TAM: Technology acceptance Model
•
VA: Virtual Assembly
•
VB: Virtual Body
•
VE: Virtual Environment
•
VR: Virtual Reality
Introduction 1.1 Background Studying the interaction between a person and a technology is fundamental for the correct use and adoption of the system (Corlett and Wilson, 1995; Chapter 1). In fact, there are examples in the literature of the misuse of technologies which have led to an enormous loss of money and time in best cases, and injuries and fatalities in the worst cases (For a review see: Proctor and Van Zandt, 2008; chapter 1). Human factors concerns the study of the interaction between people and technology and, among other aims, tries to improve the design of systems in order to be accepted and used properly by end users (Wilson and Sharples, 2015). The study of human factors in technology has been applied for decades and has seen promising results in the enhancement of wellbeing, performance, safety, job satisfaction, company image and the avoidance of errors (Wilson and Sharples, 2015). In this work, the focus is on Virtual Reality (VR). VR is a technology that has been rediscovered recently, thanks to a reduction in costs (Young et al.,2014) and it is currently being used in many fields, such as industry (for example: Lawson, Salanitri and Waterfield, 2016), healthcare (for a review: Ma et al., 2014), training (for example: Borsci et al., 2016) and education (for a review: de Faria et al., 2016). For example, in the automotive industry, VR is used in several processes, such as design, prototyping and ergonomic evaluation (Lawson, Salanitri and Waterfield, 2016). In all the fields where VR has been applied, the benefits of the use of this technology have been tangible. For example, VR applied to industrial processes has been seen to reduce cost and time of the development of a product, which are among the most important advantages in a competitive market (Lawson, Salanitri and Waterfield, 2016). In healthcare and training, VR has been applied thanks to its capacity to replicate real world situations and to distract the users in procedures such as pain reduction (Wismeijer and Vingerhoets, 2005), stroke rehabilitation (Lloréns et al., 2015), 1
industrial training (Borsci et al., 2016) and surgeon training (Seymour et al, 2002). However, in order to exploit the full potential of a technology, improve its efficacy, improve its safety and the probability that the technology will actually be used, the interaction between the user and the technology has to be taken into account. In the research conducted for this thesis, the study of trust that users have in VR systems was the primary focus. Trust has already been found to be fundamental in the interaction between a person and a technology (McKnight et al., 2011). The importance of this concept led to the introduction of a new type of trust, called “trust in technology”, where the object of trust is not a person, but a system (Mayer, Davis and Shoorman, 1995; McKnight et al., 2011). Trust in technology has been studied in systems such as e-commerce and e-market, where privacy is important due to the sharing of sensitive data (such as bank details or personal information) (Ba, Whinston and Zhang, 1999; Gefen, Karahanna and Straub, 2003) or in automated systems, especially in supervisors’ trust in machines they are responsible for (Muir and Moray, 1996). In these studies, it has been highlighted that trust could be one of the fundamental variables leading to the actual adoption of the technology. For example, talking about supervisors’ trust in automated machines, Muir (1994) wrote: “If we could not build automated systems that worked and could be trusted, we could not build supervisory control systems at all.” (p.1906). Muir and Moray (1996) found that trust “determines” (p.454) the use of automated technologies. Regarding e-commerce, McKnight et al. (2002) stated that lack of trust could deter the use of e-commerce. However, even though the importance of trust has been demonstrated in various fields, the concept of trust in VR has not received the necessary attention. Trust in VR could be fundamental in the fields where VR is applied. For instance, in the design phase, which has been seen to be one of the most expensive and timeconsuming processes in industry (Gomes de Sá and Zachmann, 1999) the belief that the system used is reliable and functional is critical for its correct application and to exploit the potential reduction in design cost and increase
2
in quality that VR offers (Lawson, Salanitri and Waterfield, 2016). A lack of understanding of factors that influence trust in VR could lead to users refusing to use the technology and consequently decrease VR advantages over other technologies. This PhD research aimed at developing a new model to investigate trust in VR. The aim was to understand if some of the factors known to enhance trust in other technologies (e.g. e-commerce, e-market, social network (Gefen, Karahanna and Straub, 2003, McKnight et al., 2002)) are also applicable to VR, and also to investigate additional factors, specific to VR systems (e.g. presence). The focus of the research was on VR in general, not a specific application. In fact, various systems (HMD, CAVE, desktop VR and flight simulator) were used. In addition, the type of environments and tasks were different in all the experiments. The model which will result from this thesis could be used to inform designers and VR experts about the main factors which will enhance trust in most VR systems. However, more in depth studies and research should be carried out for specific applications as the characteristics that each work context requires could be different and the factors could have a different weight in the development of trust. For example, some applications would require a high fidelity virtual environment and therefore may necessitate a higher sense of presence, but others may find this characteristic counterproductive. Nevertheless, the model created in this thesis offers a reference point of where to start and what aspects to consider when addressing trust in VR system design. This was the main motivation behind the development of this PhD project. A collaboration between an academic institution, the University of Nottingham, and an industrial firm, Jaguar Land Rover, was created, in order to investigate the factors enhancing trust in VR.
1.2 Contributions This PhD research had two contributions because of the different interests of the two partners involved in the PhD project. 3
1.2.1 Academic contribution VR systems, despite being invented several decades ago, are currently receiving great attention in academia, mainly thanks to the decrease in price and increase of quality (Young et al., 2014). However, there are many aspects of the technology which lack sufficient analysis, such as trust. This PhD project was developed in order to fill this gap and identify the factors that influence trust in VR system and identify potential relationships between them. 1.2.2 Industrial Contribution As stated in the previous section, VR is currently applied in many fields, including industry. This PhD project aimed at helping the design of new VR systems and guiding the modification of systems that are currently used. This is in order to enhance the trust end-users have in the system and, therefore, increase the likelihood that the system will be used, used properly and that the advantages VR has compared to other technology will be exploited. The model resulted from this PhD research will give guidelines to Jaguar Land Rover and other industries on how to evaluate and assess trust issue in their VR systems. These contributions guided the creation of the aims of the project which will be explained in the next paragraph.
1.3 Aims The aims of the project were as follows: Aim 1: to identify the possible factors influencing trust in VR The first step of the project was to identify the factors which have been seen to influence trust in VR derived from literature review. However, as stated before, there is a lack of studies investigating this aspect of VR systems. Therefore, it was useful to investigate, in literature, the factors which have been seen to enhance trust in other technologies and the factors which have already been seen as important for VR systems and combining the two to identify possible predictors of trust in VR.
4
Aim 2: to develop and validate a model of trust in VR systems The combination of the literature on trust in other technologies and the literature on VR enabled the identification of the potential factors influencing trust. These factors were used to create a model to assess trust in VR. This PhD aimed at constructing and validating the model through a series of experiments. Aim 3: to inform the evaluation and design of VR systems in order to enhance their trustworthiness. As stated in the background section, this PhD project had two contributions, one academic and one for industry. The third aim referred to industry and aimed at informing the design and evaluation VR system especially for industrial applications. This was achieved through the development of guidelines on which characteristics should be considered when developing or adopting a VR system. The guidelines are generic and were based on previous literature on the factors studied in this thesis.
1.4 Research approach The research approach taken to achieve the aims cannot be explained without reference to the literature review. Therefore, this section will present a brief explanation of the framework developed.
5
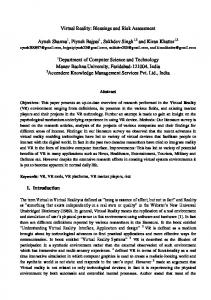
1.4.1 The framework In the framework, three factors were included as influencers of trust in VR: technology acceptance, presence and usability. The framework is depicted in the image below
Figure 1.1 The framework to investigate trust in VR
The framework was created by combining the literature on trust in technology and the literature on VR. The results of this combination were three main factors: technology acceptance and usability, which were found to be related to trust in general technology and in other systems (Hernández-Ortega, 2011; Lippert and Swiercz, 2005), and presence, which has been seen as fundamental in the VR field (Witmer and Singer, 1998, Slater and Wilbur, 1997). As can be seen from the image above, the framework theorises that the three factors have an equal and direct influence on trust. However, since it was the first time this framework was validated, there was the possibility that the three
6
factors may have different impact on trust and that one, two or all the three factors may not have any effect on trust. In order to validate the framework, empirical studies were designed to assess the relationship between the factors. This included assessing the individual factors and their relationship with trust, but also more generally an understanding of the overall nature of the model. This was particularly important in order to prioritise the series of interventions an industry could use to develop a VR system. 1.4.2 Experimental plan In order to validate the framework described above, a series of experiments were designed in collaboration with other researchers working in the VR field. Data from six studies were used to validate the framework described above. Table 1.1 presents a summary of the six experiments with a brief explanation of the factors investigated, the aim and the methodology used.
7
Study
Factor(s)
Aim
Method
VR Technology
Study 1-
Usability/
To investigate the
19
Pilot Study
Technology
reliability of the
participants
acceptance/
questionnaires chosen,
performing six
Presence
to spot methodological
assembly and
and deign issues and to
disassembly
have a first set of data on
tasks
CAVE
the relationship between usability, technology acceptance and presence with trust Study 2-
Usability
Investigate the
22
relationship between
participants
usability and trust in a
performing
desktop VR
one task
Investigate the
8 participants
Flight
Flight
relationship between
performing
Simulator
Simulator
usability and trust in a
three tasks
Desktop VR
Study 3-
Usability
Desktop VR
flight simulator Study 4-
Technology
Investigate the
22
Virtual Boot
Acceptance/
relationship between
participants
Presence
presence and Technology
looking at a
acceptance with Trust
virtual car
CAVE
model. Study 5Presence
Presence
Investigate the
50
Head-
relationship between
participants
Mounted
presence and trust
divided in two
Display and
groups, half
Desktop VR
with immersive VR and half with nonimmersive VR
8
Study 6-
Usability/
Investigate the
40
Head-
Final
Technology
relationship between the
participants
Mounted
acceptance/
three factors and trust
interacting
Display
Presence
and how the factors
with eight
interact with each other.
different VE and performing a task
Table 1.1 list of all the experiments conducted, the aims and the method used.
A more detailed overview of each experiment will be given in the next section.
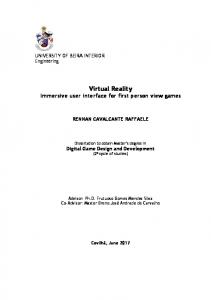
1.5 Thesis Overview This paragraph will provide an overview of this thesis, with a brief explanation of each chapter. 1.5.1 Chapter 2 - Literature Review The literature review chapter provides a description of the theories and studies taken into consideration for the development of the framework. The literature review was mostly from human factors and HCI fields, but also from computer science, psychology and engineering. In addition, the process of creating the framework is explained giving an in-depth explanation of all the factors taken into consideration and the reasons the factors were chosen depending on the previous literature. 1.5.2 Chapter 3 - Pilot Study Chapter 3 first describes the measures used during the PhD research and then reports the pilot study designed to investigate the design, methodology and measures to be used in the subsequent experiments. The pilot study focused more on the practice of research than on the results. However, some data were collected and analysed, in order to have also the first glance at the validation of the model and the behaviour of the factors (Figure 1.2).
9
Figure 1.2 Pilot study shown on the framework of trust in VR
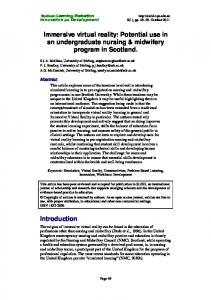
1.5.3 Chapter 4 - Single and paired factors studies. Chapter 4 gives a description of the three studies where the factors were considered singularly or paired. This was to investigate the relationship between each factor (technology acceptance, usability and presence) and trust when taken alone or in pairs. The research described in this chapter is the results of three different collaborations. The first collaboration was with two different researchers, who were investigating the usability of VR systems and agreed to add the measure of trust in their experiments. Thus, two studies investigated the relationship between usability and trust. Consequentially, another collaboration was made to add measure of technology acceptance and presence in a VR experiment.
10
Figure 1.3 Studies 2,3,4 shown on the framework of trust in VR
1.5.4 Chapter 5 - Presence Study Chapter 5 provides a detailed explanation of study 5, which focuses on the relationship between presence and trust.
Figure 1.4 Study 5 shown on the framework of trust in VR
1.5.5 Chapter 6 – Final validation Chapter 6 describes the last experiment conducted. The final study focused on the relationship between the three factors and trust. This study was 11
particularly important in the plan because it not only investigated the relationship between the three factors and trust, but it also analysed the relationship within the framework. This study was the final validation of the model.
Figure 1.5 Final study shown on the framework of trust in VR
1.5.6 Chapter 7 – Discussion and Conclusion The last chapter provides the discussion and conclusion of the PhD project. Moreover, it highlights the novelty and the achievements of the aims described in the first section of this chapter. Finally, it draws the final conclusion of the research work, including limitations and future steps.
12
Chapter 2 – Literature Review 2.1 Chapter Overview This chapter describes the literature review that serves as a background to the experimental work conducted. The review includes the studies in the VR fields and the main factors relevant for the adoption and acceptance of this technology. Moreover, literature on trust in VR and trust in technology, was added. This identified three main factors as potential influencers of trust in VR: technology acceptance, usability and presence. In addition, the chapter describes the literature on each of the three factors and the reasons those were chosen to be included in the model to study trust. The chapter will then present a theorised framework for trust in VR.
2.2 VR 2.2.1 Definition In one of its most used definitions, VR is a 3D virtual environment generated by a computer, where people can interact (Rheingold, 1991). This definition will also be the one chosen for this thesis. Defining VR as a 3D virtual environment, allows the inclusion of a broad range of systems, which are not the typical representation of VR systems, usually narrowed to Head-Mounted Displays (HMD) only. Coates (1992) stated: “Virtual Reality is electronic simulations of environments experienced via head mounted eye goggles and wired clothing enabling the end user to interact in realistic three-dimensional situations.” (In Steuer, 1992; p. 74). Greenbaum (1992) argued that: “Virtual Reality is an alternate world filled with computer-generated images that respond to human movements. These simulated environments are usually visited with the aid of an expensive data suit which features stereophonic video
13
goggles and fiber-optic data gloves.” (In Steuer, 1992; p. 75). However, as Steuer (1992) pointed out, these definitions constrain the range of technology that could be defined as VR systems to a few sample (only HMDs). In this thesis, many systems were used in the experiments and only one respects the Coates (1992) and Greenbaum (1992) definitions, but all of them can be defined as VR systems following the Rheingold (1991) and Steuer (1992) ideas. 2.2.2 Terminology VR is often called and defined by other names, such as virtual environments, virtual world and microworlds (Gigante, 1993), mainly to avoid the unrealistic expectations that the terms virtual reality gives (exact representation of the reality in the virtual) (Earnshaw, 2014). In this thesis, the most commonly used term will be adopted, that is VR. It is useful to mention two other terms derived from VR: Augmented Reality (AR) and Mixed Reality (MR). MR includes all technology where real and virtual world are combined (Milgram and Kishino, 1994) which includes AR. AR is defined as a system which superimposes virtual objects on the real world (Azuma et al., 2001). Azuma and colleagues (2001) gave three main properties of AR (p.34): •
combines real and virtual objects in a real environment;
•
runs interactively, and in real time;
•
registers (aligns) real and virtual objects with each other.
Among the MR technologies, Milgram and Kishino (1994) also added a new term called Augmented Virtuality, that is when a completely virtual world is “augmented” with real objects. Milgram and Kishino (1994) developed a virtual continuum, from the real world to an entire virtual world. MR is whatever is in the middle, with AR being closer to the real world and augmented virtuality being closer to the virtual one. A representation of the continuum is shown in the image below.
14
Figure 2.1 Reality continuum, from the real world to Virtual Reality (Source: Milgram and Kishino, 1999)
2.2.3
VR in industry
In the patent of one of the first VR technologies created (Sensorama), Heilig (1962) anticipated one of the major advantages of using VR in industry. The author wrote: “Industry, on the other hand, is faced with a similar problem due to present day rapid rate of development of automatic machines. Here, too, it is desired to train a labor force without the accompanying risks.” (Heilig, 1962) Even though this patent was written many years ago, it lists the major advantages that VR offers nowadays compared to other technologies: the capacity to replicate a real environment, but without the risks associated with it. In recent years, the competitiveness of the market requires industries to implement new methods to improve the quality of products and, at the same time, reduce costs and time (Choi and Cheung, 2008). With this aim, VR has been implemented in several industry processes (Lawson, Salanitri and Waterfield, 2016) described below. The recent implementation of VR in industrial processes is mainly due to the decrease in VR cost. In fact, as Choi et al. (2015) stated, in the past, VR was only used for the design of premium products, due to the low return on investment (Choi et al., 2015). In recent years, however, the dramatic decrease of VR systems costs permitted the expansion of the use of VR in many industrial fields such as, among others, design, prototyping, manufacturing, assembly and training.
15
2.2.3.1 Design Design is usually one of the most expensive and time-consuming phases of a product development (Gomes de Sá and Zachmann, 1999). It constitutes one of the biggest “bottlenecks” in the process of development, due to the cost and possible misunderstanding that, for example, building physical mock-ups could cause and the needs to revert and repeat processes several times before the final products reach the market (Fiorentino et al., 2002). Gomes de Sá and Zachmann (1999) estimated that 70% of the cost of the life cycle of a product is influenced by the decisions made in the early design stage. VR has been seen as potentially useful to solve these issues and make the process faster and more effective. Examples of how VR can help in the design process are: replacing physical mock-ups (Shao et al., 2012); avoiding the process of rebuilding a model in case of design errors (Kim et al., 2011); being used in early design stages (Lawson and Burnett, 2015); permitting 1:1 scale prototypes, which can add further information in the early phases (e.g. VR permits the users to sit in a 1:1 model of a car and see any possible visual constraint and issues in control accessibility) (Noon et al., 2012); and permitting collaborative design, where a multidisciplinary team, even based in different locations, can work together at the same time (Lehner and De Fanti, 1997; Mujber et al., 2004). A good example of a successful application of VR in design can be found in Purschke, Shulze and Zimmermann (1998), who describe how VR was implemented at Volkswagen®. The authors described a possible issue with using Computer-Aided Design (CAD) in the design process, that is the obstacle in information flow between various department, especially the styling department. This is because the usual tools used in all the phases of design may not be suitable with the intuitive and creative work of stylists. The authors found that VR could solve this problem, providing an immersive environment and an improved human-computer interaction (Purschke, Shulze and Zimmermann, 1998)
16
2.2.3.2
Virtual Prototyping
The process of prototyping through VR is called virtual prototyping. Virtual prototyping is arguably the most used example of VR effectiveness in industry. This is due to the fact that in the case of prototyping VR has been seen to reduce the time and cost of the process of design, permitting the modification in real time of a model (Kulkarni et al., 2011). This avoid issues manifesting from errors in the early stages of design which are among the most common errors in design (Gomes de Sá and Zachmann, 1999). 2.2.3.3 Manufacturing and Assembly The design of manufacturing systems in an industry were usually carried out following algorithms using operations research approaches (Vosniakos and Gogouvitis, 2015). However, this approach does not take into account fundamental factors such as ergonomics, machine collaboration and human factors. To obviate this issue, discrete simulations are used, but these do not allow the 3D representation of spaces, equipment and humans. VR has been suggested as the solution to all these issues, allowing the 3D simulation of processes such as material flow, collision risks and installation planning (digital factories, see section 2.2.3.3.1) (Vosniakos and Gogouvitis, 2015). This is particularly important as it has been seen that VR, permitting the representation of a virtual workspace, gives significant advantages in the process of design and tool implementation (Jayaram, Connacher and Lyons, 1997). In a review, Choi et al. (2015) found that VR is being applied widely to design reviews and assembly tests of products. In addition, there are studies which highlight the improvement in decision making, cost reduction (Mujber., 2004) and the enhancement of risk measures and control of manufacturing process (Lee et al., 2001). 2.2.3.3.1
Factory planning
One of the applications of VR in manufacturing concerns the process of “factory planning”. Factory planning is a problem-dealing process, aiming at optimizing processes such as material flow, resource utilization and logistics. The digitalisation of factory planning is called “digital factory” (Kühn, 2006). 17
Menck et al. (2012), explained that factory planning is composed of six stages (for more details see Menck et al., 2012) and, even if they are consecutive in time, overlapping and parallelization are required. Moreover, the planning includes various departments working together and it has been seen that cooperation and communication are key factors for increasing efficiency and decreasing complexity (Menck et al., 2012). VR has been seen to be a technology that favourite this process, permitting the 3D simulation of the environments and the collaboration of various experts even remotely located. 2.2.3.3.2
Virtual assembly (VA)
Another aspect of virtual manufacturing is VA. This includes the possibility to perform assembly and disassembly tasks in VR. Jayaram et al. (1997), demonstrated that VA increases the product quality and decreases time-tomarket, giving tangible advantages in the process of design and new tools implementations. 2.2.3.4
Training
Strictly connected with manufacturing, also the process of training has seen an adoption of VR systems. The main advantage that VR systems offers in training are the riskless situations in which workers can be trained, together with an immersive environment which has been seen to be more effective than standard training methods (Borsci et al., 2015). Stone (2001) showed that VR training improved the task completion (compared to training with real equipment) from the 50th to the 66th percentile. Borsci et al. (2015) tested the effectiveness of VR training for car maintenance against paper-based training and video training. The results showed that participants using a VR training performed better in the immediate and had better information retention after two and four weeks. 2.2.4
Influence on VR design on users’ experience
As explained in the introduction section, VR has different characteristics compared to other technologies. Some of these characteristics can influence the users’ experience, behaviour and perception of the systems and could be important in the development of trust.
18
In this paragraph, five VR
characteristics will be described: the “extent of world knowledge”, “reproduction fidelity” and “extent of presence metaphor” (Milgram and Kishino, 1994), the “manipulation of plausibility illusion” (Slater 2009) and the “uncanny valley” (Mori, 1970). 2.2.4.1
Extent of world knowledge, reproduction fidelity and extent of presence metaphor
In section 2.2.2 of this thesis the Milgram and Kishino’s (1994) real-virtual continuum was presented. However, the authors provide deeper explanation of the difference between real and virtual (and all the configurations in the middle of the continuum) adding three more possible “taxonomies for merging real and virtual worlds” (Milgram and Kishino, 1994; p.11): the “extent of world knowledge” (EWK) the “reproduction fidelity” (RF) and the “extent of presence metaphor” (EPM). The first one concerns the amount of knowledge that the computer holds about the objects being rendered (and displayed) in the VE. Figure 2.1 shows the comparison between the two continuums.
Figure 2.1 Real-virtual continuum (above) and EWK continuum. Source: Milgram and Colquhoun Jr., 1999).
By “world completely modelled” (right extreme), the authors mean that the computer knows exactly which object is being displayed and where it is being displayed. If, for example, a picture of a real-life situation was to be added to the environment, the environment would move from the right extreme of the continuum toward the middle (the position depends on the number of pictures displayed and the space taken in the VE). If a digitalised image was to be superimposed to a real-life picture the environment would lean from the
19
middle towards the left extreme. Finally, if, for instance, the environment was a scan of a real-life image or a real-life situation itself, the environment would be in the left extreme. For what concerns this PhD work, the focus is on the right extreme of the two continuums, that is a completely virtual environment and a world completely modelled. Another way to describe real-virtual difference is the taxonomy used by the authors for the RF. Figure 2.2, shows the RF continuum.
Figure 2.2 RF continuum for real objects (above) and virtual objects (below). Source: Milgram and Kishino, 1994.
This dimension has more to do with realism and specifically with the image quality (Milgram and Kishino, 1994). The goal of the authors is to switch the scope of previous taxonomies where presence (see section 2.5) is the ultimate goal. This is because, this taxonomy considers also VEs with good image quality but not aiming at making the user feel present, as well as environment with relatively poor image quality but able to immerse a person. RF applies both to the vision of real images (e.g. pictures, scan; left extreme of the EWK continuum) and virtual ones (digitalised object; right extreme of the EWK continuum). Referring to this, the authors mentioned an extremely important aspect of this continuum: “Even though the simplest wireframe display of a virtual object and the lowest quality video image of a real object are quite distinct, the converse is not true for the upper extrema” (Milgram and Kishino, 1994; p. 11). This means that concerning the right extreme of the continuum, the distinction between real and virtual could fade away and a digitalised image (in Figure 2.2 “Real-time, Hi-fidelity 3D animation”) could be no different from a real life picture (in Figure 2.2 “3D HDTV”) or even real-life objects. As the authors argued in their work, if the right extreme was to be 20
achieved, there would be no way to distinguish between a picture or a scan image and an object virtually rendered. The last dimension that the authors described in their paper concerns the sense of presence (see section 2.5), which is a factor included in the trust model described in this thesis. Figure 2.3 depicts the continuum.
Figure 2.3 EPM continuum (below) and progress of display media (below). Source: Milgram and Kishino, 1994.
As can be seen from the figure, the continuum goes from monoscopic imaging, where the user sees the virtual world from the outside through a single view point, to a realtime imaging, where, in theory, there should be no difference between mediated reality (i.e. virtual reality) and unmediated reality (i.e. real life). The continuum progresses from the left extreme to the right, improving the immersion (i.e. being on the outside with the monoscopic imaging versus being on the inside with the rest of the systems), the view point (i.e. single view point of the monoscopic imaging versus wider field of view of the multiscopic or panoramic imaging) and capacity of movement in the VE (no movement at all with the monoscopic and multiscopic imaging versus head movement with the panoramic imaging versus full body movement with surrogate travel and realtime imaging). The taxonomies described above are particularly important for this thesis. In particular, the RF continuum highlight that the sense of presence could strongly depend on the type of VE but also on the type of task presented. This is one of the justifications of the generalisation of the model presented in this thesis. In fact, people may trust an environment that is high quality but not immersive or an environment that is low quality but highly immersive depending on the context in which VR is used. Interestingly, the fact that, if the
21
EPM right extreme was to be achieved there would not be any discernible difference between real and virtual, could mean that users would feel the same sense of presence they feel in the real world. Therefore, if presence influences trust, it can be assumed that people would trust a system in the right extreme of the EPM continuum as they would trust a real-world object. 2.2.4.2
Self-avatar and plausibility illusion (PSI)
The concept of Plausibility Illusion (PSI) was introduced by Slater (2009) as one of the two dimensions composing presence. Following the author’s idea, Place Illusion (PI) and PSI are two orthogonal dimensions of presence. PI correspond to the classic definition of “the sensation of being there” (for a deeper description of the presence definition(s) see section 2.5) while PSI refers to the illusion that what is happening in the VE is actually happening, even though the users know that it is not (Slater, 2009). Skarbez et al. (2017) argued that if immersion is the main factor of PI, coherence is the main factor of PSI. The authors defined coherence as “the set of reasonable circumstances that can be demonstrated
by
the
scenario
without
introducing
unreasonable
circumstances, and a reasonable circumstance as a state of affairs in a virtual scenario that is self-evident given prior knowledge” (Skarbez et al., 2017; p. 1369). That is the degree of how much the VE matches the users’ expectations. In the same research, the authors found that one of the most important characteristics of coherence is the representation of the users’ virtual bodies (VBs). In their experiment, the researchers found that the vast majority of participants rated the presence of a VB as the most important factor for PSI. This particular aspect is very important for this thesis as the presence of a VB (or self-avatar) has been found related to trust in shared virtual environments (SVE) (Pan and Steed, 2017), net-based collaborations (Bente et al., 2008) and robot-mediated communication (Rae, Takayama and Mutlu, 2013). Therefore, an aspect that has been found to influence presence (PSI) also influences trust. Even though the authors investigated trust users have in another avatar or actor involved in the scenario (that is more related to trust in people) it is still important and can be applied to users trust in VR systems.
22
In addition, Skarbez et al. (2017) also found that the second most important aspect in the perception of coherence was the appropriateness of the virtual environment to the situation presented. Participants preferred an environment matching the scenario they were in (in this case, a bar) rather than an abstract or mismatched environment. Finally, Skarbez et al. (2017) study revealed that participants gave importance to the behaviour of a virtual object (in this case a ball) when using it extensively, rather than when rarely using it or not using it at all. If presence is a factor of trust, as hypothesised in this thesis, these aspects could be very important. Indeed, they can be considered as possible additions in a system in order to enhance presence and, therefore, trust. 2.2.4.3
The “uncanny valley”
Another VR characteristic related to user experience and trust is the phenomenon of the “uncanny valley”. This concept was first described by Mori (1970) in relation to robotic appearance and movement. The author found that while it is true that familiarity increases when the human likeness increases (e.g. a humanoid robot is perceived as more familiar than an industrial robot), when an object is close to a real-life appearance but not exactly the same there is a reduction in familiarity and believability and the users can become uneasy and uncomfortable. Figure 2.4 depicts the concept of uncanny valley with some examples.
23
Figure 2.4 The simplified representation of the uncanny valley. Source: Mori, 1970 (translation by MacDorman and Minato).
Even though the uncanny valley was first theorised in the field of robotic, the current technological progress and the development of more realistic renderings has seen the phenomenon also in computer graphic (Bartneck et al., 2009) and VR (Vinayagamoorthy, Steed and Slater, 2005). In their review, Vinayagamoorthy, Steed and Slater (2005) found that the uncanny valley phenomenon affects the modelling of virtual characters. The authors found that the enhancement of realism and behavioural complexity is not enough to build convincing virtual characters and a much more important factor is the consistency of behavioural fidelity (Vinayagamoorthy, Steed and Slater, 2005). In their review, McMahan, Lai and Pal (2016) analysed case studies applying the uncanny valley theory to fidelity interaction in VEs (The authors defined interaction fidelity as the exactness of real-world actions reproduction in an interactive system) (McMahan, Lai and Pai, 2016) and found that mid-fidelity interaction is worse than high-fidelity interaction and even than low-fidelity interaction. Furthemore, they found that mid-fidelity is worse than highfidelity in manipulation tasks (faster completion time of a manipulative task) and in search tasks (faster completion time of non-present targets). Mid-
24
fidelity interaction was also worse than low-fidelity in steering tasks (faster driving time and fewer mistakes) and navigation tasks (faster travel times). According to the researchers, a possible cause of the uncanny valley phenomenon in fidelity interaction could be the familiarity of the controller. In fact, they argued that in high-fidelity interaction the controller is similar to real life, hence the familiarity is high. In the low-fidelity interaction, controllers are usually vastly used tools, such as the keyboard and mouse combination, therefore the users are already familiar with them. However, in mid-fidelity interaction the controllers are something in the middle and the users will have to adjust to them. Even though the uncanny valley in interaction fidelity can be applied to this thesis, the phenomenon is usually explored regarding avatars in VE. Therefore, the application in this work is limited. However, the fact that the system design can influence the familiarity and believability of a VE aspect, is strongly connected to the aim of this work. 2.2.5 Conclusion As it has been described in the previous sections, VR has been implemented in various fields within industry and has been seen as more effective and less risky than other methods. However, the issue of trust in VR has arisen in the various research, such as the uncanny valley phenomenon and the PSI. The VR characteristics described in this section showed how the design of VR systems and VE can influence the users’ experience and interaction. However, some of these well-known theories only partially apply to this work. For instance, the Milgram and Kishino (1994) taxonomy is more related to AR than to VR. The manipulation of PSI and the uncanny valley are more related to the exploration of social interaction between different actors in VE and strongly refer to avatars and VBs. Therefore, there is a need for a new model for trust in VR, having trust in VR systems as the main focus.
25
2.3 Trust 2.3.1 Introduction Trust is a psychological and social concept that has been investigated for many decades. Searching for a unique definition would be a hard, if not impossible, task (Hernández-Ortega, 2011). Indeed, the definition of trust depends widely on the actors included in the relationship and in the situation where trust is investigated (Husted, 1998). As Husted (1998) argued, the actors both receiving or giving trust could be very different, and, depending on the situations and the actors, trust could be also a negative concept. For example, decisions based on trust and not on strictly economic rules can lead to misallocation of capital. Regarding the aim of this work, the concept of trust is referred to as the interaction between users and technology. Therefore, this work will not focus of the concept of trust in people, even though, for completeness, the difference between trust in people and trust in technologies will be described. 2.3.2 Definitions: Trust in people versus Trust in technologies. Trust is a complicated and vast concept, present and fundamental in every aspect of a person’s life (e.g. inter-personal, intra-personal, management, leadership). Rousseau et al. (1998) stated that trust is the willingness to rely upon another person. Mayer, Davis and Shoorman (1995) stated that trust is: “the willingness of a party to be vulnerable to the actions of another party based on the expectation that the other will perform a particular action important to the trustor, irrespective of the ability to monitor or control that other party.” (p. 712). These two definitions, among the most used in the literature, could seem similar in the form, but are extremely different for the purpose of this work. In fact, this thesis is focused on trust in VR, which is a technology, not a person. However, the Mayer, Davis and Shoorman (1995) definition does not specify that the trustee has to be a person, using the word “party”. Thus, is it possible to trust an object? The answer, unfortunately, is far from simple. There is no agreement in the literature on the answer to this
26
question. For example, Friedman, Khan and Howe (2000) stated that “People trust people, not technology” (p. 36), because trust requires entities to be capable of “experience good will, extend good will toward others, feel vulnerable, and experience betrayal” (Ibidem), which is impossible for technologies. The authors, however, also stated that people can rely on technology (but not trust them). On the contrary, McKnight and colleagues (2011) revised the definition of trust, stating that: “Trust situations arise when one has to make oneself vulnerable by relying on another person or object, regardless of the trust object’s will or volition” (p. 3). This definition, more similar to the Mayer, Davis and Shoorman (1995) one, clearly states that the object of trust does not have to be a person. In this work, the McKnight et al. (2011) definition will be considered. In fact, technologies are an integral part of everyday communications and connections and, therefore, it is important to understand how people interact with them. People use technologies for almost everything, such as communications, work and entertainment, and most of these actions require trust. For example, when paying online, a person trusts the system of payment (being a phone app, software, ATM…) (Luo et al., 2010). However, even if both trust in people and trust in technology can exist, there are some differences between the two. Lippert and Swiercz (2005), gave four differences and similarities between trust in technology and trust in people: •
There is an asymmetry between the two actors. The trust toward a system is characterised by the impossibility for the technology to trust in return.
•
There are different measures to evaluate the trust toward a person or toward a system.
•
Both types of trust are assessed after the interaction with the other actor.
•
Both types of trust are perceptions about the object of trust. Going deeper regarding the differences between people trust and
technology trust, McKnight et al. (2011) compared the two types of trust,
27
taking into account three characteristics: contextual condition, object of dependence and nature of the trustor’s expectations. Table 2.1 describes the differences. Trust in People
Trust in Technology
Contextual
Risk, Uncertainty, Lack of total
Risk, Uncertainty, Lack
Condition
control
of total user control
Object of
People—in terms of moral
Technologies—in
Dependence
agency and both volitional and
terms of amoral and
non-volitional factors
non-volitional factors only
Nature of the
1. Do things for you in a
1. Demonstrate
Trustor’s
competent way. (Ability
possession of the
Expectations
(Mayer, Davis, & Schoorman,
needed functionality
(regarding the
1995))
to do a required task.
Object of
2. Are caring and considerate of
2. Are able to provide
Dependence)
you; are benevolent towards
you effective help
you; possess the will and moral
when needed (e.g.,
agency to help you when
through a help menu).
needed. (Benevolence (Mayer, Davis and Shoorman, 1995)) 3. Are consistent in 1.-2 above.
3. Operate reliably or
(Predictability [McKnight,
consistently without
Cummings and Chervany,
failing.
1998]) Table 2.1 Difference between trust in people and trust in technology. Source: McKnight et al., 2011
To investigate further the concept of trust1, its characteristics and determinant will be described in the next paragraph.
1
As stated earlier, this work will focus on the concept of trust in technology. Therefore, from now thereof, the term “trust” will refer to the concept of trust in technology
28
2.3.3 Characteristics of trust Trust is a multidimensional concept (Rempel, Holmes, & Zanna, 1985; McKnight et al., 2011). A good review of the various dimensions of trust is contained in the work of McKnight et al. (2011). In this section, two studies are reviewed on the dimensions of trust: Lippert and Swiercz (2005) and McKnight et al. (2011). Lippert and Swiercz (2005) gave three dimensions of trust: Predictability, Reliability and Utility. Technology Predictability is based on the individual’s ability to predict that the technology will fulfil the previous expectations on performance. Technology reliability is based on the perception that the technology is reliable enough in a dependence situation and technology utility is built on the perceived usefulness of the technology. McKnight et al. (2011) depicted a more complete picture of the dimensions of trust in a specific technology. The authors explained that trust in technology is reflected in three beliefs: functionality, helpfulness and reliability. Functionality refers to the capability of a technology to perform a specific task. Helpfulness is based on the belief that the technology will be helpful for the users and reliability refers to the perception that a technology works properly.
29
2.3.4 Determinants Regarding the factors influencing trust Lippert and Swiercz (2005) depicted a model (Figure 2.5) which includes several factors.
Figure 2.5 Model of trust in technology. Source: Lippert and Swiercz, 2005
As can be seen in the model, the authors divided the factors influencing trust in three categories: Technological, Organisational and User. As the name suggests, technological factors regard the characteristics of the technology used. It is divided into technology adoption, which is present when the user is constantly satisfied with the interaction with the system, technology utility, which refers to the system potential to fulfil expectations and technology usability, which is influenced by the users’ experience of the system. The users’ factors are divided into socialisation, that is how a new organisation member is introduced to the system, sensitivity to privacy and predisposition to trust. The organisational determinants all refer to the trust toward the company (Lippert and Swiercz, 2005). For the purpose of this work, the organisational factors and socialisation will not be taken into consideration, since the studies
30
will not be conducted in a particular company and the systems used are not always implemented in a firm. McKnight et al. (2011)’s model of trust explains that trust in technology is given, in general, by three factors: trust in a specific technology (functionality, reliability and helpfulness), propensity to trust and institution-based trust. Propensity to trust is defined as the tendency to trust technology in general. The general propensity to trust is developed regardless of the context and the technology used. This kind of trust is composed by two concepts: faith in general technology and trusting stance. The first relies on trust in the attributes of technology in general; the second is based on the beliefs that technology will develop positive outcomes. Institution-based trust, as McKnight et al. (2011) stated: “focuses on the belief that success is likely because of supportive situations and structures tied to a specific context or a class of trustee” (p. 8). The institution-based trust is composed by two factors: the situation normality, which refers to the fact that within a normal and welldefined setting, it is right to trust a new type of technology and the structural assurance, which takes into account the adequacy of the support and the infrastructure of the company. The relationship between the various attributes of trust is depicted in Figure 2.6.
Figure 2.6. Model of trust. Source: McKnight et al., 2011
31
To summarise the work of McKnight and colleagues, trust is a multidimensional concept. Both users and technology characteristics can influence the final trust in the system. Propensity to trust and Institution-based trust are considered as personal factors and the level of these two types of trust is not influenced by the use of the specific technology. Propensity to trust is a calculus-based trust, with which people decide to make themselves vulnerable. In other words, to trust without previous knowledge. Institutionbased trust is a knowledge-based trust, where people have enough information on, for example VR in general, to decide to trust the system. Both these types of trust are developed before the actual interaction with the technology. In this work, they will be called: pre-interaction trust. The trust in specific technology, instead, is developed after the use of the technology. It can be influenced also by the personal factors, but it depends on the system characteristics. 2.3.5 Trust application Trust in technology has been seen as fundamental in several technological fields, such as e-commerce, social network, web sites and information systems. For example, Ba, Whinston and Zhang (1999) found that the enhancement of trust in e-markets (e.g. eBay) through online feedback mechanisms, could mitigate the information asymmetry (i.e. the seller has more information than the buyer), decrease perceived risk and increase the price the buyer is willing to pay. Another example of trust applied to ecommerce is given in Gefen, Karahanna and Straub (2003). The authors explained that while trust is very important in any economic interaction, due to the possibility of undesirable opportunistic behaviour, it has even more impact in online commerce. In fact, in online interactions, it is easier for the seller to take advantage of the buyer thanks to anonymity. An example of opportunistic behaviour could be: “unfair pricing, conveying inaccurate information, violations of privacy, unauthorized use of credit card information, and unauthorized tracking of transaction” (Gefen, Karahanna and Straub, 32
2003, p 55). However, trust is seen to mediate the perceived risk of opportunistic behaviour and increase the intention to use. Lankton and McKnight (2011) investigated the dimension of trust in Facebook and found that the popular social network is trusted both as a technology and a “quasiperson”. Another example of trust applied to technology is the one already cited in the paragraphs above about the Human Resources Information System (HRIS) (Lipper and Swiercz, 2005) which was also studied by Ngoc Duc, Siengthai and Page (2013), who found that trust is one of the main factors influencing the decision of implementing HRIS. Another review of studies on trust in e-commerce can be found in Grabner-Krauter and Kaluscha (2003), which not only highlighted the importance of trust, but confirmed what was anticipated in the previous chapters: there is a need for a framework since the research on trust is: “in the stage of borrowing different constructs from other theories” (p. 803) and that there is no agreement on the determinants of trust. It is important to note that none of the articles on trust cited above treated VR as the system studied. Even though some of the characteristics are applied in this thesis, VR is a particular technology and could have other factors influencing trust. Unfortunately, there is a lack of literature regarding trust in VR, therefore one of the steps taken in this project was to develop a framework to investigate the factors influencing trust in VR. After a review on the literature on trust in technology and on VR, the factors taken into consideration are: technology acceptance, since it has been seen already related to trust in technology (see section 2.4.3 and 2.6.5), presence, because of its importance in the VR field and usability, since it was already theorised by other authors that usability could be a determinant of trust (e.g. Lippert and Swiercz, 2005). The next sections will explain the factors in detail.
2.4 Technology acceptance. This section will describe the first factor taken into consideration: technology acceptance. This factor has already been seen as related to trust in various studies (Gefen, Karahanna and Straub, 2003; Wu et al., 2011; Hernández-
33
Ortega, 2011) demonstrating its importance in the development of trust. Moreover, some of the attributes of technology acceptance are very closely related to some of the dimensions of trust, as will be demonstrated in this section. The next sub-sections will describe the concept of technology acceptance, its main model, the Technology Acceptance Model (TAM) (Davis, 1985) the application of technology acceptance in the literature and studies on its relationship with trust. 2.4.1
The technology acceptance model
Technology acceptance has been described in the work of Davis (1985) in which the author developed the Technology Acceptance Model (TAM). Technology acceptance is fundamental in the process of implementation of a new system, since it has been seen to explain 40% of the users’ intention to use the system (Venkatesh and Davis, 2000). The technology acceptance model was built with two main aims: (1) to understand the process of acceptance of a technology and (2) to implement a new user acceptance test. According to Davis (1985) there are two main factors composing technology acceptance: perceived usefulness and perceived ease of use. Perceived usefulness is defined as the user belief that the technology will enhance their performance. Perceived ease of use refers to the belief that the use of the technology will be effortless (Davis, 1985). Between the two factors, perceived usefulness has been seen as the most important and to have the highest impact on the intention to use the system. In fact, in the Venkatesh and Davis (2000) enhanced TAM, called TAM2, other than adding new factors, ease of use was placed also as a factor of perceived usefulness. The TAM is still the central model influencing the intention to use. However, some other factors have been added to the original model. These are listed below. •
Subjective Norms: defined as: “person's perception that most people who are important to him think he should or should not perform the behaviour
34
in question.” (Fishbein & Ajzen, 1975, p. 302, cited in Venkatesh and Davis, 2000). There are still questions about whether this factor is significant in the landscape of TAM, since some researchers found it statistically significant and others did not (Mathieson, 1991; Taylor & Todd, 1995). •
Voluntariness and social compliance: it has been found that subjective norm is a significant factor in the mandatory situations but not in the voluntary ones (Hartwick & Barki, 1994). So, voluntariness is a variable that mediates the subjective norm influence. Thus, the authors hypothesize that subjective norms will have a positive effect on the intention to use the technology when this is mandatory.
•
Image: Kelman (1958) argued that people can behave in a certain way to maintain a positive image within a group. Consequently, subjective norms influence image, and image influences the perceived usefulness.
•
Cognitive processes: the cognitive processes described in the article are: job relevance, output quality, demonstrable results, and perceived ease of use.
o Job relevance: the degree to which a person perceives that the system he has to use is linked to the job he is doing. Defined as a cognitive judgement that exerts a direct influence on perceived usefulness. o Output quality: how well a system performs a task. o Demonstrable results: “tangibility of the results of using the innovation” (Moore & Benbasat, 1991, p. 203). People have more usefulness perception if the covariation between usage and positive results is easy discernible. On the contrary if an innovation produces positive results, but the user has difficulties in seeing them the perception of usefulness will decrease. o Perceived ease of use: is the one described in the previous paragraph. With the new factors the TAM2 is able to explain the 60% of variance of the users’ final usage (Venkatesh and Davis, 2000). Another enhancement of the TAM was performed by Venkatesh and Bala (2008). The new proposed model, called TAM3 considered the factors of 35
perceived ease of use. The model resulted from this, is much more intricate than the original one. Figure 2.7 shows the model as depicted by Venkatesh in his work.
Figure 2.7 Scheme of the TAM3. Source: Venkatesh and Bala, 2008.
The factors added in TAM3 are: •
Computer self-efficacy is the users perceived ability to perform a task via computer
•
Perception of external control refers to the support of the external figures in the company
•
Computer anxiety is the anxiety perceived when using a computer
•
Computer playfulness refers to the spontaneity in using computers
•
Perceived enjoyment refers to the enjoyment the user has while using a computer, regardless of the performance in the task
• 36
Objective usability is the perceived effort required to perform a job.
As can be seen, some of the factors in TAM2 and TAM3 are not relevant to this project, because they refer to the user environment, especially to the user company, which cannot be investigated in this research, since most of the studies will be conducted in a university environment. Therefore, those will not be taken into consideration. Venkatesh and Bala (2008) developed a model grouping all the factors added in the various versions of the TAM. The model is depicted in Figure 2.8.
Figure 2.8 Model of TAM grouping all the factors. Source: Venkatesh and Bala, 2008
2.4.2 Technology acceptance application The TAM has been widely applied in different fields. In a meta-analysis of the TAM application, King and He (2006) explored 88 studies where the TAM was used. There were several fields and studies gathered in four different categories: job-related, office, general (email and telecom) and Internet/ecommerce. The conclusions of the meta-analysis are listed below: •
The measures provided by the TAM are highly reliable and can be applied in various scenarios.
•
There is an influence on the intention of use of some external factors, such as the experience of the users.
•
The influence of perceived usefulness is stronger than the other factors.
•
Students can be used as substitutes for professional users but not as substitutes for general users.
37
•
Task applications and office applications can be studied in the same way.
Other applications of technology acceptance can be found in electronic communication (Straub, Keil and Brenner, 1997), and executive information systems (Rai and Bajwa, 1997). 2.4.3 Technology acceptance and VR As can be assumed from section 2.4.2, whilst technology acceptance has been applied in various scenarios and for several technologies, there is not as much attention on VR applications. Only a few studies applied the TAM with VR technology. For example, Camilleri and Montebello (2011) and Fetscherin and Lattemann (2008) used the TAM to test the acceptance of a virtual world for educational and marketing purposes. However, applying the TAM to virtual world is different to applying it to VR systems. In virtual worlds, the user is often represented by an avatar in an online interaction. Bertrand and Bouchard (2008) applied the TAM to understand the users’ acceptance of VR for clinical use. The authors found that technology acceptance influences the intention to use VR, but only perceived usefulness was found to have a direct influence on the final acceptance, with perceived ease of use being a perceived usefulness predictor (Bertrand and Bouchard, 2008) 2.4.4
Technology acceptance and Trust
The relationship between technology acceptance and trust has been investigated in the literature. Trust has been seen as related to technology acceptance in online purchasing (Gefen, Karahanna and Straub, 2003), online gaming (Wu et al., 2011) and e-banking (Suh and Han, 2003). In a meta-analysis on the relationship between trust and technology acceptance, Wu et al. (2011) found that trust is positively correlated with perceived usefulness, and perceived ease of use, the two main factors of the TAM. Interestingly, the authors also found correlation between trust and attitude toward a technology and behaviour intention and stated that trust, alone, is fundamental for the final adoption and use of a technology. Hernández-Ortega (2011) investigated technology acceptance as a determinant of post-use trust. The author
38
demonstrated that perceived ease of use is one of the factors influencing trust (Hernández-Ortega, 2011). However, the studies considered in the Wu et al. (2011) meta-analysis, and the aims of the review itself are different from those of this research. The aim of the meta-analysis was to analyse trust as a factor of the TAM. The work conducted for this PhD aims at demonstrating the opposite. Moreover, none of the studies analysed was using VR systems. 2.4.5 Why technology acceptance? As seen in the last section, the TAM is a well-established model in the literature and has been seen as a good predictor for the final use of a technology. The decision to include technology acceptance as a possible factor of trust was taken for three main reasons, two from previous studies and definitions of the factors, and one from a conceptual point of view: •
Technology acceptance and trust has already been seen to be relevant in various studies. As explained in the last section, both trust and technology acceptance are seen as fundamental for the final use of the technology and were found related in various studies.
•
Perceived usefulness could be closely related to the dimensions of trust. The concept of perceived usefulness, the most important in the construction of technology acceptance, has a very similar definition of functionality, that is one of the dimensions of trust. In fact, perceived usefulness refers to the perception that the system will enhance the performance and functionality refers to the belief that the system will be useful to perform a task.
•
On a conceptual view, it is fair to assume that if a user trusts a technology, they will probably accept it and use it. But it is equally fair to assume that if users accept a technology, they will probably trust it and use it.
For these three reasons, technology acceptance was the first factor included in the framework to investigate the factors influencing trust in VR.
39
2.5 Presence The choice of presence as a potential factor influencing trust in VR was due to the importance this concept has in the VR field. In fact, presence is one of the most studied and important factors in VR (Slater and Wilbur, 1997; Witmer and Singer, 1998). However, there is a gap in the literature relating presence to other factors, therefore the theorised relationship with trust is a relatively new line of research. Even considering the number of studies conducted to understand presence, there is still controversy on the most important parts of this concept, such as the definition, the characteristics and the best way to measure it. This section will describe the attributes of presence, starting from the terminology and definitions, investigating the determinants and the measures and, finally, understanding its potential relation with trust. 2.5.1 Terminology Before explaining the debate on the definition of presence, it is important to cast away some doubts on the term “presence”. In fact, the original definition, is not actually related to Virtual Reality, since the term presence refers to the perception of an environment by the users (Steuer, 1992). In real life, presence could be taken for granted. A person in an environment will perceive that environment and feel present in that environment. However, this cannot be said when the environment is shown to the person using a medium such as a VR system. In this case, will the person feel present in the real environment or the displayed environment? Minsky (1980) tried to avoid misunderstanding between presence in real life and presence in mediated environment coining the term “telepresence”. At the beginning, telepresence was used for teleoperators and it has since been applied to VR. To avoid confusion, in this thesis, the term presence will be used, in line with the most recent literature, but it will refer to the definition of telepresence, thus it will always take into consideration a mediated environment.
40
2.5.2 Definitions One of the most used definitions of presence is the sensation of being in a place, while situated in another (Witmer and Singer, 1998). This means that if a VE induces enough presence, the users will believe that they actually are in the VE instead of the “real” one. Other definitions can be found in the literature. Draper, Kaber and Usher (1998) gave three definitions of presence (“telepresence” in their work): the simple telepresence, the cybernetic telepresence and the experiential telepresence. The simple definition of telepresence is the use of a computer-mediated environment. The cybernetic definition refers to the capability of a technology to replicate a real-world scenario and the experiential telepresence is a psychological state, which permit people to perceive themselves in a remote environment. The main difference between cybernetic and experiential telepresence is, as the authors stated in their paper: “cybernetic telepresence is the projection of human capability into a computer-mediated environment; experiential telepresence is the projection of human consciousness into a computer-mediated environment” (p. 356). As can be assumed, the experiential definition is the closest to the “sensation of being there”. The experiential definition is believed to be the most important among the three by the authors. Another expansion of the definition of presence was given by Slater (2009). The author divided the concept of presence into two orthogonal concepts called PI and PSI. PI correspond to the sensation of being there. That is the classic definition. PSI is the illusion that what it is happening in the virtual world, is actually happening. There are different factors influencing the two concepts. These will be discussed in the next section. As can be seen, the definition of presence is not unique, even if most of the authors agree that “the sensation of being there” defines all (Steuer, 1992; Witmer and Singer, 1998) or part (Draper, Kuber and Usher, 1998; Slater 2009) of presence. However, it can be deducted from all the definitions that presence is, at least in part, a psychological factor. In fact, in all the definitions, terms that are usually referred to the individual are used (e.g. “sensation”, “illusion”,
41
“consciousness”). Being a psychological and individual concept, are the determinants of presence also individual? Or are they triggered by the technology? 2.5.3 Determinants of presence As for the definition, the determinants of presence are also not commonly agreed by all the authors (Lessiter et al., 2001). As Lessiter and colleagues (2001) explained in their work, there are two main categories of determinants: user characteristics and media characteristics. As the names suggest, the user characteristics are individual attributes influencing presence and media characteristics
belong
to
the
technology
itself.
Moreover,
media
characteristics are divided into media form and media content, the first one referring to the actual attribute of the system and the second to the content of the VR environment. Figure 2.9 clarifies the Lessiter and colleagues’ (2001) model of the determinants of presence.
Figure 2.9 Determinants of presence following Lessiter et al. (2001) work.
One of the most commonly mentioned determinants of presence is immersion. However, even though it is commonly associated with presence,
42
there is no agreement among researchers on the nature of immersion. Some authors treat immersion as an individual factor (Witmer and Singer, 1998) and others treat it as a system characteristic (Slater and Wilbur, 1997). Witmer and Singer (1998) define immersion as a “A psychological state characterized by perceiving oneself to be enveloped by, included in, and interacting with an environment that provides a continuous stream of stimuli and experiences” (p. 227), while Slater and Wilbur (1997) define it as “a description of a technology, and describes the extent to which the computer displays are capable of delivering an inclusive, extensive, surrounding and vivid illusion of reality to the senses of a human participant” (p. 604). However, despite thinking of immersion as an individual attribute, Witmer and Singer (1998) stated that factors which influence immersion are also technological. For example, a system blocking the users’ perception of the real environment would enhance immersion compared to a normal display. Slater and Wilbur (1997), on the other hand, argued that a system is considered immersive if it is: inclusive, thus capable of blocking physical reality, extensive, thus able to involve more senses, surrounding, thus permitting a wide field of view and vivid, thus with a good resolution, fidelity and variety of energy simulated. Slater and Wilbur (1997) think of presence as an “increasing function of immersion”. Witmer and Singer (1998) added another factor influencing presence: involvement. As presence and immersion, involvement is also defined as an individual attribute. Precisely, involvement is a psychological state experienced when an individual is able to focus on a particular set of stimuli. Involvement is, together with immersion, a fundamental characteristic of presence. To make an example of the differences between the concepts of immersion and involvement, a HMD displaying a meaningless environment has high immersion but low involvement. On the contrary, a desktop VR displaying a very engaging scenario has low immersion and high involvement. To make a comparison between the research of Witmer and Singer (1998) and Lessiter et al. (2001), immersion is related to the media form, while involvement is more related to the media content.
43
2.5.4 Importance of presence As can be deducted from the last sections, presence is one of the most important factors of VR and, yet, one of the most controversial. Indeed, there is no agreement on the terminology, the definition and the factors. However, some attributes of presence are recognised by the majority of the authors in this field: •
It is important. Slater and Wilbur (1997) gave two main reasons why presence should be studied: because it is the distinctive trait of VR compared to other technologies and because the higher the sense of presence, the higher the possibility for the users to behave in the same way in the virtual environment as they do in real life. This could be particularly important in training or job-related applications of VR.
•
It is multidimensional. Presence is both a user and technology characteristic (Lessiter et al., 2001).
•
It is multifactorial. Being multidimensional, both system and individual characteristics influence presence (Lessiter et al., 2001).
This work does not aim to analyse presence in depth, thus, the studies will not focus to answer the many questions on presence. However, some of the data could improve knowledge of presence and some aspect of it. 2.5.5
Presence and trust
The relationship between presence and trust was mentioned in section 2.2.4. However, most of studies where the relationship between presence and trust was investigated, referred to trust in VEs and trust in virtual actors inside the VEs. For example, some studies investigated the role of social presence in trust in virtual world (Teoh and Cyril, 2008; Shin and Shin, 2011). Even though these types of trust are different from trust in the actual systems, they can influence the users’ perceived trust. 2.5.6 Why Presence? As mentioned in the introduction of this chapter, the choice of investigating the relationship between presence and trust is relatively new in the literature, 44
therefore, the reasons for considering presence are not related to previous studies but refers to its importance for the success of VR products (Slater and Wilbur, 1997). However, as described in section 2.2.4, the design of a VE can strongly influence the users experience and trust (e.g. the uncanny valley, manipulation of plausibility and the VE coherence). Furthermore, it can be assumed that if the sense of presence enhances the sensation of being in a real environment and make the individuals behave like they would do in the real world (Slater, 2009), it can influence the trust people have in the system.
2.6 Usability Usability is a well-studied concept in Human Computer Interaction (HCI) and Human Factors and its evaluation is useful to understand the users’ needs and whether the technology satisfies those needs (Bevan, 2009). The choice of usability was made following studies in the literature on the relationship between usability and trust (Roy, Dewitt and Aubert, 2001; Bevan, 2009) and the fact that usability was included as a factor on trust in some previous studies (Lippert and Swiercz, 2005) 2.6.1 Definition The definition of usability has seen a development through the years. In 1991, Bevan, Kirakowsky and Maissel gave a series of definitions depending on the meaning authors attributed to usability. There are four views: productoriented, user-oriented, user performance-oriented and contextuallyoriented. In the product-oriented definition, the focus is on the ergonomics characteristics of the product. User-oriented refers to user characteristics, such as mental effort. User performance-oriented is focused on the interaction between user and product, with attributes such as ease of use and acceptability. The contextually-oriented definition complements all the previous ones and states that usability depends on the specific contexts, users, tasks and environments in which it is being measured (Bevan, Kirakowsky and Maissel, 1991).
45
However, few definitions refer to only one of the above orientations, most of them are actually a product of more of them, or focus on a particular aspect. For example, one of the first, the International Organization for Standardization (ISO) definition is: “set of attributes of software which bear on the effort needed for use and on the individual assessment of such use” (ISO, 1991 in Bevan, 2009) that is both product and user-oriented. Eason, 1998 (in Bevan, 1991) defined usability as “the degree to which users are able to use the system with the skills, knowledge, stereotypes and experience they can bring to bear” (p. 20) that is ease-of-use oriented. Brooke et al. 1990 define usability as: “the effectiveness, efficiency and satisfaction with which specified users can achieve specified goals in a particular environment” that is user and context-oriented. However, one of the most inclusive definitions of usability was given by Bevan and colleagues in 1991, defining usability as “the ease of use and acceptability of a system or product for a particular class of users carrying out specific tasks in a specific environment; where ‘ease of use’ affects user performance and satisfaction, and ‘acceptability’ affects whether or not the product is used” (p. 652). In the ISO/IEC CD 25010.3, usability is described as a characteristic of quality in use, defined as the user perspective of the quality of a product (Bevan, 1999), together with safety and flexibility (Bevan, 2009). Figure 2.10 summarises the various characteristics of quality in use.
46
Quality in Use Usability
Flexibility
Safety
Efficacy
Effectiveness
Satisfaction Figure 2.10 Model of quality in use
2.6.2 Dimension of usability The dimensions of usability are well determined in the Brooke et al. (1990) definition: efficiency, effectiveness and satisfaction. Efficiency refers to the capability of the user to solve a task using the system; effectiveness refers to the effort the users have to invest in performing the task, and satisfaction refers to the perceived comfort in using the system (ISO 9241-11, 1998, in Bevan, 2009). However, the definition of satisfaction was expanded in ISO/IEC CD 25010.3. In fact, as Hassenzahl (2001) pointed out, the former satisfaction definition (and measure) related more to the efficiency and effectiveness of the system. Therefore, the new definition of satisfaction includes, not only the “pragmatic” attribute of the user experience, which is already included in efficiency and effectiveness, but also the hedonic user goals. Thus, Bevan (2009) gave a series of attributes of satisfaction. The pragmatic goals are likability, (the level of satisfaction the user has for the performance of pragmatic goals) and trust (the ability of the system to behave as expected) (ISO/IEC CD 25010.3 in Bevan, 2009). The hedonic goals are stimulation, 47
referring to the increase of knowledge and skills, identification, referring to self-expression, evocation, referring to self-maintenance (Hassenzahl, 2001), pleasure, that is the degree of satisfaction of the user of the hedonic goals and comfort, that is the physical satisfaction (Bevan, 2009). 2.6.3 Determinants of usability. Bevan (2001) gave two main determinants of usability: ease of use and acceptability. Ease of use determines if a system is actually usable and acceptability determines if the system will actually be used. The ease of use is determined by systems attribute such as interface quality, nature of functionality, system efficiency and reliability. Figure 2.11 depicts the model in Bevan (1991).
Figure 2.11 Determinants of usability. Source: Bevan, 1991
2.6.4 Application of usability The applications of usability are spread in all fields of human computer interaction. Among the fields where usability is measured are websites (e.g. Palmer 2002; Brinck and Hoffer 2002) and mobile applications (e.g. Zhang and 48
Adipat, 2005; Kaikkonen et al., 2005), but usability is investigated in several sectors, including the building industries (e.g. Alexander, 2006), automotive (e.g. Green, 1999), and aviation (e.g. Kaber, Riley and Tan, 2002). Usability has also been measured in VR systems with different purposes, such as education (e.g. Virvou and Katsionis, 2008), medic rehabilitation (e.g. Cameirão et al., 2010), navigation (e.g. Santos et al., 2009) and training (e.g. Borsci et al., 2016). 2.6.5 Usability and Trust Roy, Dewitt and Aubert (2001) investigated the relationship between usability and trust in web retailers. The authors found a strong influence of usability of web interface on the perceived trustworthiness of the supplier. However, this study differs from the aim of this thesis for two main reasons: the first is that the authors investigated a different type of trust, that is trust in a supplier, which is more similar to trust in people than to trust in technology. The second reason is that the researchers used a web page, which is very different from a VR system due to the other types of factors that may influence the relationship (such as presence). 2.6.6 Why usability? However, there are many reasons why, in this thesis, it is theorised that usability may influence trust. First of all, Lippert and Swiercz (2005) included system usability as one of the possible determinants of trust. Secondly, some of the dimension of usability can easily be considered as dimensions of trust. For example, as written in the previous paragraph: “The ease of use is determined by systems attribute such as interface quality, nature of functionality, system efficiency and reliability”. It is important to note that functionality and reliability are actually two dimensions of trust in technology (McKnight et al., 2011) as explained in the previous section of this chapter. Bevan (2009) included trust as one of the possible dimensions of usability, mainly regarding satisfaction. However, this is a different type of trust, strongly
49
related to privacy (mostly data security) and, thus, not applicable to VR systems studied in this project. This work is, therefore, pioneering in the investigation of the relationship between usability and trust in VR systems. Usability is the last factor theorised to have an influence on trust.
2.7 Chapter Conclusion Trust is a fundamental factor in the interaction between the users and the technology. However, even if trust has been investigated for some types of systems, such as e-commerce (Ba, Whinston and Zhang, 1999), e-market and online retailers (Gefen, Karahanna and Straub, 2003), there is a lack of literature concerning VR systems. Therefore, a framework has been developed, which aims to investigate the determinants of trust in VR. The framework theorises that there are three main factors influencing trust: technology acceptance, presence and usability. Technology acceptance is a well-known concept in human computer interaction and, as trust, has been seen related to intention to use a system (Davis, 1985). Even if some studies investigated the relationship between technology acceptance and trust (Hernández-Ortega, 2011; Wu et al., 2011), most of them focused on the influence trust has on technology and not the contrary. Moreover, some of the dimensions of technology acceptance, such as perceived usefulness, are very similar to some dimensions of trust, such as functionality. The second factor is presence. Presence is an omnipresent factor in the VR field and, even though there is no agreement on some of its characteristics, it has been deeply studied (Witmer and Singer, 1998; Slater and Wilbur, 1997). Unfortunately, there is a lack of research regarding the relationship between presence and trust. Some authors investigated how presence can enhance trust in virtual worlds (Teoh and Cyril, 2008; Shin and Shin, 2011) and how changes in the VE influence users trust behaviour (Pan and Steed, 2017). Furthermore, conceptually, it can be assumed that if the users are able to
50
behave in the virtual environment as they do in the real world, this can enhance the perceived trust in the system to be functional for the task to be performed. The third factor is usability. Usability is one of the most studied concepts in human computer interaction and it is considered one of the most important influencers of the actual use of a system (Bevan, 2009). However, even if some studies analysed the relationship between usability and trust (Roy, Dewitt and Aubert, 2001), most of them are focused on trust connected to perception of privacy and security, due to the fact that most of the usability studies have web-based technologies as the object of study (e.g. e-market, web retailers). Nonetheless, trust is considered an important part of satisfaction that is one of the dimension of usability and efficiency and effectiveness, which are two technological dimensions of usability, can be seen to be related to functionality and reliability, which are two dimensions of trust. It is important to note that apart from presence, some dimensions of usability, technology acceptance and trust are very similar. Consequently, it can be assumed that there will be a strong correlation among these three concepts and some indirect relationships can be found among them. The next chapters describe the experiments conducted to validate the model.
51
Chapter 3 – Research method and pilot study 3.1 Chapter Overview This chapter first gives an overview of the measures used in the PhD research, then describes the first experiment designed to validate the framework described in chapter 2. The study was conducted at the Jaguar Land Rover CAVE and had three main aims: first to understand if the questionnaires selected after the literature review were suitable to be used with VR systems, second to have the first set of data on the relationship between usability, technology acceptance, presence and trust in VR and, finally, to identify possible methodological problems before progressing with larger studies. The experiment was designed as a between-subjects study and involved 19 JLR staff members. The results of the study demonstrated the reliability of the questionnaire to be used for VR systems and showed that there is a relationship between technology acceptance and usability with trust. No significant relationship was found between presence and trust.
3.2 Measures During the PhD research, several questionnaires were used to assess the level of each factor studied. As a rule, only previously validated questionnaires were used, in order to be certain that no measurement issues could influence the results. However, most of the questionnaires used had limited previous use in VR. Thus, reliability analyses were included in the pilot study. In addition to questionnaires, physiological measures were used in one of the experiments. The following paragraphs describe the measures used for each factor. 52
3.2.1 Trust and Pre-interaction trust Regarding trust, a questionnaire on trust in technology was used for all the experiments. The questionnaire (see appendix A1.4 for the questionnaire on trust and A1.6 for the questionnaire on pre-interaction trust) was developed by McKnight et al. (2011) and aimed at investigating trust in a specific technology. This questionnaire, however, is not specific for VR systems. Indeed, in the questionnaire that can be found in the appendix of the McKnight et al. (2011) paper, the subject is a software program. Therefore, the name of the program was changed to “VR products” when the subject was general or to the specific VR system (e.g. “The CAVE” or “The system”) when the subject was specific. The questionnaire was divided in two, one part was given to the participants before the actual interaction with the system and the second was given after the interaction. This was decided because of the nature of the factors investigated. The questions investigating propensity to trust and institutionbased trust were used as pre-interaction questionnaires, while the questions on trust in a specific technology were given after the interaction. This is because the first set of questions investigate trust in general technology or in VR systems in general and refer to the opinion of the user before the actual use of the specific system. The second set of questions, on the other hand, refer specifically to the system used, therefore the user needed to have an experience of the system before they could answer this. In the desktop-VR and flight Simulator studies (chapter 4), the questions referring to helpfulness, which was not applicable for the nature of the experiment, were not taken into account. 3.2.2 Technology acceptance To measure the level of acceptance of the technology, a mix of two validated questionnaires was used. The first questionnaire, developed by Venkatesh and Davis (2000) is composed of 26 questions, analysing all the factors included in the TAM2 described in the previous chapter (intention to use, perceived
53
usefulness, perceived ease of use, subjective norm, voluntariness, image, job relevance, output quality and results demonstrability). Ten questions were then added to this questionnaire, taken from a questionnaire used by Hernández-Ortega (2011) concerning the concepts of performance, perceived compatibility and continuity of intention. The entire questionnaire was used in the pilot study. However, after the results of this experiment, the questionnaire was modified and reduced to 19 questions. In particular, the questions on subjective norms, voluntariness, job relevance, output quality and results demonstrability were deleted as they were not applicable to the studies. In fact, the participants of the experiments were recruited from students and staff at the university; hence, the questions regarding the work practice were not applicable. Both the questionnaires (the original version and the modified one) can be found in appendix (A1.1.1 for the entire questionnaire and A1.1.2 for the adapted questionnaire). 3.2.3 Usability To assess the level of usability the System Usability Scale (SUS) was used. The SUS questionnaire was developed by Brooke (1996) as a broad measure that could be used to investigate the level of usability in different context. The questionnaire is widely used (Brooke, 2013) in the HCI field and in industry, especially for its high reliability, its low-cost (the questionnaire was actually made free by the author) and its brevity. The questionnaire is composed of 10 different questions, 5 positive and 5 negative. In this research, the SUS was used as it is without any modification and can be found in the appendix (A1.2). 3.2.4 Presence The issue of measuring presence was discussed in the previous chapter. Unfortunately, there is no agreement on a questionnaire that is able to investigate presence and even on the usefulness of questionnaires at all (Slater, 2004). Therefore, measuring presence in this project was a more challenging task than measuring the other two factors.
54
In the pilot study, the ITC-Sense of presence inventory (Lessiter et al., 2001) was used. The questionnaire is composed of 44 questions divided in two parts. The first part, composed of six questions, refers to the thoughts and feelings of the participants immediately after the interaction, while the second part, composed of 38 questions, refers to the participants’ experiences during the interaction. The questionnaire assesses four different factors, believed to be the determinants of presence: sense of physical space, engagement, ecological validity and negative effects. The authors argued that the questionnaire should not be analysed as a whole, to assess the general presence level, but the four factors should be analysed separately (Lessiter et al., 2001). Due to this characteristic and the length of the questionnaire, the decision to use other measures was made after the pilot study. The questionnaire is included in the appendix (A1.3.1) In order to overcome the issues previously described, another questionnaire was used for the remaining experiments analysing presence. For the virtual boot experiment, described in chapter 5, the Witmer and Singer (1998) Presence Questionnaire (PQ) was used (Appendix 1.3.3). The questionnaire is one of the most known in the field of presence and is composed of 32 questions, analysing four factors: control factors, sensory factors, distraction factors and realism factors. The PQ complete questionnaire was used in the presence experiment, described in chapter 6 while a shorter version composed by 14 questions was used for the boot study (chapter 4) and the final study (chapter 6) (Appendix 1.3.2). In the presence experiment, since it aimed at investigating only the relationship between presence and trust, additional measures were implemented to provide a more complete picture of the level of presence. Indeed, as was argued in the literature chapter and in the first part of this section, it is still uncertain which measures better assess presence. Therefore, another questionnaire was also used: the Slater, Usoh and Steed (1994) (S.U.S.) presence questionnaire composed by 7 questions (Appendix 1.3.4). Moreover, a physiological measure was added. The physiological measure
55
used was the Electro-Dermal Activity (EDA), believed to be one of the most reliable measures (Wiederhold et al., 2001; Meehan et al., 2002). The instrument used to measure physiological activity was the Empatica® E4 wristband. 3.2.5 Cybersickness Cybersickness is a possible side effect of using VR products (Cobb et al., 1999). It was important, both for the project and for ethical reasons, to assess the level of cybersickness of the participants during the interaction with VR systems. Therefore, the Simulation Symptoms Questionnaire (SSQ) (Kennedy et al., 1993) was used (Appendix 1.5). The questionnaire is composed of 16 questions on different types of side effect, such as visual (e.g. blurred vision), physical (e.g. Nausea) and motion (e.g. vertigo). It is important to note that participants were free to interrupt the experiments for any reasons, especially for VR side effects. The participants suffering from cybersickness were attended by the researcher until they were confident the symptoms subsided.
3.3 Data analysis In the experiments described in the following chapters four statistics were used. In order to perform analyses on these statistics, assumptions have to be respected. This section will give details on the assumptions that were investigated prior to performing the main statistical analyses. In the study chapters, the assumptions will not be mentioned unless one or more of them were violated. In this case, the method to modify the data will be described. All the statistics were performed using IBM® SPSS 24. The Laerd® Statistics website2 was used as a reference for the data analysis process. 3.3.1 3.3.1.1
Regressions Single regressions
For single regressions four main assumptions were investigated. The assumption of linearity between the dependent and independent variables, 2
https://statistics.laerd.com/premium/index.php
56
was assessed through a visual inspection of an independent variable/ dependent variable scatter-dot plot. The second assumption is the one of homoscedasticity, which states that the variance of residuals is constant across all the values of the independent variable. This assumption was assessed through a visual inspection of standardized residual values versus standardized predicted values scatter-dot plot. The third assumption was the absence of outliers. The presence of outliers was checked with a casewise diagnostic statistic, which identified all the cases where the standardized residual was greater than +/- 3. In case one or more outliers were present, a comparison between the regression with and without the outlier(s) was made and only if the outlier was uninfluential the case was included in the analysis. On the contrary, the case was eliminated from the regression. The last assumption was the normal distribution of residual. This was checked through visual inspection of an Instagram of standardised residual and a Normal P-P plot. 3.3.1.2
Multiple regressions
For multiple regressions five assumptions were investigated. The assumptions of linearity, homoscedasticity and normality have already been explained in the previous paragraph and were assessed in the same way for multiple regressions. The only difference is that the assumption of linearity was checked between the dependent variable and each of the independent variable and collectively through a scatter-dot plot of studentised residual vs unstandardized predicted values. Another assumption of multiple regression was the absence of multicollinearity. In other words, the independent variables should not be highly correlated. The assumption was assessed with the tolerance value. A tolerance value higher 0.1 was accepted as absence of collinearity. The fifth assumption was the absence of outliers, high leverage points and high influential points. The outliers were assessed using the casewise diagnostic method (described in the last section, section 3.3.1.1). High leverage points were assessed with an inspection of the leverage values. Any leverage value higher than 0.3 required more investigation and a value higher than 0.5 was considered as “dangerous”. Influential points were investigated with an inspection of the Cook’s distance values. Any value higher 57
than 1 was considered highly influential. In case of outliers, high leverage or high influential points, the multiple regression was performed with and without these values and then compared. If the results substantially differed (e.g. different significance) the cases were eliminated. 3.3.2
Differences between groups
Two statistics were used to investigate differences between groups, paired sample t-tests and a three-way repeated measure ANOVA. The two tests have the same two assumptions. The assumptions were the absence of outliers and the normality of the distribution of the difference in the dependent variable(s). The first assumption was checked through a visual inspection of box-plots, while the second was assessed with the Shapiro-Wilk test of normality.
3.4 Pilot Study: Introduction The study reported in this chapter was designed as a pilot study, to understand on one hand if the theorised model has some confirmation in data and, on the other hand, to understand the best procedure and measures to be used for following studies. One of the potential methodological issues that could have arisen was the measurement. In fact, as stated in the previous paragraphs, the analysis of usability and technology acceptance in VR is limited in prior research; therefore, it is useful to understand if the commonly used measures of these factors can be applied to VR. The study was approved by the University of Nottingham Faculty of Engineering Ethics Committee.
3.5 Hypothesis H1: The linear regressions between each factor and trust is significative. The main aim of the study was to have a first set of data on the relationship between the three factors described in the framework and trust in VR. H1 hypothesized that the relationship exists.
58
H2: The questionnaires are reliable to be used for VR systems. As stated in the previous paragraph, apart from the presence questionnaire, the questionnaire of usability, technology acceptance and trust have limited use in VR. Therefore, it was important to understand if these measures are reliable for this type of system. H3: There is an effect of pre-interaction trust on the final trust. A secondary aim of this study was to gather data on the effect of users’ characteristics on the model theorised. H3 hypothesised that pre-interaction trust has a significative relationship with trust when considered alone as independent variable and when considered in the model with usability, presence and technology acceptance.
3.6 Method 3.6.1 Participants A total of twenty-one participants were recruited among the staff at JLR. Recruitment was carried out by one of the PhD supervisors (Mr. Brian Waterfield) who had access to the recruitment process used by the firm. All the participants were made aware that participation in the study was voluntary, without any type of repercussion if they refused to take part. In addition, certain characteristics which have been seen to increase the possibility of cybersickness symptoms (e.g. suffer from: migraine, epilepsy or being pregnant) were listed as exclusion criteria. Successively, two participants were excluded from the study because they were under-aged (younger than 18 years old). Therefore, the data presented here refers to 19 participants (Mean age= 30.21, SD=13.67; 13 Males) who completed the study. 3.6.2 Materials 3.6.2.1 VR The participants interacted with the JLR CAVE. The JLR CAVE projects images in four different walls (left, right, front and ceiling) with eight 4K Sony projectors (SRX-t105) (two per wall). The CAVE is powered by 16 computers (4 59
per screen) each with dual core CPU (Intel Xeon ES-2690). In order to see a 3D version of the model, the participant wore a pair of tracked glasses. The tracking permitted the model to adjust to the position of the participant’s head, ensuring that the model (and occlusion effects) matched the participant’s perspective. This was particularly important for realism, because the perspective of the object would feel less artificial, and for cybersickness, since the movement in the virtual environment was the same as the participants’ head, avoiding contrast of senses, one of the possible cause of cybersickness (LaViola Jr, 2000). The controller used was a joystick. The joystick was tracked, thus the participants had to move it in order to move the pointer on the screen. An example of the CAVE is showed in Figure 3.1.
Figure 3.1 Example of a car model displayed in the JLR CAVE
3.6.2.2 Questionnaires The questionnaires were divided into pre-interaction questionnaires (given before the interaction with the VR system) and post-interaction questionnaires (given after the interaction questionnaire). Pre-interaction questionnaires: Demographic Questionnaire (Appendix 1.6):
60
A demographic questionnaire was built to gather information about the participants. Trust pre-interaction questionnaire (Appendix A1.6). The trust pre-interaction questionnaire was developed to assess users’ trust of general technology and all VR systems. This trust is developed before interaction with the system. Post-Interaction questionnaires ITC-SOPI (Appendix A1.3.1): The ITC-SOPI has been used to assess the level of presence perceived by the participants. SUS (Appendix A1.2): The SUS has been seen as a useful tool to assess people’s perceived usability. Technology Acceptance Questionnaire (Appendix A1.1.1) The technology acceptance questionnaire has been used in the literature to understand the level of technology acceptance of the users. Trust in Technology measure (Appendix A1.4) The questionnaire has been used to assess the level of users’ trust in the specific system. Other questionnaires SSQ (Appendix A1.5): The SSQ has been used to monitor the participants’ cybersickness symptoms and was given to the participants at the end of each task. 3.6.3 Tasks The participants had to perform six assembly and disassembly tasks on a car model already loaded into the CAVE. 61
3.6.3.1 Task 1 The first task consisted in the rotation of the car model at 90 degrees. To perform the task, the participant had to access the main menu, select the submenu “navigate”, select “rotate world”, and rotate the joystick at 90 degrees. Figure 3.2 shows the completed task.
Figure 3.2. Representation of the first task: "Rotate the car at 90 degrees"
3.6.3.2 Task 2 The second task consisted of zooming in to the car until the participant was “inside” the model. To perform the task, the participant had to access the main menu, select the sub-menu “navigate”, select “fly” and then move the controller toward the screen. The completed task is shown in Figure 3.3.
62
Figure 3.3 Representation of the second task: "Zoom the car using the fly menu"
3.6.3.3 Task 3 The third task consisted of moving the front bumper of the car and then reset the position of the bumper. To perform the task the participants had to access the main menu, select the sub-menu “edit”, select “work”, select the front bumper and move it from its position. To reset the position, they then had to select the bumper, access the main menu and select “reset” (Figure 3.4).
Figure 3.4 Representation of the third task: "Move the front part of the car and reset the position"
63
3.6.3.4 Task 4 The forth task consisted of measuring the size of the car logo. To perform the task, the participant had to access the main menu, select the sub-menu “eval”, select “measure”, select pick point, and then select the beginning and end of the front logo. Figure 3.5 depicts the performed task.
Figure 3.5 Representation of the fourth task: "Measure the car's logo"
3.6.3.5 Task 5 The fifth task consisted of “cutting” the car until both of the front wheels disappeared. To perform the task the participant had to access the main menu, select the sub-menu “eval”, select “cut” and select “cutplane” at this point a square would appear in the environment. Then, the participant had to exit all
64
the menus and access the main menu again, select “edit” select “work” and, selecting the square, move the controller toward the screen (see Figure 3.6).
Figure 3.6 Representation of the fifth task: "Cut the car until the front wheels disappear"
3.6.3.6 Task 6 The last task consisted of taking a snapshot. To perform the task the participant had to access the main menu, select the sub menu “doc”, select “snap state” by moving the head to centre the frame and then take the snapshot (see Figure 3.7).
Figure 3.7 Representation of the sixth task: "Take a snapshot of the car logo"
65
3.6.4 Procedure The entire procedure lasted approximately 45 minutes. The participants were invited into the room and asked to read the information sheet and complete the consent form. The participants were informed both through the information sheet and by the researcher of the possible side effects of using VR systems. If the participants decided to take part in the study, the preinteraction questionnaires
were
given.
After they
completed the
questionnaires, a trial phase started. In the trial phase, the researcher first explained the main features of the CAVE and the controller buttons. Then, the participants watched an explanatory video on a laptop for each task and perform the task straight away inside the CAVE. In the trial phase, the participants could ask questions and help to complete the task to the researcher. After the trial, the participants started the experiment. The participant had to perform the task within 3 minutes in the same order they performed it during the trial. The participant was interrupted after every two tasks to complete the SSQ. The participant had to verbally confirm when and if they thought the task was completed. If the participants did not complete the task in time, the task would be considered failed. In the experimental phase, no help was given to the participants. After the interaction, the participants were invited to complete the post interaction questionnaires. The maximum exposition time to VR was 18 minutes. 3.6.5 Data analysis In order to understand the nature of the sample, frequencies were performed with the data from the demographic questionnaire and the SSQ. To investigate the reliability of the questionnaire used, a reliability analysis was performed for all the questionnaires used. To understand the relationship between the three factors and trust, four regression analysis were performed. Three with each factor as independent variable and trust as dependent variable and a regression analysis with all the factors as independent variables and trust as dependent variable.
66
Finally, to assess the influence of pre-interaction trust factors on the post-use trust, a regression was performed with pre-interaction trust as independent variable and trust as dependent variable and, in case of a significant result, a regression was performed with technology acceptance, usability, presence and pre-interaction trust as independent variables and trust as independent variable. This last regression aimed at investigating the influence of preinteraction trust on the model.
3.7 Results 3.7.1 Demographic Table 3.1 shows the frequencies of the demographic questionnaire data.
67
Frequencies Number Percentage Male
13
68.4%
Female
6
31.6%
Not at all
10
58.8%
6
35.3%
Moderately
1
5.9%
Very much so
0
0%
0
0%
0
0%
2
10.5%
6
31.6%
6
31.6%
4
21.1%
Sex
Propensity to motion sickness Slightly
I have never heard of Virtual Reality I have heard of it but do not know what it is I have some idea of what VR is VR Experience
I know what Virtual Reality but have never seen or used it I have seen a Virtual Reality system in use I have used a Virtual Reality system once or twice
68
I have often used Virtual Reality I use Virtual Reality almost every day
0
0%
1
5.3%
Table 3.1 Demographic frequencies.
In order to have a visual representation of the four factors measured, four plots were created, one for each measure (see figures Figure 3.8-Figure 3.11).
SUS 100 90 80 70
SUS
60 50 40 30 20 10 0 1
2
3
4
5
6
7
8
9
10 11 12 13 14 15 16 17 18 19
Participants Figure 3.8 Scatter-dot plot of the responses to the SUS questionnaire
69
Technology acceptance Technology acceptance
7 6 5 4 3 2 1 1
2
3
4
5
6
7
8
9
10 11 12 13 14 15 16 17 18 19
Participants Figure 3.9 Scatter-dot plot of the responses to the technology acceptance questionnaire.
ITC-SOPI 5
ITC-SOPI
4 3 2 1 1
2
3
4
5
6
7
8
9
10 11 12 13 14 15 16 17 18 19
Participants Figure 3.10 Scatter-dot plot of the responses to the ITQ-SOPI questionnaire.
70
Trust 7 6
Trust
5 4 3 2 1 1
2
3
4
5
6
7
8
9
10 11 12 13 14 15 16 17 18 19
Participants Figure 3.11 Scatter-dot plot of the responses to the trust questionnaire.
Analysing the SUS and trust there is the possibility of an outlier. This possibility will be investigated further in the regression analyses. Figure 3.12 shows the levels of cybersickness as measured with the SSQ after every two tasks.
Levels of cybersickness 4 3.5 3 2.5 2 1.5 1.07
1.13
1.14
SSQ after second task
SSQ after fourth task
SSQ after sixth task
1
Figure 3.12 Levels of cybersickness as measured with the SSQ (1=none, 2= slightly, 3=Moderate, 4=Severe).
As can be seen from the graph, the cybersickness perceived by the participants is generally low through all the experiment
71
3.7.2 Reliability Analysis To investigate questionnaire reliability, the Cronbach reliability analysis was performed for each questionnaire, (Santos, 1999). The internal consistency of all the questionnaire was high, as determined by the Cronbach alphas (SUS=.893, Items: 10; Technology acceptance=.905, items: 36; ITC-SOPI=9.28, items: 44; Trust= .941, items: 10). This means that the questionnaires are reliable with VR systems. These results were expected for the ITC-SOPI, in fact, being a presence and immersion questionnaire, it is designed to be used for VR systems. However, the other three questionnaires have limited use in the VR field. 3.7.3 Regressions In order to understand the relationship between the three factors and trust, four regressions were performed. In addition, two regressions were performed to investigate the influence of pre-interaction trust on the final trust. Table 3.2 describes the independent and dependent variables of each regression. Regression Regression
Independent
Dependent
variable
variable
Usability
To investigate the relationship
1 Regression
between usability and trust TAM
To investigate the relationship
2 Regression
Aim
between TAM and trust Presence
To investigate the relationship
3
between Presence and trust
Regression
Usability,
4
Technology acceptance, Presence
Trust To investigate the relationship between the three factors and trust
Regression
Pre-
To investigate the relationship
5
interaction
between pre-interaction trust and
trust
trust
72
Regression
Pre-
6
interaction trust,
To investigate the influence of
Usability,
pre-interaction
technology
complete model.
trust
on
the
acceptance, presence Table 3.2 List of regression performed
3.7.3.1 Usability and Trust The first regression was performed to investigate the relationship between usability and trust. First of all, a scatter-dot plot was created to visually investigate the relationship between the two variables (Figure 3.13).
SUS-Trust 7 6
Trust
5 4 3 2 1 0
20
40
60
80
100
SUS Figure 3.13 Scatter-dot plot of the interaction between SUS and trust.
The regression was significant [F(1,17)= 10.730, p=.004], with usability accounting for 35.6% of trust (Adj. R2 =.356). 3.7.3.2 Technology acceptance and Trust The second regression was performed with technology acceptance as independent variable and trust as dependent variable and was used to investigate the possible relationship between these two factors.
73
A scatter-dot plot was created to investigate the relationship between the two factors (Figure 3.14).
Technology acceptance-Trust 7 6
Trust
5 4 3 2 1 1
2
3
4
5
6
7
Technology acceptance Figure 3.14 Scatter-dot plot of the interaction between technology acceptance and trust.
The regression was significant [F(1,17)= 22.44, p