Trust Management in an Open Computing Environment Junseok Hwang1, Jihyoun Park1,2, Jörn Altmann1,2 1
Technology Management, Economics and Policy Program, Seoul Natioanl University, Korea {junhwang, april3}@snu.ac.kr 2 Computer Networks and Distributed System, International University of Bruchsal, Germany
[email protected]
Abstract. An open computing environment, in which users can trade computing resources without organizational constraints, suffers from uncertainty about the quality of security, the quality of service provided, and the observation of privacy. To overcome this uncertainty, an open computing environment requires trust of the consumer and the service provider. Since trust is a subjective belief of a person about another person, technological solutions cannot be sufficient to resolve trust issues. This paper, instead, suggest to apply economic approaches to addreass uncertainty. These approaches have their orgin in the area of insurance policies and portfolio management. Both economic approaches try to compensate for the inherent uncertainty and, therefore, improve the trustworthiness of an open computing environment. The insurance-based approach performs best in an environment with low uncertainty but becomes unstable as the uncertainty of computing resources increases. The portfolio approach is more suitable to guarantee the system stability when the uncertainty of the environment is large. Keywords: Trust, Risk, Security, Privacy, Service Level Agreement, Decision Support, Grid Computing, Insurance, Portfolio, Simulation
1
Introduction
Current trends in computing environments suggest that users will no longer own an expensive infrastructure. For example, Grid technology allows users to use expensive computing environments at no TCO (Total Cost of Ownership). Grid technology provides an infrastructure for sharing resources in dynamic and multi-institutional virtual organizations [13], enabling an open marketplace, in which hardware resources (i.e. computing power, storage, and bandwidth), software, and data can be traded across administration boundaries. Although this open and autonomous computing environment provides much benefit with respect to resource utilization and system agility [8], the adoption of this technology has been neither quick nor widespread. The reason is the uncertainty about the quality of security, the quality of services (QoS) provided, and the observation of privacy [28]. The uncertainty in the
open Grid computing is caused by tow facts: First, since open Grid computing automatically matches trading partners, a service seller and a service buyer do not necessarily know each other. Second, it is characterized by dynamicity [6], which means that the entry and the exit of market players are free in this environment. Those uncertainties constitute a threat of system failure. Although many technical solutions have been developed for dealing with uncertainty in QoS, privacy, and security, users are still hesitant to participate in this open computing environment. The reason is psychological origin. The problem is a lack of trust, which is defined as a subjective belief about the behavior of another entity in a certain context [1, 14]. In today’s computing environment, they do not have a choice but to trust the resource providers to run their data and software. Therefore, the trustworthiness of an open and autonomous computing environment highly depends on the trust in the behavior of the trading partners. Therefore, technological solutions can never compensate for the lack of trust in an open Grid computing environment. Previous work on online trust mechanisms focused on detecting of information breaches, viruses and transaction errors. However, this work does not consider how to keep users in a virtual community if the users already interpreted the conditions as unacceptable. This study suggests to complement technical solutions with economic-based mechanisms. In the real world, people have dealt with uncertainty by applying microeconomic methods for a long time. Examples are insurance policies and portfolio compositions. Insurances are used for protecting people from unexpected incidents and portfolio compositions are useful for reducing risks in stock investments. This research aims to devise useful applications of these real world solutions for overcoming uncertainties in open computing environments. The basic idea behind these approaches is to distribute and eventually fade out the uncertainty of using open Grid computing. Based on the theory of consumer choice under conditions of uncertainty, two virtual communities are modeled. One is based on an insurance broker model, in which a monopoly broker offers users insurance contracts for the uncertain resources. The other is based on a portfolio investment model, in which users mix the less risky resources and the more risky resources according to their risk attitudes and price. Our agent-based simulation analyzes the effects of both mechanisms and compares them with the alternative of not dealing with uncertainty at all. We show that the proposed economic-based models increase the market size, profit and system reputation. Finally, we investigate how a society should construct the distribution of risk attitudes across a population for each model. The reminder of the paper is organized as follows: In Section 2, previous works about trust are described. Especially, the sociological definition and its applications in computer science are described. Section 3 explains the theoretical microeconomic models of uncertainty and the agent-based simulation methodology that is used in this paper. Section 4 lays out the design of the simulation, which includes the basic assumptions of the computing environment considered and the characteristics of the participants. In addition to this, three different resource brokering strategies are defined. They represent unique mechanisms for enhancing trust. Section 5 discusses the results of the simulation and Section 6 draws conclusions and policy implications.
2
2.1
Background
Trust
Trust is defined as the quantified belief of a trustor with respect to the competence, honesty, security, and dependability of a trustee within a specified context [14]. Detailed trust characteristics are investigated by six properties [1]. Trust can not be measured objectively but is assumed to be a subjective degree of belief, which extends from complete distrust to complete trust. An action based on trust is taken despite uncertainty. A decision based on trust is related to the trustor’s prior experiences and knowledge, which is the reputation of the trustee. Change of trust can dynamically leap without monotonic increase or decrease. Trust is not transitive, so A who trusts B may not trust C who is trusted by B. Most importantly, trust behavior may not follow the rules of rational choice theory as other economic phenomena do. Social scientists have classified trust into three types [1]. First, there is an interpersonal type of trust. This type is constructed through interactions between agents. The second type of trust is a system trust. The system, which an agent belongs to, becomes a kind of certification for the trustworthiness of the agent and determines the level of trust for the agent. The third type is called dispositional trust. Contrary to the other two types of trust, the dispositional trust of an agent is inherent and does not change as a situation changes. Kashyap [18] differentiated trust from fact and belief. In his taxonomy, verifiable artifacts and components are facts. In contrast, non-verifiable things are classified into belief. Belief again categorized into three groups, which are non-evidence based priori belief, past experience based reputation and other justification based rationales. Trust is a combination of those three beliefs. Each of the three beliefs is reflected respectively as a direct, indirect and transitive aspect to trust. Trust classification for computer systems is more practical than that for sociology. Especially five trust features are known to be important for the networked and distributed computing system [14]. Fist, service provision trust is the measurement of system reliability and integrity. Second, resource access trust is the mean of access control and authorization. Third, delegation trust is to entrust one’s own decision making to the system. Forth, certification trust is gained through 3rd party authentication and is used for identity management. Last, context trust tells the level of institutional protection for trust by social or legal systems. This paper tries to address the following subjective questions regarding trust of an open computing environment. (1) Broker: Is a broker trustworthy? Is he certified? (2) Resource capacity: Can a user’s request be rejected due to lack of resources that a broker has? (3) Fair trade: Can the price be higher than the value of job that a user has? (4) Performance: Can a job fail to complete by resource failure? (5) Security breach: Can the result be falsified? Might the critical privacy information or transaction information be revealed? Although it is impossible to calculate the correct value of each category, those can be approximated through assuming a level of uncertainty during the simulation.
2.2
Research on trust in network environments
There have been three major areas in the network trust and security research. The first area is the information security management. Centralized access control such as authentication and authorization is a major theme [7, 11]. In distributed environments, a rights delegation model is proposed [16, 17]. In these works solutions are only technology-oriented and responses to problems are static. Therefore these solutions cannot protect systems from the ever-changing and evolving invaders (i.e. hackers and viruses). Moreover, they cannot cover the psychological aspects of trust. The second area is the system failure management. Because of flaws in technological solutions, a cyber-insurance, which offers monetary compensation for system failures, becomes a preferable solution [9, 19, 24]. The cyber-insurance adopts a two-tier approach that considers failures of information systems to be highly correlated. The two-tier approach divides risk cases into those that are frequently correlated within a firm and cases at a global level. Bohme and Kataria [9] shows that the cyber insurance is best suited for classes of risk with high internal and low global correlation. While internal risk correlation within a firm influences its decision to seek insurance, the global correlation influences insures’ decision in setting the premium. The last area is the transaction security management. As objective mechanisms, cryptography and 3rd party certification methods are used. Those are all centralized control methods. For example, the trusted 3rd party and privacy statement are often utilized for guaranteeing trust of Internet retailers [25]. Institution-based trust management is also one of this group [26]. However, these objective mechanisms have several defects. The control party is not much reliable or the heavy algorithms used for trust management make the overall system slow down [22]. Instead, a reputation system, which depends not on public trust but on peer reviews, is more widely accepted because it improves the efficiency of algorithms. P2P systems represent the field that is operated based on recommendation and reputation. The objective trust technique is one example that allows automatic control of trust in electrical trading with no human interaction [21]. Another example is to use a service selection agent. The agent calculates trustworthiness of a service based on users’ preferences, business policies and QoS and chooses the most appropriate service [23]. In the Grid network, several trust management mechanisms have been proposed using a reputation-based system. As a less computationally intensive method to calculate reputation, an eigen-vector algorithm is suggested [2]. Azzedin and Maheswaran [3, 4] divide trust into identity trust and behavior trust. They focus on the behavior trust by adopting the concept of trust relationship when resources are allocated over the Grid network. Otherwise, the system imposes strict security requests on resources, which causes severe overload. The similar procedure is used for trust management in public resource Grids. Unlike interactions within a bounded network, users do not have a priori trust relationships with public resources. By incorporating the accuracy and honesty concept, the trust model gives incentive to recommenders to tell the truth [5]. This paper proposes a different view from outside the system to enhance the existing trust mechanisms. Although it also uses the reputation-based trust system to calculate the trust score of the system, trust relationship in this paper is not solely determined by systematic measurement of performance. Rather, it interprets trust
using the principles of markets. Even though the purpose of this paper aims to devise an advanced mechanism to ensure a trustworthy open computing environment, it does not explore how to make incentives to control or improve the trustworthiness of the system. This research tries to model the real world where people sometimes venture to participate in uncertain and risky businesses by monetary motivation. Market services such as insurance and portfolios that encourage users to participate in uncertain and risky markets is the key of trust management considered in this paper.
3
Theoretical Model and Methodology
3.1
Monopoly Market
The open computing environment is modeled as a monopoly market in this paper. In this kind of market, a monopoly supplier has the exclusive right of sale [32]. Therefore a monopolist shows a profit maximization behavior. The monopolist’s profit maximization problem is as follows:
max p ( y ) y − c( y ) .
(1)
y
where
p( y ) is the inverse demand function, the revenue of it is
r ( y ) = p ( y ) y and c( y ) is its cost function if it produces y units of output. The optimal output of the monopolist is always smaller than that of the competitive market. Since the marginal revenue curve is given as r ′( y ) = p ( y ) + p′( y ) y and
p′( y ) < 0 , the curve of the marginal revenue always lies under the inverse demand curve. The optimal amount of output is the point where the marginal revenue curve ∗
and the marginal cost curve meet. Given the optimal amount of output, y , the ∗
monopolist charges the price of p ( y ) . From the viewpoint of economic analysis, a monopolist has a unique feature in the pricing scheme. Compared to competitive firms who are price takers, the monopolist is a price maker. That means the amount of output that it is able to sell changes as a function of the price it charges. Also, it can utilize price discrimination if it is more profitable. Price discrimination means selling the same good at different prices to different consumers. In order to establish price discrimination successfully, two constraints are imposed on the monopolist: it should be able to distinguish consumers by some categories and prevent resale of goods. The traditional category of price discrimination consists of first-degree price discrimination, which is known as perfect price discrimination, second-degree price discrimination and third-degree price
discrimination [27]. The first-degree price discrimination charges consumers at the maximum willingness-to-pay for a good. A seller, who uses the first-degree price discrimination strategy, offers each consumer some price and output combination
(r ∗ , x∗ ) where r ∗ is a take-it-or-leave-it price. The profit maximization problem of the monopolist is:
max r − cx r,x
such that u ( x) ≥ r
(2) .
The constraint is bounded at equality as the monopolist wants the largest r . At the optimal level of production given by the first order condition, x ∗ , the take-it-orleave-it prices is:
r ∗ = u ( x∗ ) .
(3)
3.2 Risk Attitude Consumers who face uncertainty, deal with it differently, dependent on their risk attitudes. For example, if a consumer’s expected utility of a lottery, pu ( x) + (1 − p )u ( y ) , where p is the probability of winning the lottery with a win of x, and (1 − p ) is the probability of getting y, is less than the utility of the expected value of the lottery, u ( p o x ⊕ (1 − p ) o y ) , the consumer prefers the money equivalent to the expected value of lottery to the lottery itself. This describes a risk-aversion behavior [32]. Therefore, the definition of risk aversion is:
u ( p o x ⊕ (1 − p) o y ) > pu ( x) + (1 − p)u ( y )
(4)
If a consumer prefers getting the lottery to its expected value, he expresses riskloving behavior. The definition f risk loving is inverse to that of risk aversion. If a consumer is indiscriminate between a lottery and its expected value, he is risk neutral. In this case the inequality turns to the equality.
3.3 Insurance Insurance is a protection mechanism for a person against uncertainty to prevent the loss of wealth. When a loss occurs because of an incident as mentioned in the contract, insurance subscribers will be compensated by the insurer. The insurers set the premium per dollar of coverage in the contract. The problem that is to solve is to determine the amount of coverage that a consumer should purchases [32]:
max pu (W − L − π q + q ) + (1 − p )u (W − π q ) .
(5)
where W is the monetary wealth that the consumer initially has, p is the probability that the consumer loses his wealth, L is the amount of loss by accident, q is the amount of money that the purchased insurance compensates and π is the
πq p =π .
premium per dollar of coverage. In this equation, an insurance subscriber pays to purchase q of insurance coverage. Assuming the actually fair premium,
Inserting this condition into the first-order conditions for the above utility maximization problem, we get:
u′(W − L + (1 − π )q∗ ) = u′(W − π q∗ ) .
(6)
∗
If the consumer is strictly risk averse, then q = L . Given that the consumer cannot alter the probability of loss, there is no moral hazard issue. The insurance company offers the complete insurance against the loss. 3.4 Portfolio Investment Portfolio investment techniques are usually used in the stock market, where the return of investments is uncertain. Investors try to reduce risks by diversifying investments. The basic principle of portfolio investment is to combine high-risk investments, which can bring high returns with low-risk investments that offer lower returns. Risk of an asset is measured by the asset’s standard deviation. As the standard deviation is more dispersed, the asset is riskier. Suppose there are two assets, one with a risky return rk and the other with a sure return rf . a ≥ 0 is the amount of money that is invested in the risky asset. Because rk is uncertain, the total return of this portfolio investment is rp = ark + (1 − a )rf . The utility maximizing investor’s problem is
max U = U (rp , σ p ) s.t. rp = ark + (1 − a )rf , σ p = aσ k .
(7)
Where σp is the standard deviation of the portfolio and σk is the standard deviation of the risky assets. To simplify the problem, we assume a simple two-period portfolio problem and a return rate of zero for the sure asset. The second period wealth can be written as [32]:
r%p = a (1 + rk ) + (1 − a ) = ark + 1 .
(8)
The expected utility from investing a in the risky asset is
v(a) = Eu (ark + 1) .
(9)
The first order condition of the expected utility function derived with respect to a implies that a risk-avert person chooses a positive investment in the risky asset if its expected return is positive. The optimal amount of investment can be calculated from:
Eu ′(ark + 1)rk = 0 .
(10)
It means that the expected marginal utility of wealth equals zero. 3.5
Agent Based Simulation
Agent-based modeling is an area of computer simulation, which is used for analyzing complex systems, emergence, computational sociology, and evolutionary programming. Agent-based models consist of dynamically interacting rule-based agents. Rules are simple. Although those rules do not contain any predetermined or centralized constraints, independent agents decide their next action by applying rules in adaptive and backward-looking ways. Agents only know their own payoff and it is the only basis for their behavior, whereas a centralized control system posts the overall performance of the system and scores of other participants to all the users in the system. An agent-based system can reflect realistically complexity and social phenomena that exist in the real world. Besides, agent interactions can also be used to interpret social and economic phenomena [20]. On some levels, agent-based models complement traditional analytic methods. Whereas analytic methods enable to characterize the equilibria of systems, agentbased models allow exploring the possibility of generating those equilibria. Agentbased models can also explain the emergence of higher order patterns such as network
structures of terrorist organizations and the Internet, power law distributions of the sizes of traffic jams, wars, and stock market crashes, and segregation despite populations of tolerant people. With respect to economic applications, agent-based models are excellent to investigate asymmetric information, imperfect competition, strategic interaction, collective learning and multiple equilibria [30]. For example, Epstein and Axetell [12] used agent-based simulations to develop a Sugarscape model for analyzing how geometrically dispersed people move to the other places, trade goods and establish culture, economies and social classes, in order to obtain scarce resources which are essential for living and production. Macy and Skvorets [33], through agent-based modeling, simulated Max Weber’s theory that protestant sects take a pivotal role to build a cultural background on which unknown parties confirms the trust relationship of their counterparts and can buy and sell goods at a distant market in colonial America.
4
4.1
Simulation Design
Assumptions
The simulation represents an open computing environment, in which a monopoly broker allocates computing resources and monitors users. Resource allocation is performed automatically by the broker. User agents cannot select resources themselves. They have to go through the broker. A decision that a user agent makes is whether or not to participate in the market, i.e. to decide to open an account with the broker based on its risk attitude and the performance of system. The broker offers two additional services, namely an insurance service and an portfolio service, in order to increase the number of customers and maximize his profit. Simulations for each strategy of the broker are conducted repeatedly under three uncertainty conditions of the environment. According to the uncertainty condition, which can be set to safe, dangerous, or fatal, the failure probability of the computing resources is set. User agents respond to each combination of broker strategy and uncertainty condition of the environment, but do not change their behavior pattern. Although in reality there are as many resource providers as resource buyers in the open computing system, we assume only the existence of the monopoly broker and examine the trustworthiness of the broker. The trust category considered in the simulation is delegation trust, one among the five trust categories for the networked and distributed computing system (see section 2.1). The delegation trust is used for estimating the total trust level of the virtual organization. The others are assumed trustworthy inside the trusted virtual organization. Once a user decides to trust a virtual organization; it literately delegates its right for selecting resource to the broker of the virtual organization. Thus the user agent has not to evaluate each and every resource provider’s trustworthiness [10]. At the end of every simulation period, four variables are recorded to analyze how much the two new broker services contributed to the adoption and performance of the
open computing environment. One variable is the total market size, a characteristic of the whole market. Regarding the broker, the profit and the level of reputation are recorded. Lastly, the distribution of users’ risk attitude is logged. The data is also compared with the data of the do-nothing alternative, which does not adopt any social protection mechanism. 4.2
Broker
A broker is an entity, which provides computing resources to users in the open computing environment. As a monopoly provider, the broker purchases resources, receives users’ requests, executes users’ jobs on those resources, and manage the resources. Although it is a profit-maximizing monopolist, it is possible that not all goods will be sold as the broker purchases all the resources before the market opens. Therefore, the market may not be cleared at the end of a simulation period. If there is excess demand or excess supply at the end of a simulation period, the broker adjusts the amount of resources to purchase for the next period. Computing resources are characterized through performance and failure probability. Performance of resources follows a normal distribution, which is chosen because of the randomness of several independent incidents acting additively [15]. A resource is assigned to process one unit of a user job. The required level of performance for one unit of user job is normalized to 1 and the value is chosen to be within one standard deviation distance from the mean. The failure probability of resources is an external factor and distributed uniformly between zero and a value corresponding to the uncertainty condition of the environment. The range of failure probability represents the risk that a user faces. The cost of the broker is defined as its actual payment to the owners of the resources, considering the actual performances of the resources. In case of the donothing alternative and the portfolio service, the broker does not control the performance of resources. Rather, it purchases a bulk of random resources. In case of the insurance service strategy, the broker manages the performance of resources. The reason is the insurance contract, which binds the broker to supply resources until a user’s job is successfully completed. If resources fail too often, the cost for the broker increases. This causes the decrease of the market size and the broker’s profit. The pricing scheme of the broker is based on the first-degree price discrimination. The broker first checks if the willingness-to-pay of a user for the job is greater than the unit cost. If the job is accepted, the monopoly broker extracts the maximum willingness-to-pay of the user. The broker’s profit is total earnings minus total costs. The reputation of the broker is calculated every period based on the number of successful requests. At the beginning of every simulation period, potential users evaluate the broker considering its performance at the previous period. The user agent use the evaluation result to decide whether or not to enter the market. There are five categories of performance that are considered, They are the total market size, missed requests ratio, denied requests ratio, failed requests ratio and breached requests ratio. Detailed descriptions for each category are shown in table 1. Each category is matched with the subjective questions regarding trust of the open computing environment (see section 2.1).
Table 1. Evaluation criteria about the monopoly broker. Variable Market size
Description
The number of market participants. If the market size is smaller than expected, the broker is not trustworthy to this user. Missed requests The ratio of missed requests to total requests. Missed ratio requests are those requests, which the broker missed due to lack of resource capacity. Rejected The ratio of rejected requests to total requests. Rejected requests ratio requests are those requests, which the broker rejected when the willingness-to-pay of the user is less than the cost for the broker. Failed requests The ratio of failed requests to total requests. Failed ratio requests mean that the user’s job could not be finished after using up all the resources the user bought. Breached The ratio of breached requests to total requests. Breached requests ratio requests mean that the result of the user’s job executed on the open computing environment has errors or is manipulated. In this case, security problems are suspected.
4.3
Users
Users are entities, who are in need of computing resources. They have a unique attribute, a certain risk attitude, which is the basis for their decision to use the open computing environment. According to their risk attitude, users can be classified into three groups: risk averse group, risk neutral group and risk loving group. Risk attitude is based on the level of risk tolerance and changed dynamically. Initially, the user is assigned the risk tolerance level, which is normally distributed over the entire population of users. Then at every simulation period, the level increases, when a trade with the broker is successful, and vice versa. So users change their risk attitude during the simulation. In the simulation, the risk tolerance level is used as a weight to set the willingness-to-pay of a user and evaluate the broker’s performance. A user shows a risk averse behavior if the risk tolerance level drops below the one standard deviation from the mean. Risk averse users in average do not prefer risky resources. Risk loving users are defined as being at one standard deviation above the mean. They value the risky resources higher than the potential value of those resources. Users send a job of different lengths to the broker. The job is divided into slices of a certain length and distributed over available computing resources. After a user receives the results of the job, he checks the result. If the result is not successful, the user undergoes the risk management process. Users decrease their risk tolerant level by a certain percent of reverse proportion of itself. The percentage is different for each category of evaluation criteria for the broker provided in table 1.
Initially, risk loving and risk neutral users participate in the open computing market whereas risk avers users do not. From the following period on, additional users only join the market if the missed requests ratio, denied requests ratio, failed requests ratio and breached requests ratio are less than one tenth of their risk tolerant level. Besides, each risk attitude group is assumed to require a certain market size if each group starts to join the market. According to the diffusion theory, the early adopter group for new products represents similar characteristics as the risk loving group of this paper, the early majority group is similar to the risk neutral group and the late majority group is similar to the risk averse group. The diffusion theory also classifies adopters according to the mean and standard deviation of a diffusion curve [29]. According to the theory, the innovator belongs to the first 2.5% of adopters and the early adopters to the next 13.5%. The early majority belongs to the section between 16% and 50% and the next 34% are associated with the late majority. Because of this classification, in this paper, risk loving users are only allowed to enter the market when 2.5% of population have already adopted the service, risk neutral users will do so if more than 16% have joined, and the risk averse users join if the reference point of 50% has been exceeded. 4.4
Simulation Scenarios
The simulation allows to set two parameters. The first one is the failure probability of resources. This parameter determines the degree of risk in an open computing environment. The uncertainty of resources is given externally, which means a broker cannot control the level of uncertainty. However it can manage the quality of performance of resources. A safe environment is defined as 99.8% of resources have less than 1 % uncertainty. A dangerous environment is defined as having an uncertainty level between 1% and 5%. If the uncertainty level is between 5% and 10%, it is called a fatal environment. The uncertainty level beyond 10% is not considered in this simulation model. The second parameter is the broker’s strategy to operate the open computing environment. The broker can have three different strategies as described in section 4.2. Table 2 describes the potential values that both simulation parameters could have. Table 2. Category Environ ment
Simulation Parameters. Variable Value Resource Safe Uncertainty Dangerous Fatal
Broker
Strategy
Descriptions
Uncertainty probability of resources ≤ 1% Uncertainty probability of resources > 1% and ≤ 5% Uncertainty probability of resources > 5% and ≤ 10%
Do nothing No resource performance management. 20% alternative (Basic supplementary resources are provided for Service) contingency .
Insurance Service
Standard deviation of resource performance is controlled. Resources are provided until the given job is completed. Premium price is charged
Portfolio Service
No resource performance management. Resources are divided into three groups according to the failure uncertainty. Users choose how much of their resource needs is covered from each group. Premium or discount price is offered
Consequently, there are nine potential simulation scenarios. Considering that the main task of this research is to compare how much each strategy of the monopoly broker improves the overall performance of the open computing environment and the profit under the given conditions, the final results are sorted according to the group of failure uncertainty. That means, the outcome of each broker’s strategy will be compared at the same uncertainty level. We also investigate how the outcome of each strategy changes with respect to the level of uncertainty.
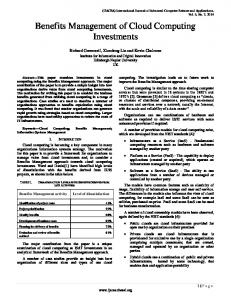
Fig. 1. The monopoly broker’s strategies.
The broker’s strategies are illustrated in Fig. 1. The default strategy of the broker is to provide a basic service (do-nothing alternative). An insurance service and a portfolio service are additional service offerings.
Basic Service. There is one virtual community, in which a monopoly broker and users trade resources based on five predefined rules. Rule 1: Users can get resources only through a broker. They send a job of length T and pay the price P. Rule 2: The pricing scheme of the broker is the first-degree price discrimination. Users are charged for the execution of their jobs at their maximum willingness-to-pay. Users are assumed to have heterogeneous risk attitudes. This property affects each user to set the value of T. Rule 3: A broker randomly selects T+x numbers of resources to execute the job of length T. The selection does not take into consideration neither the reliability nor the performance of the resources. Therefore, users take inevitably the risk of using resources of the open computing environment. The broker supplies additional +α resources for contingency. Rule 4: A broker is charged C to buy resources. Rule 5: A broker is a profit maximizing agent. His profit is P-C. If P < C, the broker rejects a user’ request. Then the user leaves the market. Insurance Service. Under this service model, the broker offers an insurance contract. The price set for the insurance service includes the risk premium. No moral hazard is assumed. So the insurance contract provides the full coverage for losses. Since the high number of resource failures burdens the broker with additional costs, he selects only qualified resources. The additional resources, which are used in case that the job T is not completed with T resources, are paid by the broker. They are called recovery cost R. The overall profit of the broker is P’-C-R. Portfolio Service. Under the portfolio service model, users compose their own portfolio of resources to conduct a job T. Users choose resource groups and the percentage of use. Resource groups are classified according to the failure probabilities of resources. The distribution of percentage of use corresponds to the user’s risk tolerance level. Options for portfolio composition are shown in table 3. Risk avers users only use resource group A and B, whereas risk loving users only use resource group B and C. Risk neutral users use all the resources from any group. The rule of ‘high risk high return’ is applied. Risky resources are sold at cheaper prices than less risky ones. Table 4.
Resource Portfolio Options. Environment Group
Uncertainty
Safe A Environment B C Dangerous A Environment B C Fatal A Environment B C
< 0.1% < 0.5% < 1% < 0.1% < 1% < 5% < 0.1% < 1% < 10%
Premium/ Discount 10% Premium 10% Premium No 20% Premium No 30% Discount 20% Premium No 50% Discount
Contingency 50% 35% 20% 50% 20% 10% 50% 20% No
4.5 Simulation Procedure The simulation program is written using Java and Repast J, which is an agent-based simulation toolkit designed particularly for agent-based social science modeling [31]. One simulation comprised one thousand time periods for each simulation scenario. The following algorithm illustrates the overall simulation flow. Algorithm for repeated interaction between a monopoly broker and N number of users.
/* Step 1: A broker purchases resources. */ broker.purchaseResources(); /* Step 2: The number of potential users from nonparticipating users is proportional to the broker’s reputation in the market. */ int entryLimit = numberOfObservers()*broker.getReputation() /* Step 3: Interaction between a broker and a user. Repeated for all users. */ while (users.hasNext()) { Auser = (TrustGridAgent) users.next(); /* Step 4: A nonparticipating user decides whether or not to join the market by probing the performance of the broker. */ if (Auser.doesNotTrustBroker()){ if(newEntries