Email: {hliu,ysun,vvalgent,msk}@eecs.wsu.edu. AbstractâDistributed Denial of ... these deficiencies, we propose a credit-based defense system: TrustGuard. ... ticket-granting mechanism adopted in their scheme employs hash-based integrity ...
TrustGuard: A Flow-level Reputation-based DDoS Defense System Haiqin Liu, Yan Sun, Victor C. Valgenti, and Min Sik Kim School of Electrical Engineering and Computer Science Washington State University Pullman, Washington 99164-2752, U.S.A. Email: {hliu,ysun,vvalgent,msk}@eecs.wsu.edu Abstract—Distributed Denial of Service (DDoS) attacks pose one of the most serious security threats to the Internet. We examine the drawbacks of existing defense schemes. To combat these deficiencies, we propose a credit-based defense system: TrustGuard. Essentially, flows accumulate credit based on the diversity of their packet-size distribution. The more diverse the flow, the more credit it has. Since DDoS attacks demonstrate low diversity they accumulate less credit and are likely to be dropped by the system. Naturally, the performance of TrustGuard greatly depends on the choice of credit accumulation and flow selection methods. We derive our solution by identifying the essential characteristics of DDoS attacks. Our analysis accounts for both micro and macro behaviors of DDoS attacks. The primary goal of this work is to not only detect the occurrence of a DDoS attack, but to also identify the attackers and victims involved. Experimental results demonstrate that TrustGuard performs admirably in both cases.
I. I NTRODUCTION In recent years, Distributed Denial of Service (DDoS) attacks pose one of the most serious security threats to the Internet [1]. DDoS attacks result in large outages of network services. DDoS attacks greatly degrade the performance of a network while remaining difficult to detect, and thus have become a serious security challenge for Intrusion Detection Systems (IDS) to protect against. Recently, a series of credit-model frameworks have been proposed to defend against DDoS attacks. Such schemes are attractive as they require little configuration and dynamically adapt to changes in traffic patterns, and thus have attracted the attention of researchers. Yang et al. introduce a Message Rate Controlling Model (MRCM) in their credit-based framework to defend against DDoS for Peer-to-Peer (P2P) streaming systems [2]. MCRM is essentially a network-wide solution requiring the cooperation of all nodes within a system, which renders this scheme impractical for deployment. Padmanabhan et al. propose a trust-based traffic monitoring approach for preventing DDoS attacks [3]. Again, their framework requires interaction among peer nodes in the network. A scheme most similar to our proposed system is presented by Natu and Mirkovic [4]. They proposed a credit-based ticketgranting system which is deployed at an organizational server. However, the framework still suffers from several deficiencies that can make it vulnerable in practice. First, since their system is deployed at an organizational server, it may not be able to protect legitimate accesses to that server if the ingress link
to the server is congested by a high-volume attack. Secondly, their credit calculation scheme is based on feedback from the server traffic conditions, which can reduce the ability of the defense to preemptively mitigate DDoS attacks. Finally, the ticket-granting mechanism adopted in their scheme employs hash-based integrity checks, which, if compromised, can lead to a complete failure of the system. In this paper, we proposed a flow-level, reputation-based defense system which can be deployed at a border router of an organizational network. By extracting the essential features of recent Internet DDoS attack traffic, we pinpoint victims that are under attack from a macro level view, and then accumulate the credit for each flow from micro-level views. A probabilistic drop method is used to filter DDoS traffic. We adopt a credit accumulation method in this paper that solves the problems as found in [4]. The remainder of this paper is organized as follows. Section II analyzes essential characteristics of DDoS attacks and proposes several indicators of DDoS attacks. Section III describes the overall system architecture and each module in detail. In Section IV, experimental results are presented and a conclusion in Section V. II. DD O S PATTERN A NALYSIS We evaluated recent Internet traffic traces from the Cooperative Association for Internet Data Analysis (CAIDA) [5], [6]. We derived normal Internet traffic from “The CAIDA Anonymized 2008 Internet Traces Dataset” (CAITD) and DDoS traffic from the “CAIDA DDoS Attack 2007 Dataset” (CDAD). The CDAD traces only contain attack traffic to the victims and any responses to that traffic. All traffic in the CAITD were collected from both directions of an OC-192 Internet backbone link by CAIDA’s equinix-chicago monitor. Both of these two traces were anonymized with the same key and the payload has been removed from all the packets for privacy reasons. The primary goal in this section is to find those essential features of DDoS attacks which can provide critical indicators to facilitate building a more reliable and robust credit-model. We extract the key features of the DDoS attacks for both the macro and micro-levels of the traffic patterns. The terminology “macro-level” feature means those globally distinguishable
A. Macro-Level Anomaly Analysis A number of features of DDoS traffic have been proposed as strong indicators of attack. These elements include: entropies of the individual components of the flow five-tuple (SIP, DIP, SPORT, DPORT, Protocol) [7], flow symmetry features [8], packet sizes [9], packet-to-flow ratio [10] and the ratio of SYN to SYN/ACK [11]. Our first step is to find the most descriptive features of both spoofed and true IP DDoS attacks amongst all these candidates. In order to induce a better indicator for macro-level DDoS patterns, several features of DDoS are discussed. [10] points out that DDoS attacks can engender an abrupt disproportion between the number of received packets and the number of IP flows. A DDoS attack from a series of zombies will have a finite number of instigating flows (i.e. the number of zombies). Thus, the ratio of packets to flow will be quite large. However, if the attacker employs spoofed IPs, then the potential range of attack addresses approaches several billion which can potentially mean many flows of few packets creating a relatively low ratio between packets and flow. Some researchers [8], [12] try to measure the flow-level symmetry and utilize it as the basis for their detection schemes. Such a scheme is only suitable for spoofed IP attacks and requires the deployment of a detector near the source which may not be feasible in practice since little incentive exists for the source Autonomous System (AS) to protect a victim located in a different AS. Some DDoS attack traffic, generated by reflectors or zombies for example, is hard to distinguish in terms of the flow-level symmetry property as it is wellformed traffic. Our preliminary inspection of both CAIDA traces indicates that normal flows and malicious flows show approximate equality in the flow symmetry feature. Entropy is a well-known metric for measuring the degree of randomness given a distribution. This property can be utilized for detecting a DDoS attack because DDoS traffic always comes from multiple sources and aggregate at one or a few destinations. Thus, when a DDoS attack occurs, the entropy of the source IP will become larger while the entropy of the destination IP will shrink. However, we are not going to adopt
2
10
10
10
10
10
8
8
10
6
10
4
10
2
10 # of packets
The combination of the observations from both the macro and micro-level offers two benefits: (i) Macro traffic features concentrate singly undetectable events into a global event that can make detection easier and faster without the need for deep inspection of each flow. (ii) Macro traffic features alone cannot provide a high-level of granularity in filtering. Thus, combining macro-level features with the micro-level flow characteristics allows for greater refinement in filtering.
# of packets
Definition A flow fi is a 2-tuple {sip i , dip i }, where sip i represents source IP address, dip i destination IP address, for a uni-directional flow.
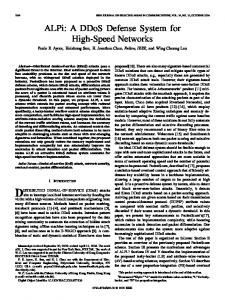
the previous entropy definitions [7] in our scheme. The main reason is that those entropy definitions usually reflect higherlevel anomalies which are hard to pinpoint. In our system, the macro-level anomaly indicator should support pinpointing victim addresses, in order to facilitate the explicit identification of the misbehaving flows. Mao et al. [9] indicate that 83% of attacks purely consist of small packets (usually less than 100 Bytes). Our inspection of the CDAD trace also shows a similar result. Fig. 1 illustrates an example of the packet size distribution by evaluating a single 5-minute interval of traffic from the CDAD trace. The distributions are both plotted as histograms according to the packet size. The data in the CAIDA traces demonstrated packets between 0 and 1600 Bytes. Thus we divided the total space into 16 equal intervals. The order of the interval that a given packet size falls in denotes the size of the packet. We can see that, for each specific protocol, the distribution of attack packet size is highly concentrated in level-1, which denotes a packet size less than 100 Bytes. Over 99% of attack packets from TCP and ICMP traffic, and 90% of UDP, fall in level-1. We
# of packets
traffic patterns when a DDoS attack occurs while “microlevel” represents those anomaly patterns that usually require the inspection of each individual flow. We define a flow below.
1
10
4
10
2
10
10
0
0
10
6
10
0
5 10 15 Packet size level
(a) TCP Fig. 1.
10
0
0
5 10 15 Packet size level
(b) UDP
10
0
5 10 15 Packet size level
(c) ICMP
Packet size distribution of DDoS traffic over different protocols.
argue that DDoS attack traffic tends to see smaller payloads for several reasons. First, the packet processing rate, rather than bandwidth, is the typical bottleneck for network devices. Thus, it is a better strategy for an attacker to send small packets as rapidly as possible to overload the victim’s CPU and memory. Moreover, low-volume attack traffic by utilizing small packets can help to hide the attack behavior to circumvent volumebased IDS. Finally, attack packets originating from different sources are usually produced by the same, or at least a similar, program which leads to packet distributions that are largely deterministic. For example, the IRC robot is a popular choice for attackers and all traffic generated from that software will demonstrate similar patterns. TABLE I D EFINITION
OF OUR PACKET SIZE LEVEL SCHEME
Size level 1 2 3 4 5 Range(Bytes) 40–60 60–80 80–100 100–120 120–200 Size level 6 7 8 9 10 Range(Bytes) 200–400 400–600 600–800 800–1000 1000–1200 Size level 11 12 Range(Bytes) 1200–1400 1400–1600
There is the possibility that some applications will have a high probability that most of the packets involved are smaller than 100 Bytes. In order to better target the anomaly detection,
we redefine the packet size-level scheme, as shown in Table I, to further reflect the distribution of packet sizes at the lower levels. Based on the above observation, we define the macro-level anomaly indicator H(A) for a destination address A. 12 ∑ √ H(A) = − imax · p(xi ) log2 p(xi ) (1 ≤ i ≤ 12)
III. S YSTEM D ESCRIPTION TrustGuard
Incoming traffic Traffic profile construction
Outgoing traffic
Probabilistic drop filter
Macro-level anomaly detector
Y
Anomaly?
Micro-level credit accumulation
update
Rule sets
(1)
Legitimate flows database
i=1
Where xi means the ith packet size-level, p(xi ) represents the probability that a packet possess a size that falls in the ith level and imax is the packet size-level where most packets fall for one specific address A. Thus, the greater concentration of packet sizes at the lower size levels, the smaller the H(A) value is, which translates to a higher probability that the victim A is under DDoS attack. Although there might be other properties among different flows targeted at the same victim, utilizing the packet size distribution is sufficient for our detection goals.
old −|i−imax | ), HIGH ) (2) Credit new fA = min(Credit fA +α(1−e
Where α is the credit increase factor, i represents the packet size-level of the incoming packet and imax can be obtained from the macro-level detection phase. Since the packet size distribution of attack flows is highly correlated, their flow credits will keep constant or continue growing at a very slow pace. As discussed earlier, small packets are advantageous to attackers when instigating an attack. Thus, it is not necessarily a good strategy for an attacker to implement diverse packet sizes in their attacks. Given this we believe our accumulation scheme should maintain its effectiveness well into the future.
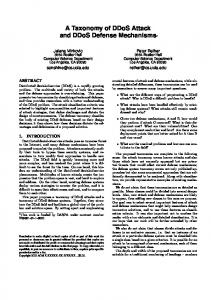
Overview of system architecture
In this section, we detail the architecture and function of our system. Fig. 2 illustrates the overall architecture of our defense scheme. Our system contains four main modules, namely, Traffic Profile Construction (TPC), Macro-level Anomaly Detector (MAD), Micro-level Credit Accumulation (MCA), and Probabilistic Drop Filter (PDF), which are described, in detail, as follows. A. Traffic Profile Construction The main function of the TPC module is to build the current traffic profile. A hash table with a linked list can be adopted in this module for statistical accumulation. For a given packet, we use the corresponding destination IP of that packet as the key in the hash table. Fig. 3 demonstrates the typical entries in the hash table. Besides the IP address used as the key for one
·
IP A
pacSizePtr
IP B
pacSizePtr
·
B. Micro-Level Anomaly Analysis Once we can identify victims based on H(A), the next question is how to distinguish malicious flows from the normal flows. We call the factors that can help to indicate an anomalous flow as micro-level anomaly indicators. One microlevel indicator would be to simply build an H(·) function for each flow. However, this is not a light-weight solution since it would require significant resources as the number of flows increase. This could cause the system to become a bottleneck and reduce its value. It is difficult to determine whether an isolated packet is malicious or not without referring to some global information. We term “malicious” to mean that a packet contributes to a DDoS flow. We are motivated by the fact that most packets in attack flows will share a similar distribution of packet sizes at the macro-level. Based on this observation, the information imax we obtained in the macro-level phase can be utilized to construct a light-weight flow level indicator at the micro-level phase. Here, we can apply a credit-based accumulation method for building the reputation of each flow targeting a particular victim. Suppose the credit is a number that ranges from LOW to HIGH and a new flow is assigned a credit value of LOW . We denote fA as a specific flow which is destined to address A. Thus, whenever there is a packet that belongs to flow fA , the micro-level reputation of such flow can be calculated as:
Fig. 2.
·
nextPtr
· nextPtr
Size Level 1 Size Level 2 Size Level 3 · · ·
Size Level 12
Fig. 3.
Data structure for building the traffic profile.
entry, it also contains pacSizeP tr which is a pointer to an array with 12 elements, each of which maintains the number of packets that fall into the corresponding level as described in Table I. The traffic profile is refreshed and built every time period Tmacro in order to minimize memory consumption. That is to say, the hash table only maintains those statistics during a period Tmacro . B. Macro-level Anomaly Detector In our scheme, the MAD module runs in an independent thread. It periodically scans the traffic profile built by the TPC module and will activate the MCA module whenever there is an anomaly event detected. To be more specific, it will report suspected victims to the MCA module for further flowlevel filtering. The macro-level anomaly indicator discussed in Section II can be utilized as the criterion for determining suspected victims. Simply, a given address A can be treated as a suspected victim whenever the following condition is satisfied. H(A) < TH H (3) Where TH H is a pre-defined threshold that can be determined according to the practical environment.
The MCA module is only active when there is an anomaly detected by the MAD module. Those flows related to a suspected victim will be examined by the MCA module. It keeps building the credit for each flow according to equation 2. The flows are maintained in another hash table, each entry of which contains a 2-tuple IP pair as the key, the time stamp of the corresponding new packet, and the credit value accumulated. In addition to the credit accumulation based on equation 2, we evenly divide the overall credit range [LOW , HIGH ] into n scales. Flows in higher scales should be legitimate traffic while those in the lower scales are potentially malicious. All the flows are initially set to be in the lowest scale. In order to reduce the memory consumption, whenever the difference between the current time and the time stamp of one flow is larger than Texp , then the corresponding entry will be removed during a periodic scan of the hash table. D. Probabilistic Drop Filter A probabilistic drop scheme is adopted in our system, and only those packets targeting suspected victims will be filtered by the PDF module. For a specific flow, the flow’s credit falls into the k th interval as per: [ ] LOW + k · HIGH n−LOW , LOW + (k + 1) · HIGH n−LOW . The probability that a packet belonging to that flow will be dropped as determined by: e−βk , where 0 ≤ k ≤ n − 1 and β is the probabilistic drop factor. Thus, flows with a low-level k will demonstrate a high probability of drop while flows with intermediate or high-level k will see limited drop.
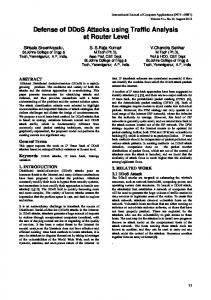
617594 packets per second making larger evaluations resource prohibitive. We further used only uni-directional traffic from the CDAD attack traffic in order to maintain a fair test. This traffic maintained an average rate of 79202 packets per second. Most of the traffic in the CDAD contains a single packet per flow and thus this data provided the model for spoofed IP DDoS attacks. The most significant difference we have observed between spoofed IP and true IP DDoS attacks is in the number of packets per flow. We synthetically generate true IP traffic traces in the following manner: (i) The average rate is 60000 packets per second. (ii) The source IP addresses are randomly selected from 1000 pre-defined source IP addresses. Thus, the resultant traffic will, on average, contain 60000 packets with roughly 60 packets per unique source IP. (iii) Finally, we randomly choose packet sizes to be between 40 to 50 Bytes. We set Tmacro = 1s. A. Macro-level Detection Performance Accurate detection of suspected victims directly affects the accuracy of our approach overall as non-victims are not investigated. We inject attack traffic into the CAITD traffic in order to evaluate the detection accuracy of the MAD module. A 60 second segment of the CDAD trace is injected into the CAITD traffic at an offset of 100 seconds. Further, we synthetically generated 60 seconds of true IP DDoS attack traffic, as explained above, and insert that into the CAITD traffic at an offset of 300 seconds. Fig. 4 illustrates the experimental 8
Volume (Byte)
C. Micro-level Credit Accumulation
6
x 10
5 4 0
50
100
150
200
250
300
350
400
450
500
550
600
350
400
450
500
550
600
350
400
450
500
550
600
IV. E VALUATION In this section, we evaluate the performance of the proposed TrustGuard scheme via simulation. In order not to inject bias into our experiments, the existing Internet traces CAITD and CDAD, which are both mentioned in the section II, will be utilized as much as possible and synthetically generated traffic is only employed when necessary. We chose uni-directional traffic for a 10-minute time period from the CAITD trace as our background traffic. The choice of a 10-minute interval stemmed from the fact that the CAITD has an average rate of
0.4 0.2 0 0
50
100
150
200
250
300
Time(s) 9
IP with Minimal H
The primary space requirement for the system is due to the hash tables employed in the TPC and MCA modules. Let NUM ip denote the number of distinct IP addresses during the hash table construction period Tmacro . For each victim identified we must further maintain an additional hash table. Denote NUM flow the average number of flows that are associated with the suspected victims detected by the MAD module. Let Lip represent the length (in bytes) of each record in the TPC hash table and Lflow denote the same in the MCA hash table. Thus, the total memory requirement is NUM ip · Lip + NUM flow · Lflow . One additional benefit by adopting the hash table is that the construction time of both the macro-level traffic profile and the micro-level credit is quite small.
Minimal H series
Time(s)
E. Space Requirement
5
x 10
0 0
50
100
150
200
250
300
Time(s)
Fig. 4.
Evaluation of MAD performance.
results. The minimal H series contain the minimal H value amongst all the destination IP addresses for one sampling period. The IP with minimal H identifies the IP address with the lowest score for a sampling period. We can see that either the spoofed IP attack or true IP attack can result in significantly smaller values of H, which make it easy for the defense system to determine a threshold TH H for detection. Furthermore, since those destination IP addresses can be pinpointed based on the threshold TH H , the countermeasures we take later can be targeted to defend the suspected victims. The Receiver Operating Characteristic (ROC) curve of our method are depicted in Fig. 5(a). For a false positive rate of 1%, our system can correctly identifies over 97.68% DDoS attacks. We also sought to determine the sensitivity of our approach to varying intensities of DDoS traffic. The attack traces are thinned by a thinning factor N such that we select 1 out of every N packets from the original attack traffic and otherwise repeat the above experiments. We chose a threshold, TH H ,
1 0.9 0.8
100
Detection accuracy (%)
True positive ratio
of 0.1 based on the results from Fig. 5(a) where 0.1 marks the typical lowest level of benign traffic as well as the highest level of those malicious. We define the Detection Accuracy
0.7 0.6 0.5 0.4 0.3 0.2 0.1 0 0
0.1
0.2
0.3
0.4
0.5
80 60 40 20
True IP attack Spoofed IP attack
0 0 10
0.6
1
10
False positive ratio
(a) ROC curve Fig. 5.
2
3
10
4
10
10
Thinning factor
(b) Sensitivity
V. C ONCLUSION
Evaluation of detection performance.
Ratio (DAR) as: DAR = 1 − (F P + F N )
(4)
Where F P denotes the False Positive ratio and the F N means the False Negative ratio. Fig. 5(b) shows the experimental results. When the thinning factor is less than 10, the MAD module performs well and can achieve over 95% DAR in both true and spoofed IP attack cases. When the thinning factor is larger than 100, which means the average rate per second of attack traffic is smaller than 0.1% of the background traffic, the detection performance rapidly degrades. B. Micro-Level Filtering Performance We also evaluate the micro-level filtering performance of our system. We define two metrics called the Legitimate Survival Ratio (LSR) and the Malicious Survival Ratio (MSR) to measure the performance, which are defined as follows. { NUM passN ormal LSR = NUM totalN ormal (5) NUM passAnomaly M SR = NUM totalAnomaly Where NUM passN ormal and NUM passAnomaly are the number of legitimate and anomalous packets that successfully passed through the system (i.e. not dropped) and NUM totalN ormal and NUM totalAnomaly are the total number of legitimate and anomalous packets. To evaluate the flow-level filtering performance, we chose a set of legitimate flows that are associated with a single destination from the CAITD trace and then change that destination to one that is under DDoS attack in the CDAD trace. After that, we combine the modified trace with the CDAD trace and evaluate it. The default settings for the parameters we adopted here were Texp = 10min, LOW = 0, HIGH = 5, α = 2, β = 1 and n = 5. Fig. 6 100 90
LSR MSR
80
Percent (%)
70 60 50 40 30 20 10 0 0
10
20
30
40
50
Time(s)
Fig. 6.
Evaluation of micro-level filtering
shows the experimental results. We can see that most normal packets (over 98%) pass through our system unmolested, while most malicious flows are filtered by our system due to the low credit they accumulate. All the first packets of flows associated with a suspected victim detected by the MAD module will be dropped during the initial phase. However, as flows begin to move data then they have a greatly reduced chance of drop. Further, since the MAD module targets only flows impacting suspected victims then most traffic encountered is ingnored by our system.
60
In this paper, we present TrustGuard to counter the threat of DDoS attack. Our approach employs a two-tier model to reduce the size of the search space and make identification of specific attackers and victims possible. Our macro-level detector can accurately identify suspected victims and the microlevel detector can then confirm and refine those suspicions. We believe that this approach can accurately identify DDoS attacks down to the instigating flows and that this information can be used to improve firewall and IDS rules. R EFERENCES [1] J. Mirkovic and P. Reiher, “A taxonomy of DDoS attack and DDoS defense mechanisms,” ACM SIGCOMM Computer Communication Review, vol. 34, no. 2, pp. 39–53, Apr. 2004. [2] J. Yang, Y. Li, B. Huang, and J. Ming, “Preventing DDoS attacks based on credit model for P2P streaming system,” in Proceedings of the 5th international conference on Autonomic and Trusted Computing. Berlin, Heidelberg: Springer-Verlag, 2008. [3] J. Padmanabhan, K. S. Easwarakumar, G. B., and H. S., “Trust based traffic monitoring approach for preventing denial of service attacks,” in Proceedings of the 2nd International Conference on Security of Information and Networks. New York, NY, USA: ACM, 2009. [4] M. Natu and J. Mirkovic, “Fine-grained capabilities for flooding DDoS defense using client reputations,” in LSAD ’07: Proceedings of the 2007 workshop on Large scale attack defense. New York, NY, USA: ACM, 2007. [5] P. Hick, E. Aben, K. Claffy, and J. Polterock, “The CAIDA DDoS Attack 2007 Dataset,” http://www.caida.org/data/passive/ddos-20070804 dataset.xml (accessed on 2010-02-28). [6] C. Shannon, E. Aben, kc claffy, and D. E. Andersen, “CAIDA Anonymized 2008 Internet Traces Dataset (20081120),” http://www. caida.org/data/passive/passive 2008 dataset.xml (accessed on 2010-0228). [7] G. Nychis, V. Sekar, D. G. Andersen, H. Kim, and H. Zhang, “An empirical evaluation of entropy-based traffic anomaly detection,” in Proceedings of the 8th ACM SIGCOMM conference on Internet measurement, New York, NY, USA, 2008. [8] K. Lu, D. Wu, and J. Fan, “Robust and efficient detection of DDoS attacks for large-scale internet,” Computer Networks: The International Journal of Computer and Telecommunications Networking, vol. 51, no. 18, pp. 5036–5056, Dec. 2007. [9] Z. M. Mao, V. Sekar, O. Spatscheck, J. van der Merwe, and R. Vasudevan, “Analyzing large DDoS attacks using multiple data sources,” in Proceedings of the 2006 SIGCOMM workshop on Large-scale attack defense, Pisa, Italy, 2006. [10] H. Rahmani, N. Sahli, and F. Kammoun, “Joint entropy analysis model for DDoS attack detection,” vol. 2, Aug. 2009. [11] H. Wang, D. Zhang, and K. G. Shin, “Change-point monitoring for the detection of DoS attacks,” IEEE Transactions on Dependable and Secure Computing, vol. 1, no. 4, pp. 193–208, Oct. 2004. [12] T. Xu, D. K. He, and Y. Zheng, “Detecting DDoS attack based on oneway connection density,” in Proceedings of the 10th IEEE Singapore International Conference on Communication systems, Oct. 2006.