Turbine flowmeter response to transitional flow regimes Zijad Džemića, Brane Širokb, Benjamin Bizjan*b a
Institute of Metrology of Bosnia and Herzegovina, Augusta Brauna 2, 71000 Sarajevo, Bosnia and Herzegovina
b
University of Ljubljana, Faculty of Mechanical Engineering, Aškerčeva 6, 1000 Ljubljana, Slovenia
*Corresponding author. Email address:
[email protected]; Phone: +386 14771423
Abstract In this paper, acceleration and deceleration performance of turbine flowmeters was investigated in transitional flow regimes. Different flow meters and peak gas flow rates were used, with a step flow transition induced by rapid closing and reopening of the pipeline valve. Hotwire anemometry was employed as a reference method to assess the dynamic response of turbine flowmeters. Results of this study suggest a good dynamic response of turbine flowmeters in accelerating flows, with only a slight delay of the turbine rotation. However, in decelerating flows, the response of the flowmeter turbine was found to be slow, with characteristic time constants up to 35 seconds and large resulting over-registration of transferred gas volume. Our findings were quantified by multiple regression models for flowmeter response times and over-registered volumes, which were both find to drop with Reynolds number and increase with the flowmeter size. Understanding dynamic response is essential to evaluate dynamic errors and evaluate overall measurement uncertainty. Keywords: Turbine flowmeter, dynamic response, Reynolds number
1 Introduction Despite the constant development of novel flow measurement methods, the turbine-type meters remain widely used in volume measurement of natural gas due to their accuracy and reliability. A well calibrated and properly installed turbine flow meter is capable of measurements with less that ±0.25% error (Tang [1]). Several publications have so far dealt with turbine flowmeter calibration and measurement uncertainty analysis (Van der Grinten [2], Ruiz et al. [3], Nerijus et al. [4]), as well as with numerical modeling of the flowmeter operation (Osiadacz and Witos [5], Guo et al. [6]). The majority of existing studies was focused on steady-state operation of the flowmeter where the flow rate of gas is constant or changes at a very slow rate. While such a uniform transport of natural gas is certainly desired, flow conditions in the pipelines are often far from constant due to fluctuations in gas supply and demand, which are closely linked to 1
unpredictable environmental conditions (Geršak et al. [7]). The two main types of time dependent flows are pulsating and intermittent flows (Cascetta and Rotondo [8]), but the actual gas flow may be a combination of both, especially over longer periods of time. Pulsating flows are typically generated by pulsating devices such as compressors and regulators and are characterized by harmonic oscillations of the gas flow rate about its mean value, constantly resulting in excessive volume readouts by gas meter, known as over-registration or overestimation (Lee et al. [9]). The effect of flow pulsations on the measurement uncertainty of turbine flowmeters was investigated and modeled by Cheesewright et al. [10] and Lee et al. [9] as a function of pulsation frequency and amplitude, as well as flow meter size and flow rate. As shown by Stoltenkamp et al. [11], acoustic perturbations (e.g. due to standing waves in the system) may also cause substantial oscillations of the gas flow rate, leading to significant measurement errors due to the poor dynamic response of turbine flowmeters. The effect of pulsating flow disturbances can be partly reduced by a proper installation of the flowmeter, including a sufficient length of straight pipe sections and the application of flow settling devices such as tube bundles and flow conditioning plates (Mattingley and Leh [12], Miller [13]). However, even a properly installed turbine flow meter will still be affected by intermittent flow transitions, which cannot be sufficiently reduced in the system. These are mostly induced by quick changes in the flow rate of gas, usually due to opening or closing of a pipeline valve or sudden changes in gas demand. The rotational speed of a flowmeter turbine typically follows the flow acceleration well, but exhibits a significant delay when slowing in a decelerating flow (Cascetta & Rotondo [8], Tonkonogij et al. [14], Tonkonogij & Tonkonogovas [15]) resulting in over-registration of gas volume. Despite the exponential reduction of the turbine rotational speed [14] [15], the meter response duration may be relatively long compared to the duration of the flow transition (especially if the flow is completely stopped), leading to significant over-registration of gas volume. According to Cascetta and Rotondo [8], a typical medium-sized turbine flowmeter may experience as much as 10000 on/off cycles or other significant step changes in flow rate per year, consequently overestimating the gas volume by more than 1%. In [14] and [15], response characteristics and corresponding dynamic measurement errors of turbine gas meters are discussed in dimensionless form. The flow rate variability presents an additional source of measurement uncertainty in operation of turbine flowmeters besides the measurement uncertainty in steady flows. During exploitation of a gas distribution system, flow disturbances can cause a significant dynamic error in the registered volume of natural gas. This is becoming an increasingly important issue due to the increasing natural gas prices and consumption as well as more rigorous gas metering regulations. Therefore, the present paper aims to assess the effect of transitional flow phenomena on the dynamic measurement error of turbine flowmeters. The error (i.e 2
over-registered gas volume) will be presented as a function of flow meter size, flow rate and duration of the intermittent step flow disturbance.
2 Experimental methodology 2.1 Experimental set-up Experimental work presented in this paper was performed at the Laboratory for testing and calibration of gas meters at the company Sarajevogas in Sarajevo, Bosnia and Herzegovina. The laboratory is situated in the Institute SAGALAB officially designated by the National Institute of Metrology of Bosnia and Herzegovina and has successfully participated on EURAMET project 1296 of inter-laboratory calibration comparison in the range of flow rates from 20 m3/h to 1000 m3/h, having approved calibration and measurement capabilities. SAGALAB facility operates on the master meter principle where the meter under test (transfer standard) is located downstream from the standard meters. Ambient air is sucked by a blower and the flow rate is adjusted by regulation of the blower and electromotive valve. Testing procedure is software controlled. Characteristics of the SAGALAB facility: Range of flow rates:
(0.5 – 4000) m3/h
Operating temperature: Operating pressure:
(21 ± 2)°C
atmospheric conditions
Measurement uncertainty (k = 2):
0.31 %
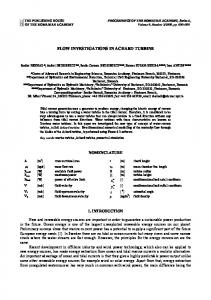
Intermittent flow performance of three different turbine flowmeters was evaluated in a specially adapted test rig – consider measurement setup shown in Fig. 1. The test installation consisted of an open pipeline filled with air (at 1 bar absolute pressure and approximately 20 °C temperature), a centrifugal blower for producing the desired volumetric flow rate Q, a turbine flowmeter to be tested, and a valve behind the inlet flow straightener. Each of the three different flowmeters to be tested G250, G1000 and G2500) required a pipeline with a different size (DN80, DN200 and DN300, respectively), to which the same flow measurement equipment was installed prior to the start of the particular set of experiments. During the measurements, the air flow was first stabilized at the desired nominal value Q. The pipeline valve was then rapidly closed and later (after approximately one minute) reopened to induce an intermittent step disturbance of flow deceleration and acceleration, respectively.
3
Fig. 1. Measurement setup for testing the turbine flowmeter dynamic response
Flow rate, i.e. rotational speed of the flowmeter turbine was measured by a high frequency (HF) pulse signal p(t), for flowmeters of three different sizes (diameter D, Table 1) with respective maximum flow rates Qmax (basically, the volume of gas flown through the meter is proportional to the number of pulses). Additionally, the velocity of circulating air at the pipe centerline was measured by a hotwire (HW) anemometer (Dantec MiniCTA 55P11 [16] as a measure of the instantaneous air flow rate. The main advantage of HW anemometry is its very good dynamic response to changing flow conditions, making it well suited for evaluation of other methods' performance in transitional flows. Both the flowmeter signal and the HW anemometer signal were sampled at 5000 Hz and acquired to a computer using National Instruments measurement cards and LabVIEW software.
Table 1. Turbine flowmeters used in experiments. Ranges of Q and Re are provided for unrestricted flow (fully opened valve) #
D (m) 0.1
Qmax (m3/h) 400
Q range (m3/h) 50-250
Re range (∙103) 11.8-58.9
1
Type G250
2
G1000
0.2
1600
300-1100
35.4-130
3
G2500
0.25
4000
1100-3000
104-283
2.2 Calculation of experimental variables In the first step in the post processing of measurement data, turbine rotational speed ω (unit: Hz) was calculated from the pulse signal p(t) as ω(t) = 1/Δt(t), where Δt is the time between neighboring peaks of p(t) at time t. Then, the normalized rotational speed was calculated as ωn = ω/ωmax, where ωmax is the value of ω at nominal (100%) gas flow rate. Besides, the 4
centerline flow velocity v was calculated from the hotwire voltage signal U(t) by equation v = (U2/0.741-2.651)2.036, which was obtained from HW calibration data. For the purpose of comparison to the turbine rotational speed, HW-measured velocity was also normalized as vn = v/vm. However, due to the fact that the HW signal exhibited significant turbulence-induced oscillations, the signal v(t) was smoothed and down sampled to 100 Hz sampling rate. Then, vm was computed as the time-averaged velocity after the flow rate through the meter has been fully resumed following the valve reopening. Finally, both ωn and vn were plotted as a function of time (a sample diagram is shown in Fig. 2). Note that since vn was computed from measurements conducted at the pipe centerline, it is linearly proportional to the maximum flow velocity of a velocity profile, but not to the mean flow velocity v Q / A (Q is the gas volumetric flow rate and A is the pipe cross-section area) as the profile shape changes with Reynolds number (Eq. (1)). In Eq. (1), νa is the kinematic viscosity of air. Re
vD
(1)
a
However, flows in all operating points were turbulent with Re = 1.2∙104…2.8∙105 (Table 1), suggesting similarly shaped velocity profiles roughly following the 1/7th power law curve (Chen [17]). Following the methodology presented in [18], we estimate the ratio vm / v to vary by no more than 6% between operating points. For these reasons, no corrections were made to the value of vn, assuming vn Q and vn Re .
Fig. 2. A sample diagram of normalized HW and turbine-measured dynamic response to a step flow transition (Q = 900 m3/h) 5
Fig. 2, which shows the temporal response of ωn and vn for G1000 flowmeter at initial flow rate Q = 900 m3/h. Closing of the pipeline valve occurs at time t0 and is followed by a rapid reduction of flow velocity detected by the HW anemometer (vn) due to flow deceleration. However, the response of the flowmeter rotational speed ωn was much slower, as even 60 seconds after t0 the turbine was still spinning. At t1, the valve was reopened with the flow velocity vn resumed in less than 2 seconds. Now, the value of ωn lags behind vn much less than in the case of flow deceleration, returning to 99% of its initial magnitude at time t2, which was chosen to mark the end of the turbine dynamic response. For characterization of dynamic response of the turbine flowmeter to the step flow transition, multiple regression measures will be introduced. Due to the lag of the turbine rotational speed, the flowmeter over-registers the volume of gas between t0 and t1 and under-registers it between t1 and t2. Over-registered volume V1 and under-registered volume V2 can be calculated by integration – Eqs. (2) and (3). The constant kt = 1s introduced to allow for dimensionless formulation of V1 and V2, which is mathematically more correct considering the fact that ωn and vn are already dimensionless. Note that the integration of normalized quantities ωn and vn yields a result with [s] unit. For the example presented in Fig. 2, the valuesV1 = 21.6 and V2 = 0.93 were obtained, meaning that between t0 and t2, the gas volume is over-registered by V1-V2 = 20.7, or an equivalent of dimensional gas volume transferred through the flowmeter at fully opened valve in 20.7 seconds (5.18 m3). Since the interval length t0 and t1 in which the valve was closed was not constant in all operating points, the volume V50 (Eq. (4)) will also be introduced as the over-registered gas volume in the first 50 seconds after t0.
V1
1 kt
V2
V50
1 kt 1 kt
t1
(t ) v (t ) dt n
(2)
n
t0
t2
v (t ) (t ) dt n
(3)
n
t1
t0 50 s
(t ) v (t ) dt n
(4)
n
t0
A measure closely related to over- and under-registered gas volumes is the ratio θ between the acceleration and deceleration time of the flowmeter turbine – Eq. (5). Typically, the value of θ is well below 1, as the turbine accelerates quickly and decelerates slowly upon a step flow transition. 6
t2 t1 t1 t0
(5)
Another characteristic parameter will be introduced as the halving time, τ1/2, required for ωn to drop to 50% of its initial value at t0. As such, the time constant τ1/2 is an important measure of the flowmeter mass inertia and mechanical losses. A dimensionless formulation of the halving time will be designated as τ = τ1/2/kT. Note that in case that the decay of ωn is exponential, τ1/2 is linearly proportional to the time constant of the 63.2% exponential decay τe: τe = τ1/2/ln(2) ≈ 1.44 τ1/2.
3 Results and discussions 3.1 Flowmeter dynamic response curves Similarly to the case shown in Fig. 2, the dynamic response of investigated flowmeters will be presented by curves of the normalized turbine rotational speed ωn (Figs. 3-5) for different initial flow rates Q. The graphs will show ωn as a function of time t-t0 passed since closing of the valve. In Figs. 3-5, reopening of the valve (at t1) is marked by circles while triangles denote the time t2 when the flowmeter turbine reaches 99% of its final rotational speed. This marks the end of the turbine dynamic response, in accordance with the developed convention
Fig. 3. Response of the flowmeter No. 1 to flow deceleration and acceleration 7
Fig. 4. Response of the flowmeter No. 2 to flow deceleration and acceleration
Fig. 5. Response of the flowmeter No. 3 to flow deceleration and acceleration
From Figs. 3-5 it can be concluded that the curves of ωn resemble the shape of exponential decay function (consistent with the findings of Tonkonogij & Tonkonogovas [15]). However, 8
the dynamic response of the normalized rotating speed ωn to otherwise very quick flow deceleration is slow, with halving times τ1/2 between 6 s and 35 s and generally dropping with Q (Fig. 6). Consequently, the transferred volume of gas is largely over-registered between t0 and t1. The volume V50 (Fig. 6), which marks the over-registered volume between t0 and t0 + 50 s, can be observed to drop with Q and increase with the flowmeter size. Also, in all operating points, the under-registered volume V2 is much lower than the over-registered volume V1 (V1/V2 = 12…60, consider Fig. 6). This leads to a conclusion that V2 is not a significant issue in transitional flow measurement and even reduces the overall measurement error (V1V2) through partly offsetting V1.
Fig. 6. Characteristic dynamic response parameters of turbine flowmeters depending on their size and the initial flow rate Q
3.2 Regression models for transient delay and measurement errors To present the results of analysis of measured parameters more systematically, the effect of operating parameters on the dynamic response of flowmeters will also be modeled empirically. Due to the relatively large range within which these parameters varied, power law fitting will be used to form multiple regression models for V50, θ and τ – Eqs. (6), (7) and (8), respectively. To make these models fully dimensionless, the flowmeter size D (unit: m) will be replaced by δ = D/kL where kL = 1m. The following general equation will be used for power law fitting:
(6)
i a0 Re a1 a2
9
In Eq. (6), Πi is the modeled variable (V50, θ or τ). Regression coefficients a0, a1 and a2 are obtained by least-squares fitting of the power-law model to the measurement data. The following models are obtained:
V50 1.61 104 Re 0.480 0.796
(7)
2.69 103 Re 0.737 0.945
(8)
7.20 106 Re0.900 1.77
(9)
All models in Eqs. (7)-(9) have a high coefficient of determination (R2): 0.923, 0.931 and 0.960, respectively. This indicates a good agreement between multiple regression models and used measurement data. As demonstrated by Figs. (7)-(9) and corresponding Eqs. (7)-(9), all modeled variables (V50, θ and τ) increase with the flowmeter size δ. This is consistent with the findings of Cheesewright et al. [10] and Tonkonogij & Tonkonogovas [15] who reported longer response times and larger over-registered volumes for larger turbine flowmeters. Such behavior can be explained by the fact that larger flowmeters possess a higher ratio of inertial mass forces to dissipative forces of aerodynamic drag and friction in bearings and other mechanical elements [5].
Fig. 7. Dimensionless volume V50 as measured in experiments (data points) and modeled by Eq. (7) – trend lines (R2 = 0.923) 10
Fig. 8. Acceleration/deceleration time ratio θ as measured in experiments (data points) and modeled by Eq. (8) – trend lines (R2 = 0.931)
Fig. 9. Dimensionless halving time τ (corresponds to τ1/2 in [s] unit) as measured in experiments (data points) and modeled by Eq. (9) – trend lines (R2 = 0.960)
Speaking of the Reynolds number effect, it is evident that an increase of Re (or equally, the ratio Q/QMAX for a flowmeter of a given size) causes a more rapid response (i.e. lower halving 11
time τ1/2 and acceleration time t2-t1) of the flowmeter turbine rotation to the flow transition phenomenon, and consequently also lower measurement error due to gas volume overregistration. At the same time, reduction in θ implies that the dynamic response of the flowmeter becomes even more asymmetrical, with turbine acceleration up to 12 times faster than deceleration. Faster acceleration with rising Re and Q/QMAX values can be explained by the fact that a flow with higher velocity (when valve is reopened) exhibits a greater kinetic energy available for acceleration of the flowmeter turbine, whilst at the same time the relative effect of mechanical dissipative forces is reduced (Osiadacz [5]). As previously elaborated, the flow transition induced in presented experiments is very fast, which is often not the case in natural gas pipelines where the flow rate is adjusted more gradually. Also, flowmeter response times in natural gas systems are lower due to significantly higher operating pressures (and consequently Reynolds numbers). As a result, gas volume measurement errors due to unsteady gas flow are not as extreme as in given experiments, though still significant if large amplitude flow fluctuations are present in the system. Nevertheless, very high R2 values of multiple regression models for V50, θ and τ suggest that these models could be extrapolated beyond the experimental range of Reynolds numbers and flowmeter sizes, thus potentially serving as a tool for assessment of measurement uncertainty in the metering of transient natural gas flows.
4 Conclusions In this paper, the dynamic response of turbine flowmeters to a step flow transition has been investigated from the perspective of dynamic errors. Experimental results confirm a highly asymmetrical flowmeter response characteristic to flow changes, which is consistent with results previously reported in literature. Flow acceleration is not problematic as it is quickly followed by acceleration of the flowmeter turbine. However, during the regime of flow deceleration, the response of the flowmeter is much slower, causing the transferred gas volume to be largely over-registered. Dynamic response during deceleration was found to be faster for smaller flowmeters operating at relatively high Reynolds numbers (i.e. near the maximum allowable flow rate). The same applies for the measurement error due to gas volume over-registration. With that said, multiple regression models for dimensionless response times and overregistered volumes demonstrate a rather straightforward and well-correlated dependence on the flow Reynolds number and the turbine flowmeter size. To avoid excess overestimation of transferred gas volume, the duration of pipeline valve closing procedure should be of the order of magnitude of 10 seconds or more. Slower valve closing is required when a turbine 12
flowmeter is operating at partial loads or at lower system pressures. Further research of dynamic response characteristics should include measurements at elevated pressures and with different types of flow variability (e.g. intermittent in form of a ramp or pulsating sine wave function) to expand and verify the validity of multiple regression models presented in this paper. Measuring system consisting of thermal and turbine type of standards assumed improvements in metrological characteristics that were confirmed through the experiment on different flow rates done in SAGALAB. Presented method and explanation can be used as a base for improvements of the performance characteristics for the purposes of calibration in situ of each meter connected in series and can be used to improve the measurement of the amount of working fluid.
Acknowledgements The authors acknowledge the contribution of the Laboratory of Metrology and Quality at the University of Ljubljana, Faculty of Electrical Engineering in performing this study.
References [1] Tang (2014) Pressure, temperature, and other effects on turbine meter gas flow measurement. American School of Gas Measurement Technology, Houston. [2] Van der Grinten, J.G.M. (1990) Error curves of turbine gas meters. The Netherlands Measurement Institute, Delft. [3] Ruiz, V., Pereira, M.T., Taira, M.N. (2013) Turbine flowmeter and viscosity effects of liquid hydrocarbons. In: 16th International flow measurement conference, 2013, Paris. Proceedings… (FLOMEKO, 2013). 5 p. [4] Nerijus, P., Gediminas, Z., Eugenijus, M. (2015) Influence of Gas and Liquid Viscosity on Turbine and Positive Displacement Meters Calibration. In: 17th International Congress of Metrology, 2015, Paris. DOI: 10.1051/metrology/20150001003. [5] Osiadacz, A.J., Witos, M. (2010) The analysis of factors affecting the operating characteristic of turbine gas meter. Archives of Mining Sciences, 55(1), 163-180. [6] Guo, S., Sun, L., Zhang, T., Yang, W., Yang, Z. (2013) Analysis of viscosity effect on turbine flow meter performance based on experiments and CFD simulations. Flow Measurement and Instrumentation, 34, 42-52, DOI: 10.1016/j.flowmeasinst.2013.07.016. 13
[7] Geršak, G., Bojkovski, J., Batagelj, V., Hudoklin, D., Begeš, G., Pušnik, I., Drnovšek, J. (2008) On-site environmental conditions - do they really affect the measuring accuracy?. Journal of testing and evaluation, 36(6), 1-5, DOI: 10.1520/JTE101866. [8] Cascetta, F., Rotondo, G. (2015) Effects of intermittent flows on turbine gas meters accuracy. Measurement, 69, 280-286, DOI: 10.1016/j.measurement.2015.02.0080263-2241. [9] Lee, B., Cheesewright, R., Clark, C. (2004) The dynamic response of small turbine flowmeters in liquid flows. Flow Measurement and Instrumentation, 15, 239-248, DOI: 10.1016/j.flowmeasinst.2004.07.002. [10] Cheesewright, R., Atkinson, K.N., Clark, C., Ter Horst, G.J.P, Mottram, R.C., Viljeer, J. (1996) Field tests of correction procedures for turbine flowmeters in pulsatile flows. Flow Measurement and Instrumentation, 7(1), 7-17. [11] Stoltenkamp, P.W., Bergervoet, J.T.M., Willems, J.F.H., Van Uittert, F.M.R., Hirschberg, A. (2008) Response of turbine flow meters to acoustic perturbations. Journal of sound and vibration, 315, 258-278, DOI: 10.1016/j.jsv.2008.01.051. [12] Mattingley, G.E., T.T., Yeh (1991) Effects of pipe elbows and tube bundle on selected types of flow-meters, Flow Measurement and Instrumentation, 2, 4-13. [13] Miller, R.W., “Flow Measurement Engineering Handbook”, McGraw-Hill Book Company, 1996. [14] Tonkonogij, J., Pedišius, A., Stankevičius, A. (2008) The New Semi-Experimental Method for Simulation of Turbine Flow Meters Rotation in the Transitional Flow. World Academy of Science, Engineering and Technology, 40, 208-213. [15] Tonkonogij, J., Tonkonogovas, A. (2013) Analysis of nonlinearity of the turbine gas meters time constant during step response. Mechanika, 19(5), 526-530. [16] Dantec Dynamics: MiniCTA and Multichannel CTA Systems. Available at: https://www.dantecdynamics.com/docs/products-and-services/fluid-mechanics/cta/ PI313_MiniCTA_MultichannelCTA_Anemometer_System.pdf. Accessed on 2017-03-15. [17] Chen, C.L. (1991) Unified Theory on Power Laws for Flow Resistance. Journal of Hydraulic Engineering, 117(3), 371-389. [18]
Kudela,
H.
–
Turbulent
flow.
Available
at:
http://www.itcmp.pwr.wroc.pl/~znmp/dydaktyka/fundam_FM/Lecture_no3_Turbulent_flo w_Modelling.pdf . Accessed on 2017-08-18. 14