TURBULENT MIXED CONVECTION FLOWS COMPUTED USING LOW-REYNOLDS-NUMBER AND STRAIN PARAMETER EDDY VISCOSITY MODELS M.A. Cotton and A. Keshmiri School of Mechanical, Aerospace and Civil Engineering (MACE), The University of Manchester, Manchester M60 1QD, U.K.
[email protected] Abstract Buoyancy-influenced ascending and descending pipe flows are computed using three eddy viscosity turbulence models: the Launder-Sharma (1974) model is a ‘low-Reynolds-number’ scheme, while the Craft et al. (1996) and Cotton-Ismael (1998) closures incorporate dependence on a ‘strain parameter’. It is found that the Launder-Sharma model is in closest agreement with direct simulation data for heat transfer, although it is argued that this finding should be interpreted with care. A low Reynolds number extension of the ‘buoyancy parameter’ of Hall and Jackson (1969) is advanced and shown to improve the collapse of computed heat transfer results at lower levels of buoyancy influence.
1 Introduction Convective heat transfer is generally divided into the regimes of ‘forced convection’ (where motion is caused by an applied pressure gradient) and ‘free convection’ (where density variations drive the fluid motion). However, both mechanisms may operate simultaneously and where there is a buoyancymodified forced flow the heat transfer regime is termed ‘mixed convection’. In ascending turbulent mixed convection heat transfer levels (quantified in terms of Nusselt number) may, depending on the extent of buoyancy influence, be either impaired or enhanced compared to a forced convection flow at the same Reynolds and Prandtl numbers. In descending mixed convection heat transfer levels increase monotonically with buoyancy influence. The monograph of Petukhov and Polyakov (1988) and review papers of Jackson et al. (1989) and Jackson (2006) provide detailed treatments of the complex phenomena associated with the turbulent mixed convection regime. A dimensionless group known as the ‘buoyancy parameter’, Bo is widely used to characterize the degree of buoyancy influence. The buoyancy parameter was originally developed in a semiempirical analysis pursued by Hall and Jackson (1969). Works from the late-1980s onwards have tended to adopt a revised form of the parameter (Cotton, 1987; Jackson et al., 1989):
Gr
Bo = 8 × 10 4 Re
3.425
(1)
Pr 0.8
The present work reports eddy viscosity model (EVM) computations of mixed convection flows in a uniformly-heated vertical pipe. Both ascending and descending flows are considered. In the final part of the paper the buoyancy parameter of Equation (1) is modified to account for low Reynolds number effects.
2 Physical and numerical formulation The mean flow equations of continuity, momentum, and energy are cast in the Boussinesq approximation:
∂U j ∂x j
Uj
=0
∂U i ∂ 1 ∂p =− + ∂x j ρ ∂x i ∂x j
Uj
∂T ∂ = ∂x j ∂x j
(2)
( ν + ν t − β (T
ν ν + t Pr σ t
)
∂U i ∂x j
− T0 ) g i (3)
∂T ∂x j
(4)
where νt, the turbulent or eddy viscosity, is to be supplied by one of three turbulence models (below). x1 is the principal flow direction (vertically up or down) and g1 = -g in upflow and +g in downflow; T0 represents a reference temperature. The turbulent Prandtl number, σt is set to 0.9. Turbulent viscosity in the Launder-Sharma (1974; ‘LS’), Craft, Launder and Suga (1996; ‘Suga’) and Cotton-Ismael (1998; ‘CI’) models may be written in the following generic form:
k2 ν t = C µ f µ (Ret ) f S ( S ) ~ ε
(5)
where Cµ = 0.09 and fµ and fS are ‘damping functions’. The turbulent Reynolds number is defined as Re = k 2 / ν~ ε , while S is a ‘strain parameter’ (dist
cussed further below). It is noted that, while the constitutive equation of the Suga model includes second and third order products of the mean strain rate and vorticity tensors, these terms make no contribution in flows such as those of present interest where the strain field is one of simple shear. In the LS model fS = 1 and hence damping is dependent solely on Ret. The Suga and CI models include both fµ and fS, the latter function supplying the principal agency of damping. In the CI model fµ departs from unity only at very low Ret; furthermore, the function is restricted to 0.7 ≤ fµ ≤ 1.0. Space limitations preclude inclusion of the full prescriptions of the model damping functions and the interested reader is referred to the original papers for this information. (Similarly, the model transport equations are not presented here; it is noted though that the Suga and CI formulations may be regarded as developments of the LS scheme.) The strain parameter, S is determined by different means in the Suga and CI models. In simple shear, however, S in the Suga model is exactly equal to ( k / ~ ε ) ∂U 1 / ∂x 2 , while in the CI model it approximates this expression. Solution of the governing equation set is obtained using a parabolic marching scheme. One hundred control volumes are deployed across the pipe radius and the node nearest to the wall is typically located at y+ = 0.5; approximately half the nodes are positioned between the wall and y+ = 60. Carefully constructed sensitivity tests have been applied here and in previous studies to ensure the numerical reliability of the results presented below.
3 Results 3.1 Performance of the turbulence models in forced and mixed convection Turbulence model calculations have been performed for Re = 5300 and Pr = 0.71. The models were run until a hydrodynamically and thermally fully-developed state was attained (although this was not always the case for the Suga model, numerical difficulties sometimes preventing the attainment of a completely fully-developed flow). Mixed convection results are to be viewed in terms of departures from forced convection thermalhydraulics. It is appropriate, therefore, to make first some assessment of model performance in forced convection flow. In Table 1 below results are shown for forced convection Nusselt number, Nu0. The three eddy viscosity models are compared against the DNS data of You et al. (2003) and a correlation proposed by Kays and Leung (1963):
Nu0 = 0.022 Re0.8 Pr 0.5
(6)
Source You (DNS) LS model Suga model CI model Equation (6)
Nu0 18.3 17.4 18.3 18.9 17.7
% difference -4.9 0.0 +3.3 -3.3
Table 1: Nusselt numbers in forced convection (Re = 5300, Pr = 0.71) It is seen that the LS model result for Nu0 is around 5% lower than the direct simulation value, while the Suga model is in ‘exact’ agreement (to the accuracy quoted). The CI model and Kays and Leung correlation are respectively 3% higher and lower than the DNS. It is of some interest (and relevance to the present study) to compare different correlations of the Dittus-Boelter type. Kays and Leung report that Equation (6) has been used to correlate a large amount of data for heat transfer to gases; they show good agreement with their own air flow data for 104 ≤ Re ≤ 105. The Kays and Leung equation may be compared with the Dittus-Boelter expression in its generally quoted form (McAdams, 1954, p. 219):
Nu 0 = 0.023 Re 0.8 Pr 0.4
(7)
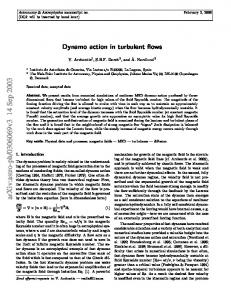
Equation (7) is ostensibly valid for Pr ≈ O(1)O(100). Considering Pr = 0.71, the equation returns values of Nu0 that are 8% higher than Equation (6). Finally, it is noted that if the coefficient of Equation (7) is reduced to 0.021 (specifically in order to correlate data for air flow; McAdams, footnote to p. 219), the resulting form agrees with Equation (6) to within around 1%. Turning next to mixed convection flows, Figure 1 provides an overview of heat transfer performance in ascending and descending flow. Nusselt number in mixed convection, Nu is normalized by the corresponding forced convection value evaluated at the same Reynolds and Prandtl numbers, and Nu/Nu0 is plotted against the buoyancy parameter, Equation (1). Present turbulence model results are shown together with the ascending and descending flow DNS data of You et al. (2003) and the experimental results of Steiner (1971), Carr et al. (1973) and Easby (1978). The first two experimental papers report results for ascending air flow, whereas Easby made measurements on a descending flow of nitrogen. In their direct simulations You et al. adopted the Boussinesq approximation and cast the governing equations in fully-developed form. The Reynolds and Prandtl numbers of the seven simulations (one forced convection and six mixed convection) were 5300 and 0.71. The conditions of the present EVM runs therefore match exactly those of the DNS, and comparisons between the present computations and the direct simulation data are effectively in terms of Nu/Nu0 vs.
1.8 1.6
Nu/Nu 0
1.4
Launder & Sharma Model (Asc. flow) Cotton & Ismael Model (Asc. flow) Suga Model (Asc. flow) Data of Steiner (1971) (Asc. flow) Data of Carr et al (1973) (Asc. flow) DNS of You et al (2003) (Asc. flow) Launder & Sharma Model (Desc. flow) Cotton & Ismael Model (Desc. flow) Suga Model (Desc. flow) Data of Easby (1978) (Desc. flow) DNS of You et al (2003) (Desc. flow)
1.2 1 0.8 0.6 0.4 0.01
0.1
Bo
1
10
Figure 1: Heat transfer impairment and enhancement in ascending and descending mixed convection flows. Gr (rather than Bo). By contrast, the three sets of experimental data all span a range of Reynolds number. It follows that some uncertainty is introduced into the comparisons because any functional dependence of Nu/Nu0 on Bo is not exact. A second uncertainty is introduced because the experimental works do not report values for forced convection Nusselt number. Measured values of mixed convection Nusselt number are consequently normalized using Nu0 determined from Equation (6) (with Pr = 0.71). All experimental heat transfer data will be affected to some extent by property variations. In practice, variable property effects are minor in the case of the ascending flow data of Carr et al., while temperature variations in Steiner’s test cases are sufficiently large to warrant the use of a full variable properties formulation in the computational simulation of the data (Cotton et al., 2001). Easby’s descending flow data are also subject to significant property variations. An immediately striking feature of the ascending flow portion of Figure 1 is the catastrophic onset of large-scale heat transfer impairment that occurs at Bo ≈ 0.2. Examining the EVM results, it is seen that the LS model is in closest agreement with the direct simulation data; the CI model returns a similar minimum level of heat transfer, but indicates that this is attained at higher Bo. Significantly lower levels of heat transfer impairment are returned by the Suga model and the onset of impairment is delayed considerably. In the ‘recovery’ region (Bo ≥ 0.5) the LS and CI models are in close agreement, but the Suga model yields lower Nu/Nu0.
Consideration of the descending flow region of Figure 1 reveals that there is little difference between the heat transfer enhancement levels of the Suga and CI models. The Nu/Nu0 vs. Bo curve of the LS model lies above the other two EVM schemes, while the three DNS points suggest a lower trajectory. Easby’s data for Nu/Nu0 do not asymptote to unity at low Bo. If, however, the ‘original’ form of the Dittus-Boelter correlation, Equation (7), is used to supply Nu0, the asymptotic behaviour is improved (Easby, 1978; Cotton, 1987). The implication that Nu0 from Equation (6) is too ‘low’ does not appear to be related to variable property effects since a temperature-ratio correction to Equation (6) or (7) of the form ( Tw / Tb ) n would serve to reduce forced convection Nusselt number (n ≈ -0.55; Kays and Perkins, 1973, p. 7163). Figures 2 and 3 give some indication of the different types of flow profile that result in the heat transfer levels observed in ascending mixed convection flows. The figures both show Reynolds shear stress: Figure 2 is for Bo = 0.18 (maximum impairment; the second ascending flow DNS point of Figure 1) and Figure 3 is for Bo = 0.50 (recovery; the final DNS point). It is seen that the DNS data of You et al. shown in Figure 2 indicate large-scale laminarization of the flow and a change in sign of the Reynolds stress in the core region. The reduction in stress levels is captured by the LS model which, in fact, indicates an almost complete laminarization of the near-wall flow. The Suga and CI models show relatively little departure from stress profiles characteristic of forced convection. Such contrasting behaviour between the turbulence models may be related di-
rectly to the differing heat transfer levels evident in Figure 1 at Bo = 0.18 and again reflects the suddenness with which flow laminarization and heat transfer impairment occur. Somewhat paradoxically, resolution of this highly sensitive thermal-hydraulic state does not, of itself, provide a well-posed test of a turbulence model since a slight re-tuning of a given parameterization could alter the outcome of a model test from apparent ‘success’ to ‘failure’.
3.2 A low Reynolds number modification to the buoyancy parameter As was noted above, the buoyancy parameter, Bo is generally quoted in the form given by Equation (1). Its origins lie in the analysis of Hall and Jackson (1969) who considered the reduction in total shear stress, τ that occurs in a heated ascending pipe flow due to the action of buoyancy. Launder (1986) subsequently considered a variety of phenomena that can give rise to a rapid reduction in shear stress over the near-wall region. Of particular interest here is Launder’s observation that the gradient of (appropriately non-dimensionalized) total shear stress in isothermal fully-developed pipe or channel flow can be sufficiently large to cause significant departures from ‘universal’ flow behaviour. Such steep gradients occur at low bulk Reynolds numbers, say Re ≤ 104, as may be demonstrated by combining a linear variation of shear stress across the pipe radius with the Blasius equation for local friction coefficient,
c f = 0.079 Re − 0.25 (Launder, 1986): ( dτ + / dy + )iso = − 10 Re − 0.875 Figure 2: Shear stress profile (Bo = 0.18).
(8)
where τ + = τ / τ w and the subscript ‘iso’ denotes isothermal (or forced convection) flow. Now, in an ascending mixed convection flow there is an additional shear stress gradient that arises in response to buoyancy forces. Approximate analysis along the lines developed by Hall and Jackson (1969) leads to an expression for the buoyancyinduced shear stress gradient, viz. ( dτ / dy )buoy = − β ρ g ( Tw − Tb ) , or equivalently
( dτ + / dy + )buoy = − β g ( T w − Tb ) ( ν / U τ3 ) .
A
second application of the Blasius equation then yields
( dτ + / dy + )buoy = − 125 β g ( T w − Tb ) × ( D 3 / ν 2 ) Re − 2.625 (9) Figure 3: Shear stress profile (Bo = 0.50). The DNS data plotted in Figure 3 continue to show a modest level of Reynolds shear stress in the near-wall region, but increased stress levels in the core flow. The LS and CI models capture the general trends of the data, but fail to resolve the detail of the near-wall stress distribution. It appears that the Suga model is transitional between the laminarization and recovery stages. At this level of buoyancy influence the DNS data and three turbulence models give very similar levels of Nu/Nu0 (Figure 1), despite the differences evident in Figure 3. Absolute levels of nearwall Reynolds stress are low and nuances in the profiles might be expected to have a limited effect on heat transfer; also different turbulence models will yield differing patterns of convection, possibly compensating for variations in thermal diffusivity.
Summation of Equations (8) and (9) gives the overall stress gradient, dτ + / dy + . Introduction of the definitions of Grashof and Nusselt number allows this overall gradient to be expressed as
dτ + / dy + = − 10 Re − 0.875 − 125 ( Gr / Nu ) Re − 2.625 (10) Adopting Equation (7) for Nu in order to conform with the analysis of Cotton (1987), and taking mixedconvection-related changes to Nusselt number to be of second order importance in the context of the present development, Equation (10) may be re-written as
dτ + / dy + = − 10 Re − 0.875 − 5.4 × 10 3 Gr /(Re 3.425 Pr 0.4 ) (11)
Multiplication of Equation (11) by a factor of − 0.4
− 15 Pr yields the conventional buoyancy parameter grouping of Equation (1) as the final term: − 15 Pr − 0.4 dτ + / dy + = 150 Re − 0.875 Pr − 0.4 + 8 × 10 4 Gr /(Re 3.425 Pr 0.8 ) (12)
tween the overall stress gradient term, or equivalently the conventional buoyancy parameter, and the first term on the right of Equation (12). (Naturally Equation (8) is recovered from Equation (12) if buoyancy effects are absent.) Denoting the low-Reynoldsnumber re-interpretation of the group as ‘Bo_LRe’, it follows that this new quantity is related to the conventional buoyancy parameter as follows:
Bo _ L Re = Bo − 150 Re − 0.875 Pr − 0.4
(a)
(13)
Clearly Bo_LRe will asymptote to Bo at high Reynolds numbers. In order to examine the effect of adopting Equation (13) as an alternative to Equation (1), the LS model was used to generate a set of ascending mixed convection runs for 5000 ≤ Re 15000 (Pr was fixed at 0.71). The results are presented in Figures 4(a) and (b) which show Nu/Nu0 plotted against Bo and Bo_LRe, respectively. Use of the modified buoyancy parameter is seen to produce a better collapse of the family of curves at lower levels of buoyancy influence (i.e. to the left of the maximum impairment point). The degree of collapse is actually worsened at higher levels of buoyancy influence, and it is certainly the case that the analysis leading to Equation (8) (which assumes a linear variation of total shear stress) will no longer be valid. At such buoyancy levels the complex processes of heat transfer recovery are related to velocity profile distortion and shearproduction of turbulence in both the near-wall and core regions (cf. Figure 3). It appears, nonetheless, that the original grouping of Equation (1) is adequate to collapse curves of Nu/Nu0 obtained at different Re, even though the physical picture upon which the group is based will no longer strictly pertain.
4 Concluding remarks (b) Figure 4: Alternative definitions of the buoyancy parameter in ascending flow: (a) Bo; (b) Bo_LRe. The left hand side of Equation (12) is proportional to the overall total shear stress gradient that arises from a combination of low Reynolds number and mixed convection effects. However, in Hall and Jackson’s original analysis attention was limited to changes in the stress gradient attributable to buoyancy effects; in other words the first term on the right of Equation (12) is omitted and the conventional buoyancy parameter effectively equates to
− 15 Pr − 0.4 dτ + / dy + . In the present extended analysis, by contrast, the second term on the right of Equation (12) assumes a modified role as a ‘lowReynolds-number buoyancy parameter’; it might be best interpreted as representing the difference be-
Ascending and descending turbulent mixed convection pipe flows have been computed using the Launder-Sharma (1974; ‘LS’), Craft, Launder and Suga (1996; ‘Suga’) and Cotton-Ismael (1998, ‘CI’) turbulence models. Comparison with the DNS data of You et al. (2003) shows that the LS model best captures the phenomenon of heat transfer impairment (characterized as Nu/Nu0) that occurs in the ascending flow case. It is necessary, however, to sound a note of caution in relation to the evaluation of turbulence model performance by comparison with the maximum impairment condition: this is because of the extreme sensitivity to flow conditions of the ‘catastrophic’ laminarization process that is the cause of large-scale heat transfer impairment. A low Reynolds number modification of the buoyancy parameter (‘Bo_LRe’) is advanced and is shown to lead to a better collapse of computed results for Nu/Nu0 at lower levels of buoyancy influence; at higher levels the original form of Hall and Jackson (1969) performs better. Work is in progress to refine the analysis.
Acknowledgement This work was carried out as part of the ‘Towards a Sustainable Energy Economy’ (TSEC) programme ‘Keeping the Nuclear Option Open’ (KNOO) and as such we are grateful to the UK Engineering and Physical Sciences Research Council for funding under grant EP/C549465/1.
Nomenclature cf cp D Gr k Nu p Pr
local friction coefficient, τw/(1/2ρUb2) specific heat capacity at constant pressure pipe diameter Grashof number, β g q& D 4 /( λ ν 2 ) turbulent kinetic energy Nusselt number, q& D /( λ [ Tw − Tb ]) piezometric pressure Prandtl number, c p µ / λ
q& Re T Ub
Reynolds number, U b D / ν temperature bulk velocity
Uτ y y+
friction velocity, ( τ w / ρ )0.5 wall distance yU τ / ν
wall heat flux
Greek letters β coefficient of volumetric expansion ε rate of dissipation of k ~ ε modified dissipation rate variable, ~ ε = ε − 2 ν ( ∂k 1 / 2 / ∂x j ) ( ∂k 1 / 2 / ∂x j )
λ µ ν ρ
thermal conductivity dynamic viscosity kinematic viscosity, µ/ρ density
Subscripts b bulk w wall Other symbols are defined in the text.
References Carr, A.D., Connor, M.A. and Buhr, H.O (1973), Velocity, temperature and turbulence measurements in air for pipe flow with combined free and forced convection, J. Heat Transfer, Vol. 95, pp. 445-452. Cotton, M.A. (1987), Theoretical Studies of Mixed Convection in Vertical Tubes, Ph.D. Thesis, University of Manchester. Cotton, M.A. and Ismael, J.O. (1998), A strain parameter turbulence model and its application to homogeneous and thin shear flows, Int. J. Heat Fluid Flow, Vol. 19, pp. 326-337.
Cotton, M.A., Ismael, J.O. and Kirwin, P.J. (2001), Computations of post-trip reactor core thermal hydraulics using a strain parameter turbulence model, Nuclear Engineering and Design, Vol. 208, pp. 5166. Craft, T.J., Launder, B.E. and Suga, K. (1996), Development and application of a cubic eddy-viscosity model of turbulence, Int. J. Heat Fluid Flow, Vol. 17. pp. 108-115. Easby, J.P. (1978), The effect of buoyancy on flow and heat transfer for a gas passing down a vertical pipe at low Reynolds numbers, Int. J. Heat Mass Transfer, Vol. 21, pp. 791-801. Hall, W.B. and Jackson, J.D. (1969), Laminarization of a turbulent pipe flow by buoyancy forces, ASME Paper 69-HT-55. Jackson, J.D. (2006), Studies of buoyancy-influenced turbulent flow and heat transfer in vertical passages, Keynote lecture, Proc. 13th Int. Heat Transfer Conf., Sydney, August 2006. Jackson, J.D., Cotton, M.A. and Axcell, B.P. (1989), Studies of mixed convection in vertical tubes, Int. J. Heat Fluid Flow, Vol. 10, pp. 2-15. Kays, W.M. and Leung, E.Y. (1963), Heat transfer in annular passages – hydrodynamically developed turbulent flow with arbitrarily prescribed heat flux, Int. J. Heat Mass Transfer, Vol. 6, pp. 537-557. Kays, W.M. and Perkins, H.C. (1973), Forced Convection, Internal Flow in Ducts, Section 7 of Handbook of Heat Transfer, Eds. Rohsenow, W.M. and Hartnett, J.P., McGraw-Hill, New York. Launder, B.E. (1986), Low-Reynolds-number turbulence near walls, Dept. Mechanical Engineering, UMIST (now School of MACE, University of Manchester), Report TFD/86/4. Launder, B.E. and Sharma, B.I. (1974), Application of the energy dissipation model of turbulence to the calculation of flow near a spinning disc, Lett. Heat Mass Transfer, Vol. 1, pp. 131-138. McAdams, W.H. (1954), Heat Transmission, 3rd edn., McGraw-Hill, New York. Petukhov, B.S. and Polyakov, A.F. (1988), Heat Transfer in Turbulent Mixed Convection, Ed. Launder, B.E., Hemisphere, Bristol, Pennsylvania. Steiner, A. (1971), On the reverse transition of a turbulent flow under the action of buoyancy forces, J. Fluid Mech., Vol. 47, pp. 503-512. You, J., Yoo, J.Y. and Choi, H. (2003), Direct numerical simulation of heated vertical air flows in fully developed mixed convection, Int. J. Heat Mass Transfer, Vol. 46, pp. 1613-1627.