i(x; t) = hui(x; t)i (i = 1;2;3) of u are constant and equal ... ?ij(x; t;x0; t0) = hui(x; t)uj(x0; t0)i hu2i ..... putational uid dynamics known as Large Eddie Simulation.
Turbulent Wind Fields for Gaseous Phenomena Jos Stam Eugene Fiume0 Department of Computer Science University of Toronto 10 King's College Circle Toronto, Canada, M5S 1A4
Abstract
The realistic depiction of smoke, steam, mist and water reacting to a turbulent eld such as wind is an attractive and challenging problem. Its solution requires interlocking models for turbulent elds, gaseous ow, and realistic illumination. We present a model for turbulent wind ow having a deterministic component to specify large-scale behaviour, and a stochastic component to model turbulent small-scale behaviour. The small-scale component is generated using space-time Fourier synthesis. Turbulent wind elds can be superposed interactively to create subtle behaviour. An advection-di�usion model is used to animate particle-based gaseous phenomena embedded in a wind eld, and we derive an e�cient physically-based illumination model for rendering the system. Because the number of particles can be quite large, we present a clustering algorithm for e�cient animation and rendering. CR Categories and Subject Descriptors: I.3.7 [Computer Graphics]: Three-Dimensional Graphics and Realism; I.3.3 [Computer Graphics]: Picture/Image Generation; G.3 [Probability and Statistics]: Probabilistic algorithms. Additional keywords and phrases: turbulent ow, stochastic modelling, Kolmogorov energy spectrum and cascade, transport model of illumination, Fourier synthesis, advection-di�usion, gaseous phenomena.
1 Introduction
We have come to appreciate the central role that irregularity plays in modelling the shape of natural objects. The analogue for wind and uids is turbulence, and its e�ects are no less essential to the realistic portrayal of gaseous natural phenomena: curling wisps of smoke, mist blowing across a eld, car exhaust, an aerosol spray, steam rising from a co�ee mug, clouds forming and moving across the sky, the fall of leaves, a swirl of dust in a room, a hurricane. These e�ects are caused by the interaction of objects with a wind
0 The nancial support of the Natural Sciences and Engineering Research Council of Canada and of the Information Technology Research Centre of Ontario is gratefully acknowledged. The helpful suggestions of the referees are greatly appreciated.
velocity eld. Modelling the e�ect of wind requires that we model both the wind eld and this interaction. Both Sims [14] and Wejchert and Haumann [17] model a wind eld as the superposition of deterministic elds. Modelling a visually convincing turbulent wind eld this way is painstaking. The greatest success in this direction was the particle-based \Blowing in the Wind" animation by Reeves and Blau [10]. Stochastic modelling is a natural alternative strategy. In [13], Shinya and Fournier describe an approach developed independently of ours but which has some similarities. They employ stochastic processes and Fourier synthesis to derive a wind eld in spatiotemporal frequency domain, and invert the result to get a periodic space-time wind eld. We employ the same paradigm, but our model and application are quite di�erent. Although both wind models can be applied to a wide range of phenomena, and [13] demonstrates this very well, their main concern is with coupling the wind model to macroscopic physical models of rigid or deformable objects, whereas we are mostly concerned with microscopic interaction with gaseous and uid phenomena. Consequently, our model of turbulence is dissimilar: Shinya and Fournier assume a constant deterministic temporal evolution (Taylor Hypothesis), while for us temporal evolution is also a stochastic process. Our wind model also di�ers in that an animator has direct control over deterministic and stochastic components of a eld. In this paper, turbulent wind elds are modelled as stochastic processes. The model is empirically plausible[5]. A wind eld is generated from large-scale motion and from the statistical characteristics of the small turbulent motion, both freely chosen by an animator. This is analogous to modelling rough terrain by providing the global shape as given by a set of height samples, and the desired roughness of the terrain [2]. The large scale of the wind eld will be modelled using simple wind eld primitives [14, 17]. The small scale of the wind eld will be modelled as a three-dimensional random vector eld varying over space and time. This eld is generated using inverse an FFT method[16] that we have generalized to a vector eld. The resulting wind eld has two desirable properties. First, it is periodic and is thus de ned for any point in space-time. Second, it is generated on a discrete lattice and can be interactively calculated using four-linear interpolation. Gases have been modelled in several ways. Ebert models a gas as a solid texture. With some trial-and-error (and in our experience, signi cant human e�ort), realistic animations were obtained[1]. Sakas models a gas as a 3-D random density eld, generating it using spectral synthe-
sis [12]. While spectral synthesis is useful in generating turbulent wind elds, it is not ideal for directly generating density elds: visual artifacts appear due to the periodicity of the eld and the entire density eld must be computed at once. The temporal evolution of the density eld is limited to simple translations. Both of the above models are computationally expensive to visualize, and hence interactive modelling is not feasible. Using physically-based turbulence to animate density elds is mathematically nontrivial, but we shall show that this can be done e�ciently. We model gases as density distributions of particles. The evolution of a density distribution within our wind eld is described by an advection-di�usion equation. We e�ciently solve this equation by modelling the gas as a \fuzzy blobby" with time varying parameters. A fast ray-tracing algorithm is used, based on a front to back single-scattering illumination model, to render such a density distribution.
2 A Multiple-Scale Wind Field Model
Physically, wind elds are the result of the variations of the velocity u(x; t) and the pressure p(x; t) of a uid (including air) over space and time. These variations are caused by various forces: external forces F applied to the uid, nonlinear interactions between di�erent modes of the velocity eld and viscous dissipation at a rate � . By summing these forces and equating them to the acceleration of the uid we obtain the Navier-Stokes equations: @ u = ?(u � r)u ? 1 rp + � r2 u + F; (1)
@t
�f
where �f is the density of the uid. If the velocities of the uid are much smaller than the speed of sound, we can assume that the uid is incompressible [5], i.e., r � u = 0: (2) When proper initial conditions and boundary conditions are speci ed, Eqs. 1 and 2 are su�cient to solve for the velocity eld and the pressure of the uid for any time instant. The above equations could be used to animate realistic wind elds. One would rst specify the physical properties of the uid that make up the model, including an initial velocity eld and boundary conditions. One would then control the uid motion by applying external forces. Realistic wind elds would be obtained by solving the NavierStokes equations as needed. This is entirely akin to the control problem for articulated gures, and it shares the same di�culties. First, a desired e�ect is hard to achieve by \programming" it using only external forces. Second, the non-linearities present in the Navier-Stokes equations make them hard to solve numerically, especially in the presence of turbulence (low viscosity). Linearizing the equations can improve stability and e�ciency, which has been done by Kass and Miller to model the surface of water [4]. This results in highly viscous uids that do not exhibit turbulence. We shall model a turbulent wind eld by separating it into a large-scale component ul and a small scale component us. The large-scale term is composed of simple wind elds, resulting in very viscous uids. The small-scale term is a random eld. We shall make a useful but physically implausible assumption that the components are independent, that is, that large scales do not a�ect the small scales and vice-versa. Hence we will write u(x; t) = ul (x; t) + us(x; t): (3) This assumption permits the real-time simulation and independent control of both large-scale and small-scale e�ects.
The results, as we shall see, are quite convincing. We shall further discuss this assumption in our conclusions.
3 Small Scale Modelling 3.1 Random Vector Fields
In this section we will denote the small scale component us simply by u. It is de ned as a random space-time vector eld, a function that assigns a random velocity to each point (x; t) in space-time [15]. We shall invoke the standard Gaussian assumption [7]: that the random vector eld is entirely determined by its second-order moments. These moments are obtained by statistically averaging (denoted by h i) components of the evolving random velocity eld. We will assume that the mean values of each component �i (x; t) = hui (x; t)i (i = 1; 2; 3) of u are constant and equal to zero. The cross-correlation between di�erent components of the velocity eld at two di�erent points in space-time (x; t) and (x0 ; t0 ) are given by the functions 0 0 ? (x; t; x0 ; t0 ) = hui (x; t)uj (x ; t )i ; i; j = 1; 2; 3: (4) ij
hu2 i Where hu2 i = hu21 + u22 + u23 i denotes the variance of the
velocity eld and physically is equal to twice the kinetic energy of the eld. We will assume that the velocity eld is homogeneous in space and stationary in time, which means that the cross-correlation only depends on the di�erence0 r = x0 ? x between the two points and0 the di�erence � = t ? t between the two times: ?ij (x; t; x ; t0 ) = ?ij (r; � ). Homogeneous velocity elds have a corresponding representation in spatial-frequency domain via a spatial Fourier transform. Intuitively this transformation can be thought of as a decomposition of the velocity eld into \eddies" of di�erent sizes: large eddies correspond to small spatial frequencies and conversely for small eddies. The stationarity of the velocity eld allows it to be represented in frequency domain by a temporal Fourier transform. We will denote spatial frequencies by k = (k1 ; k2 ; k3 ) and temporal frequencies by !.1 We represent the velocity eld in frequency domain via the usual Fourier transform:
u^ (k; !) =
Z Z
u(x; t) exp(?ik � x ? i!t) dxdt: (5)
Writing the transform in this manner facilitates its separation into spatial and temporal frequency components. The Fourier-domain equivalent of the cross-correlation functions are the cross-spectral density functions: �ij (k; !) = hu^�i (k; !)^uj (k; !)i; i; j = 1; 2; 3; (6) where the \�" denotes the complex conjugation. Conveniently for us, the cross-spectral density functions and the cross-correlation functions are Fourier-transform pairs [15]. Finally, we assume that the velocity eld is spatially isotropic, meaning that the cross-correlation functions are invariant under rotations. Thus the cross-correlation functions only depend on the distance r = krk between two points. Isotropy and incompressibility (Eq. 2) imply that the cross-spectral density functions are of the form [5] k; !) (k2 � ? k k ); i; j = 1; 2; 3; (7) �ij (k; !) = E4(�k ij i j 4 1 In the turbulence literature, the term wave number is often used instead of spatial frequency. We will use spatial frequency, which is more common in computer graphics, but we shall denote spatial frequencies by k, reserving the letter ! for temporal frequencies.
where �ij is the Kronecker delta, k is the length of the spatial frequency k and E is a positive function called the energy spectrum function. Its physical interpretation is that it gives the contribution of all spatial frequencies of length k and frequency ! to the total kinetic energy of the velocity eld: Z Z 1 hu2 i = 1 1 E (k; !) d! dk: (8) 2 0 ?1
3.2 The Energy Spectrum Function
Eq. 7 states that the structure of a velocity eld (via its cross-spectral density functions) is entirely determined by its energy spectrum function. In other words, an animator can control the qualities of turbulent motion by specifying the shape of the energy spectrum. This function can be arbitrary as long as the integral of Eq. 8 exists. In the turbulence literature one can nd a wide variety of di�erent energy spectra for various phenomena. These models are either determined from experimental data or obtained from simplifying assumptions about the uid. The bestknown example of theRlatter turbulence that has reached 1 E (for a steady-state (i.e., ?1 k; !) d! ! E (k)) is the Kolmogorov energy spectrum [5]:
EK (k) =
�
0 if k < kinertial 1:5 �3=2 k?5=2 otherwise
(9)
This spectrum results from an energy cascade, where energy introduced at frequency kinertial is propagated to higher frequencies at a constant rate �. Instead of invoking Taylor's Hypothesis [13] we model the temporal frequency dependence of the energy spectrum function E (k; !) by multiplying the Kolmogorov energy spectrum EK (k) by a temporal spread function Gk (!) subject to: Z
1
?1
E (k; !) d! = EK (k)
Z
1
?1
Gk (!) d! = EK (k): (10)
This guarantees conservation of kinetic energy (cf. Eq. 8). Furthermore, we want the small eddies to be less correlated in time than the large eddies. Spatially, this means that small eddies spin, ebb and ow more quickly than large eddies; this behaviour can be observed when watching a water stream or smoke rising from a cigarette. We can achieve this behaviour by setting Gk to a Gaussian with a standard deviation proportional to k: �
�
2 (11) Gk (!) = p 1 exp ? 2k!2 �2 : 2� k� Indeed, for large eddies (as k ! 0), Gk is a spike at the origin, corresponding to the spectral distribution of a highlycorrelated signal; for small eddies (as k ! 1) the spectral
density becomes constant, denoting an uncorrelated signal.
3.3 Generating the Small Scale Component
We now describe an algorithm to generate a random velocity eld having speci ed cross-spectral density functions �ij . The algorithm is a generalization of Voss's inverse FFT method[16]. The idea is to lter an uncorrelated white noise velocity eld in the Fourier domain, and then to take an inverse Fourier transform to obtain the desired random velocity eld. The challenge is thus to nd the right lter such that the resulting velocity eld has the desired statistics. We rst compute the velocity eld in the frequency domain for discrete spatial frequencies (i; j; k) and temporal
frequencies l.2 Let us assume that the discretization is uniform and that there are N samples per dimension. Then the discrete Fourier transform (DFT) of the velocity eld u^ i;j;k;l is de ned on a discrete lattice of size 3N 4 . To ensure that the resulting space-time velocity eld is real valued, the elements of the DFT must satisfy the following symmetries: u^ i;j;k;l = u^ �N ?i;N ?j;N ?k;N ?l, where the indices are taken modulo N , i.e., N ? 0 = 0[9]. In the special case when the indices on both sides of the equality are identical (e.g., u^ N=2;0;N=2;N=2 ) we have to set the imaginary parts of u^ i;j;k;l to zero. The following algorithm generates a DFT with the required properties. for i; j; k; l in f0; . . . ; N=2g do compute u^ i;j;k;l , u^ N ?i;j;k;l , u^ i;N ?j;k;l , u^ i;j;N ?k;l , u^ i;j;k;N ?l , u^ N ?i;N ?j;k;l , u^ N ?i;j;N ?k;l , u^ N ?i;j;k;N ?l u^ N ?i;N ?j;N ?k;N ?l =� u^ �i;j;k;l u^ i;N ?j;N ?k;N ?l = u^ N� ?i;j;k;l u^ N ?i;j;N ?k;N ?l = u^ i;N ?j;k;l u^ N ?i;N ?j;k;N ?l = u^ �i;j;N ?k;l u^ N ?i;N ?j;N ?k;l =� u^ �i;j;k;N ?l u^ i;j;N ?k;N ?l = u^ N� ?i;N ?j;k;l u^ i;N ?j;k;N ?l = u^ N� ?i;j;N ?k;l u^ i;N ?j;N ?k;l = u^ N ?i;j;k;N ?l end for for i; j; k; l in f0; N=2g do set imaginary parts of u^ i;j;k;l to zero end for To compute each element u^ a;b;c;d in the rst loop, three independent complex random variables Xm = rm e2�i�m (m = 1; 2; 3) are generated with normally distributed gaussian random amplitudes rm and with uniformly distributed random phases �m . The components of that element are then calculated as (^u1 )a;b;c;d = h^ 11 ((i; j; k); l)X1 ; (^u2 )a;b;c;d = h^ 21 ((i; j; k); l)X1 + h^ 22 ((i; j;k); l)X2 ; (^u3 )a;b;c;d = h^ 31 ((i; j; k); l)X1 + h^ 32 ((i; j;k); l)X2 + h^ 33 ((i; j; k); l)X3 : The functions h^ mn are derived from the cross-spectral density functions as shown in Appendix A (Eq. 21). The velocity eld is then obtained by taking three inverse DFT's: u1 = invFFT4D(^u1 ) u2 = invFFT4D(^u2 ) u3 = invFFT4D(^u3 ): The resulting velocity eld is de ned on a discrete lattice and is periodic in space and time. Thus even a small lattice de nes a eld everywhere in space-time. The spacing of this grid determines the smallest scale of the turbulence.
4 Animation of Gaseous Phenomena
Physically a gas is composed of many particles. We could therefore animate a gas by moving its particles about the wind eld, but this would require a vast set of particles. We shall instead consider the density �(x; t) of particles at space-time point (x; t). Assuming that the particles have no e�ect on the wind eld, the evolution of the density distribution is given by an advection-di�usion (A-D) equation 2 The choice of i; j; k here as indices should not be confused with their di�erent use above.
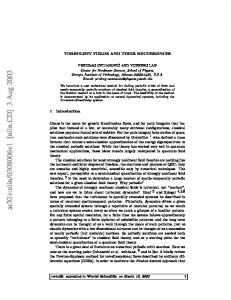
Figure 1: Evolution of a density distribution [5] to which we have added a dissipation term:
@� = ?ur� + �r2 � ? ��: @t
s0 s1 (12)
The rst term on the right hand side is the advection term that accounts for the e�ects of the wind eld on the density. The second term accounts for molecular di�usion at rate �. This term can also be used to model turbulent di�usion from scales smaller than the smallest scale of the modelled turbulence. The third term accounts for dissipation of density at rate �. Since the velocity u is given, the equation is linear in � and can be solved by nite di�erences. The density distribution is then resolved on a nite grid and can be rendered using an e�cient voxel-based volume renderer [1, 6]. Figure 1 depicts the evolution of an initially square distribution evolving under the in uence of a two-dimensional wind eld calculated using a standard PDE solver [9]. Computations for four-dimensional wind elds become rapidly prohibitive both in computation time and memory. To obtain tractable animations we propose an alternative strategy. We shall assume that the density distribution is a weighted sum of a simple distribution f :
�(x; t) =
n X i=1
mi (t)f (kx ? xi (t)k; t ? ti ) =
n X i=1
�i (x; t): (13)
In other words the density distribution is a \fuzzy blobby" with time-dependent eld function f , where xi (t) is the centre of mass, ti is the time at which the \blob" �i is created and mi (t) is its mass. If we suppose that f is a gaussian distribution with a standard deviation �0 much smaller than the smallest scale of the turbulent wind eld, the wind eld can be assumed to be constant on each blob. The advection term therefore only moves the blob, but does not deform its shape. The movement of the blob is hence given by integrating its centre of mass over the wind eld:
xi (t) = xi (ti ) +
Z t
ti
u(xi (s); s) ds;
i = 1; ��� ; n: (14)
The deformation of the shape of the blob is given by the di�usion term. Here we note that the di�usion at rate � after time t ? ti of a gaussian with variance �02 is equivalent to convolving a gaussian of variance �(t ? ti ) with a gaussian of variance �02 (cf. [18]). Gaussians are closed under convolution, and the resulting gaussian has variance �i2 (t) = �02 + �(t ? ti ): �
�
r2 (15) f (r; t ? ti ) = 32 3 exp ? 2�2 (t) : (2�) �i (t) i Thus f di�uses outward with variance �i2 (t) that increases with t. The normalization factor (2�) 32 �i3 (t) guarantees 1
that the mass of the blob is invariant under di�usion. Once the variance of a blob becomes comparable to the smallest
s2 s3
s4 s5 s6 s7
s8 s9 s10s11
Figure 2: Subdivision of ray into intervals scale of the turbulent wind eld we can replace it by smaller blobs and distribute the mass equally among them. The effect of the dissipation term is an exponential decay of the masses over time: mi (t) = m0 exp (?�(t ? ti )) : (16)
5 E�cient Rendering of Gas
In conventional ray-tracing, light-object interactions are only computed at object boundaries. Hence light travelling along a ray is only modi ed at its endpoints. In the presence of a participating medium, the light carried by a ray can be attenuated and increased: attenuation is caused by light absorbed and scattered away by the gas; an increase may arise from light scattered in the direction of the ray from other directions and by self-emission of the gas. These e�ects can be included into a standard ray-tracer, by modifying the intensity value returned along any ray in the ray-tree. For each such ray we rst determine which blobs have domains intersecting the ray (in practice we truncate the domain of each gaussian). For each such blob we store in a sorted list the parameter value s both for the entry and exit points of the ray. This subdivides the ray into N disjoint intervals Ii = [si; si+1 ] (i = 0; ��� ; N ? 1) as illustrated in Figure 2, with s0 = 0 being the origin of the ray and the si being points of ray/blob intersections. Once the ordered list of blobs intersecting the ray is calculated, the intensity of light C reaching the origin of the ray is computed by shading the list from front to back [6]: �total = 1 C=0 for i = 1 to N ? 2 do C = C + �total (1 ? �i )Ci �total = �total �i end for C = C + �totalCN , Here, �i is the transparency of the density distribution on interval Ii , and Ci is the intensity of light emitted on that interval by the density distribution. These values are de ned in Appendix B, in which we also derive the illumination model. CN is the intensity returned by the standard ray-tracer. In case the ray is cast to determine a shadow, only �total has to be returned. The transparency along an interval Ii due to a single blob is a function only of the distance of the ray to the centre of the blob and the endpoints si and si+1 of the interval as shown in Figure 3. The exact relationship and an e�cient way to compute them is given in Appendix B. The transparency �i of the interval is then computed by
s
ray
si+1 rmin smin distance si
Figure 3: Calculation of transparencies �i combining the transparency values calculated for each blob that intersects the ray along that interval. Instead of testing separately for an intersection of the ray with each blob, we traverse a tree data structure of bounding spheres. The tree is constructed prior to rendering a frame as follows. First all the blobs are put in a linked list. The tree is then constructed by the following algorithm: while list has at least two elements do for each blob b in the0 list do search for blob b closest to b remove b0 from list00 create new0 blob b which bounds b and b0 00 set b and b to children of b replace b by b00 in list end for end while There are some obvious optimizations that can be made to this brute-force algorithm, such as non-binary blob groupings and the use of a k-d tree to accelerate the search, but the cost of ray tracing overwhelms even brute-force preprocessing cost. On average, the use of the tree data structure has reduced rendering times by an order of magnitude. The tree can be thought of as a multi-scale representation of the density distribution and hence could be used to render the distribution at di�erent levels of detail.
6 Interactive Field Modelling/Results
In our implementation, modelling wind elds and their effects consists of several steps. First the energy spectrum for the spatial component of the small-scale turbulence is speci ed by providing numerical values for the rate � and the inertial frequency kinertial of the Kolmogorov energy cascade. The standard deviation � for the temporal component of the energy spectrum is also speci ed. The overall energy spectrum (cf. Section 3.2) is the product of the temporal and spatial (Kolmogorov) energy spectra. A 4-D vector eld is then generated (cf. Section 3.3) which can be placed in a library (although its computation is swift). We have developed an interactive animation system in which an animator can design a complex wind eld and visualize its e�ect on a gas density. Complex wind elds are formed by the superposition of small-scale turbulence with large-scale elds such as directional, spherical, and exponentially decaying elds. The user is also able to change the grid spacing of the small scale independently in each component of space and time, allowing the speci cation of non-homogeneous elds. This also permits the same prototypical small-scale eld to be given di�erent behaviours in
di�erent contexts (which is precisely what has been for the images shown below). Our animation system also simulates the e�ect of a wind eld on a gas. A speci c gaseous phenomenon is speci ed as a particle system characterized by the following values: the region over which blobs of particles are born, their birth rate, and the initial standard deviation and the initial mass of each blob. During a simulation, the system introduces blobs at the given rate, animates their motion by advection, modi es the standard deviations by di�usion and the masses by dissipation, as described in Section 4. Additionally, particles can be given illumination parameters such as a colour. In this modelling step the centre of each blob is depicted (with intensity modulated by parameters such as duration), but positions and other data can be piped into a high-quality renderer for image synthesis. About 6; 000 particles can be animated in real time on an SGI Indigo. The parameters needed for rendering include (Appendix B): the extinction coe�cient �t , which describes the decay of light in inverse proportion to distance; the albedo
2 [0; 1], which de nes the proportion of light scattered at a given point; the phase function p, giving the spherical distribution of scattered light; and self-emission Q, which is the amount of light emitted by a blob at a given position. The illumination computation for gas densities at a resolution of 640 � 480 typically requires from one to ten minutes, although 1-2 hour computations are possible when rendering scenes of high optical complexity. For the images presented below, we have assumed that the phase function is constant and we have ignored shadows cast onto the density distribution for all but one image sequence. In all simulations the same statistical parameters were used for the small scale component: � = 1, kinertial = 4 and � = 1. Steam from a mug: One global directional wind eld was used to model the rising of the steam due to thermals. The particles were generated uniformly on a disk. Psychedelic steam: Three trails of smoke of di�erent colours were combined. As for the steam we used a directional wind eld, this time tilted in the direction of the teapot spout. Particles were again generated on small disks. Cigarette smoke: Two smoke trails originating from the tip of a cigarette are derived from the similar small-scale turbulence as the steam with a directional heat source. Interaction of a sphere with smoke: This simulation shows how objects can interact with our wind eld model. Instead of testing for collision of particles with the objects, we de ne a repulsion eld around each object. We modelled the repulsion force by a radial potential eld. The sphere is moved along a path given by a spline curve. Note that this image sequence depicts self-shadowing. Three-dimensional morphing: The cylindrical range data of two human heads was converted into two sets of blobs and input to the animation system. The scene was illuminated by setting the self-illumination parameter (Q in Eq. 24) of each blob to the illumination given by the range data. The albedo was set to zero and dissipation was set to a large value to allow rapid dissolution of each set of blobs (with one run in reverse).
7 Conclusions and Extensions
We have presented a new model for the visual simulation of gaseous phenomena in turbulent wind elds. Our model provides an animator with control over both the large-scale motion and the statistical features of the small-scale turbulence. This model has been successfully applied to the
animation of gaseous phenomena. Our model, however, can be applied to many other phenomena resulting from the interactions of objects with a wind eld. For example, the wind eld model can be included in any existing physically-based animation system. Our model can in fact generate a random vector eld of any dimension, not only three-dimensional vector elds with a four dimensional domain. The derivation of the algorithm can be adapted in a straightforward manner. Our fast rendering algorithm can be used to visualize sparsely sampled data. The rendering of the heads in the morphing animation is a good example. Also our animation system could be used to visualize wind elds calculated by direct numerical simulation for uid dynamics applications. There are many other extensions to our model that we will explore in future research. We have assumed that the large scale motions of the wind do not modify the small turbulent scale. This is implausible. One possible solution is to warp the domain of the turbulent scale according to the large scales. We would require the use of a global deformation algorithm. Also it is possible to use a physical model for the large scales. A numerical technique in computational uid dynamics known as Large Eddie Simulation (LES) solves the Navier-Stokes equations on a coarse grid using a statistical model for the small scales [11]. However, a physical simulation might not be relevant in computer graphics when a speci c behaviour is intended.
chosen arbitrarily. If we set h^ 12 = h^ 13 = h^ 23 = 0, then the system of equations given by Eq. 20 becomes diagonal and can easily be solved as follows. ^h11 = p�11 ; ^h21 = �21 ; h^ 31 = �31 ^h11 ^h11 q ^ ^ ^h22 = �22 ? ^h221 ; ^h32 = �32 ?^ h31 h21 h22 q ^h33 = �33 ? ^h231 ? ^h232 : (21)
A white noise velocity eld has cross-spectral density functions de ned by:3 �wkl (k; !) = hw^k� (k; !)w^l (k; !)i = �kl : (17) A random eld with cross-spectral density functions �ij can be obtained by cross-convolving this white noise with a set of deterministic kernels hkl :
and �t is the extinction coe�cient, and is the albedo. The term L(xs ) is the contribution due to Nl light sources:
A Inverse FFT Method Derivation
uk (x; t) =
3 Z X l=1
R3
Z
1
?1
hkl (x?y; t?s)wl (y; s) ds dy; (18)
which in the Fourier domain becomes
u^k (k; !) =
3 X l=1
^hkl (k; !)w^l(k; !):
(19)
We obtain an equation for the transformed kernels h^ kl in terms of the cross-spectral density functions �ij by inserting the expressions for the Fourier velocity components u^i and u^j given by Eq. 19 into the de nition of the cross-spectral density function �ij (see Eq. 6). �ij (k; !) = hu^�i (k; !)^uj (k; !)i = =
3 X 3 X k=1 l=1
3 X n=1
^h�ik (k; !)^hjk (k; !)�wkl (k; !)
h^ �in (k; !)^hjn (k; !):
(20)
We thus have 9 equations for the 9 kernels ^hkl in terms of the cross-spectral density functions. Because of the symmetry of the cross-spectral density functions (�ij = �ji ), only 6 of these kernels are independent and three kernels can be 3 All subscripted indices in this appendix take on the values 1; 2; 3.
B Illumination Model
Consider a ray xs = O + sD, with origin O and direction D. Let CN be the intensity of light reaching O along the ray from point xb in the absence of a density distribution (i.e., given by a conventional ray-tracer). If we ignore multiple scattering e�ects, then the illumination C0 reaching point O along the ray for each visible wavelength � is [3]
C0� =
Z b
0
where
� � (0; s)�(xs )��t C � (xs ) ds;
� � (s0 ; s00 ) = exp
?��t
Z s00
s
0
(22)
!
�(xs ) ds ;
(23)
C � (xs ) = � L� (xs ) + (1 ? � )Q� (xs ); (24) L� (xs ) =
Nl X k=1
p� (cos�k (xs ))Sk (xs )L�k ;
(25)
where p is the phase function characterizing the scattering properties of the density distribution, the �k are the angles between the ray and the vectors pointing to the light sources, Sk determines if the light source is in shadow and Lk is the colour of the light source. The term Q� (xs ) accounts for self-emission and can be used to approximate the e�ects of multiple scattering. If we assume that C � (xs ) = Ci� is constant on each interval Ii , which is reasonable in the case of many small blobs, then Eq. 22 becomes
C0� = =
NX ?1
i=0 NX ?1
Ci�
Z si+1
si ?
� � (0; s)�(xs)��t ds �
Ci� � � (0; si ) ? � � (0; si+1 ) :
(26)
i=0 � If we de ne �i = � � (si ; si+1 ) as the transparency along interval Ii then the equation becomes NX ?1 Y i?1 ! ? � C0� = �j� Ci� 1 ? �i� : (27) i=0 j=0
We now show how the integral occurring in the calculations of the transparencies �i� can be computed e�ciently. Let us assume that the blobs �j1 ; ��� ; �jni intersect the ray on interval Ii . The transparency on interval Ii is then
�i� = exp
! ni Z si+1 X � �jk (xs ) ds : ?�t k=1 si
(28)
As we render for a particular frame in time we de ne �j2 = �02 + �(t ? tj ) and mj = mj (t). Using these de nitions, each
integral in Eq. 28 can be written as [8]: Z si+1
Z
�
�
si+1 2 2 �j (xs ) ds = m3j 3 exp ? rmin +(2s�?2 smin ) ds (2�) 2 �j si j si � � �� � 2 �� � si+1 ? smin ? T si ? smin : = m3j 2 exp ? r2min T �j2 �j �j (2�) 2 �j
The rst equality results from the geometry of Figure 3. The function T is the following integral: Z s
�
[15] E. Vanmarcke. Random Fields. MIT Press, Cambridge, Massachussetts, 1983. [16] R. P. Voss. \Fractal Forgeries". In R. A. Earnshaw, editor, Fundamental Algorithms for Computer Graphics. Springer-Verlag, 1985. [17] J. Wejchert and D. Haumann. \Animation Aerodynamics". ACM Computer Graphics (SIGGRAPH '91), 25(4):19{22, July 1991. [18] A. Witkin and M. Kass. \Reaction-Di�usion Textures". ACM Computer Graphics (SIGGRAPH '91), 25(4):299{308, July 1991.
2�
(29) exp ? u2 du; 0 and can be precomputed and stored in a table for e�ciency.
T (s) =
References
[1] D. S. Ebert and R. E. Parent. \Rendering and Animation of Gaseous Phenomena by Combining Fast Volume and Scanline A-bu�er Techniques". ACM Computer Graphics (SIGGRAPH '90), 24(4):357{366, August 1990. [2] A. F. Fournier, D. Fussell, and L. Carpenter. \Computer Rendering of Stochastic Models". Communications of the ACM, 25(6):371{384, June 1982. [3] A. Ishimaru. VOLUME 1. Wave Propagation and Scattering in Random Media. Single Scattering and Transport Theory. Academic Press, New York, 1978. [4] M. Kass and G. Miller. \Rapid, Stable Fluid Dynamics for Computer Graphics". ACM Computer Graphics (SIGGRAPH '90), 24(4):49{57, August 1990. [5] M. Lesieur. Turbulence in Fluids: Stochastic and Numerical Modelling. Kluwer Academic Publisher, Dordrecht, The Netherlands, 1990. [6] M. Levoy. \E�cient Ray Tracing of Volume Data". ACM Transactions on Computer Graphics, 9(3):245{ 261, July 1990. [7] J. P. Lewis. \Generalized Stochastic Subdivision". ACM Transaction on Graphics, 6(3):167{190, July 1987. [8] N. Max, R. Craw s, and D. Williams. \Visualizing Wind Velocities by Advecting Cloud Textures". In Proceedings of Visualization '92, pages 179{183, Los Alamitos CA, October 1992. IEEE CS Press. [9] W. H. Press, B. P. Flannery, S. A. Teukolsky, and W. T. Vetterling. Numerical Recipes in C. The Art of Scienti c Computing. Cambridge University Press, Cambridge, 1988. [10] W. T. Reeves and R. Blau. \Approximate and Probabilistic Algorithms for Shading and Rendering Structured Particle Systems". ACM Computer Graphics (SIGGRAPH '85), 19(3):313{322, July 1985. [11] R. S. Rogallo and P. Moin. \Numerical Simulation of Turbulent Flows". Annual Review of Fluid Mechanics, 16:99{137, 1984. [12] G. Sakas. \Modeling and Animating Turbulent Gaseous Phenomena Using Spectral Synthesis". The Visual Computer, 9:200{212, 1993. [13] M. Shinya and A. Fournier. \Stochastic Motion - Motion Under the In uence of Wind". In Proceedings of Eurographics `92, pages 119{128, September 1992. [14] K. Sims. \Particle Animation and Rendering Using Data Parallel Computation". ACM Computer Graphics (SIGGRAPH '90), 24(4):405{413, August 1990.
Sphere interacting with a gas (note the shadowing)
A strange brew
The lonely cigarette
From David to Heidi