EDWARD J. TEHOVNIK* and JOHN S. YEOMANS. Department ... method of Shizgal, Bielajew, Corbett, Skelton and Yeomans (1980) was used in rats. Pairs of ...
Brain Research, 385 (1986) 329-342 Elsevier
329
BRE 12090
Two Converging Brainstem Pathways Mediating Circling Behavior EDWARD J. TEHOVNIK* and JOHN S. YEOMANS
Department of Psychology, University of Toronto, Toronto, Ont. (Canada) (Accepted 18 March 1986)
Key words: Electrical stimulation - - Collision method - - Circling - - Lateral head movement - Rostromedial tegmentum - - Superior colliculus - - Medial pons
Ipsiversive circling results from stimulation of the rostromedial tegmentum (RMT) or medial pons (PONS), and contraversive circling results from stimulation of the superior colliculus (SC). To determine whether these sites are functionally connected, the collision method of Shizgal, Bielajew, Corbett, Skelton and Yeomans (1980) was used in rats. Pairs of stimulation pulses were presented to two sites, and the degree of collision between stimulation-evoked action potentials was assessed by measuring the frequency required for circling at short and long intrapair conditioning-testing (C-T) intervals. Collision was evidenced when the required frequencies were higher at short C-T intervals than at long C-T intervals. Collision of 46-62% was observed between RMT and PONS, and collision of 15-29% was observed between SC and PONS. Sites from which collision was obtained were located along the trajectories of the medial tegmental tract and the crossed tectospinal pathway. Refractory periods in all sites were similar, ranging from 0.3 to 1.7 ms. Conduction velocities of axons connecting RMT and PONS and SC and PONS were comparable, ranging from 0.8 to 13.3 m/s and 1.7 to 13.8 m/s, respectively, with lower conduction velocities associated with more ventral pontine sites. Thus, RMT and PONS, and SC and PONS are connected by myelinated axons that mediate circling.
INTRODUCTION
head turns t o w a r d stimuli located in the p e r i p h e r a l visual field 7'12'16'29'41'44'46.
Stimulation of the r o s t r o m e d i a l t e g m e n t u m ( R M T ) , the superior colliculus (SC), or the medial pons ( P O N S ) p r o d u c e s lateral eye, h e a d and b o d y m o v e m e n t s 5,10,11,18,19,21,23,25,26,36,40,43. The RMT
Recently, Y e o m a n s and L i n n e y 4s studied the pontine projections involved in the production of circling behavior in freely moving rats. Using the collision m e t h o d of Shizgal et al. 42 they found that longitudinal axons b e t w e e n the caudal m i d b r a i n and caudal P O N S mediate circling b e h a v i o r 27. The conduction velocities of these axons and those originating from the contralateral SC were found to be similar, suggesting that the longitudinal axons m a y originate from the SC. This evidence, however, does not rule out the possibility that these axons m a y originate from the R M T , which would concur with findings of Hinsey et al. 19.
sends ipsilateral projections to the P O N S 3'31'38'39 and the SC sends contralateral p r o j e c t i o n s to the P O N S 6'17'2°'22'24'35. A l t h o u g h these sites are a n a t o m ically connected, little evidence exists as to which of these connections m a y be responsible for the production of lateral m o v e m e n t s following stimulation. Hinsey et al. 19 p r o p o s e d that ipsilateral projections extending b e t w e e n R M T and P O N S and passing through the medial reticular f o r m a t i o n are involved in the production of lateral m o v e m e n t s . It has also been hypothesized that crossed projections from the SC via the dorsal t e g m e n t a l decussation are involved in the production of lateral m o v e m e n t s 9,1s. U p o n lesioning this structure, animals fail to p r o d u c e lateral
In these experiments, p a i r e d pulses are delivered through one electrode and the frequency required to produce a constant behavioral output is measured. If the n u m b e r of action potentials is r e d u c e d due to refractoriness (Fig. 1), then the required frequency
* Note: E.J.T. formerly published under the name E.J. Mlinar. Correspondence: J.S. Yeomans, Department of Psychology, University of Toronto, Toronto, Ont., Canada M5S 1A1. 0006-8993/86/$03.50 © 1986 Elsevier Science Publishers B.V. (Biomedical Division)
330 increases proportionally. Sharp increases in frequency at intrapair intervals of 0.3-1.5 ms have been attributed to the refractoriness of directly stimulated behavior-relevant axons 27,28,42,47-49,51. This interpretation has been supported by several parametric tests 47-51 and by electrophysiological observations 37'48'49. When paired pulses are delivered through two electrodes, the number of action potentials is reduced when collision occurs between orthodromic and antidromic action potentials evoked at two sites along a bundle of axons (Fig. 1). An increase in frequency at particular intrapair intervals while behavioral output remains constant has been attributed to collision. The collision test has been supported by parametric and electrophysiological tests4.27.42,48. The present investigation determined the degree of functional connectivity between the ipsilateral RMT and PONS, and the contralateral SC and PONS for the production of circling behavior. Connectivity was assessed by comparing the topography of the stimulation-elicited circling produced from each of the sites, by comparing the behaviorally determined refractory periods of the substrates 47, and by using the collision method of Shizgal et al. 42 to estimate the amount of functional connectivity between these substrates. MATERIALS AND METHODS
Stimulating electrodes Ten male Long-Evans hooded rats were used. The SC of 5 rats (S1, $2, $3, $4, $9 and S10) was implanted with a movable electrode (E. Miliaressis, Kinetrods, Ottawa) which was lowered through the collicular layers at increments of 320/~m 27. The movable electrodes had tip diameters ranging from 200 to 240 /~m. Stainless-steel electrodes with tip diameters ranging from 30 to 80/~m were implanted in the R M T (S1, $2, and $5 to $9) and PONS (S1 to $8). The stainless-steel electrodes were made from 00 insect pins insulated with Epoxylite. The tips were always rounded into a hemispherical shape.
Surgical procedure Prior to surgery, animals were anesthetized with sodium pentobarbital (60 mg/kg). Electrodes were implanted in the right SC and in the left R M T and left
PONS. Flat-head coordinates were used: SC: 6.0-7.0 mm posterior to bregma, 3.0 mm lateral to midline, and 3.0-6.0 mm below skull surface, angled medially at 14°; RMT: 5.3 mm posterior to bregma, 2.0 mm lateral to midline, and 7.4 mm below skull surface, angled medially at 12°; PONS: 8.3 mm posterior to bregma, 2.1 mm lateral to midline, and 8.9 mm below the skull surface, angled medially at 11 °. To act as ground, a stainless-steel wire attached to an Amphenol pin was wrapped about four jeweler's screws that were screwed into the skull. The electrode assembly was secured to the skull with dental cement.
Stimulation procedure and behavior All animals were tested for stimulation-elicited circling in a circular arena 35 cm in diameter. Stimulation consisted of 10 s trains of monophasic, cathodal rectangular pulses that were 0.1 ms in duration. Between stimulating pulses the electrodes were electronically connected to ground. Current intensity was monitored on an oscilloscope by the voltage drop across a 100 f~ resistor. The behaviors produced from the sites were compared. For each parametric test, the frequency required to elicit a criterion response was determined. The criterion response was three 360 ° body turns within 10 s26. The completion of the 3 turns was determined using visual judgment. Each trial was separated by at least 1 min to allow an animal to recover from stimulation.
Refractory period estimates Refractory periods were determined behaviorally for the SC, RMT, and PONS by delivering 10 s trains of pulse pairs (Fig. 1). Pairs of conditioning (C) and testing (T) pulses were presented at intrapair ( C - T ) intervals from 0.1 to 4.0 ms. At each C - T interval, the interval between pulse pairs (the C - C interval) was decreased until the criterion response was produced or exceeded. This first C - C interval producing the criterion response was taken to be the C - C threshold for pulse pairs. Similarly, the interval between single pulses (T pulses omitted) was manipulated until criterion behavior was observed, which defined the C - C threshold for single pulses. For each test session, the C - C threshold for pulse pairs was determined once for each of the different
331 REFRACTORY PERIOD EXPERIMENT C T
C
T
~ ~-~ C-C INTERVAL C-T INTERVAL SINGLE ELECTRODE
C T
ONE PULSE PAIR
havior; if E is 100%, then the T pulses have an effect on behavior equal to that of C pulses of the same current. To estimate the refractory period, E was plotted as a function of C - T interval to provide a refractory period curve. The slope of this curve describes the distribution of refractory periods of the neural population mediating the behavior 47'48. Collision test
COLLISION EXPERIMENT C
C
C
UT C-T
C-C INTERVAL
A
Fig. 1. To determine refractory periods, trains of paired pulses were delivered through one electrode. C pulses were 1.4 times higher than T pulses in many cases. To determine collision, C pulses were delivered through electrode A, and T pulses were delivered through electrode B.
C - T intervals, and the C - C threshold for single pulses was determined 4 times. For every stimulation site, 3 or 4 test sessions were conducted. To ascertain the effectiveness of the T pulses, a comparison between the C - C thresholds for pulse pairs and single pulses was made for every C - T interval tested using the following percentage effectiveness (E) formula for unequal C and T pulse currents47: E(%) = { ( C - C ' C & T ' - C - C ' C ' ) / C - C ' T ' }
x 100
C - C ' C & T ' denotes the C - C threshold for pulse pairs, C - C ' C ' denotes the C - C threshold for single pulses delivered at the higher current, and C - C ' T ' denotes the C - C threshold for single pulses delivered at the lower current. C pulses of higher currents than those of T pulses were used to reduce the effect of local potential summation 26'47. The current of the C pulses was 1.4 times greater than the current of the T pulses. In cases where the higher current could not be delivered, the two currents were equal. If E is 0%, then the T pulses have no effect on be-
To ascertain whether two substrates are connected directly by axons for the production of circling behavior, C pulses were presented to one site while T pulses were presented to the other (Fig. 1). During a test session, the C - C threshold for pulse pairs was determined for C - T intervals ranging from 0.2 to 12.0 ms. The C - C threshold of single pulses was ascertained twice for each site during a session. In determining the threshold, the C - C interval required to produce criterion behavior at each site was matched by adjusting the currents of the pulses delivered to each site. To assess the effectiveness of the pulse pairs, the C - C threshold for pulse pairs was compared with the C - C threshold of single pulses. Three or 4 test sessions were conducted. C - C thresholds were compared for every C - T interval tested using the following formulaa2: E(%) = [ { ( C - C ' C & T ' ) / ( C - C ' C ' + C - C ' T ' ) / 2 } - 1] × 100 C - C ' C & T ' denotes the C - C threshold of pulse pairs, C - C ' C ' denotes the C - C threshold for single pulses delivered to one site, and C - C ' T ' denotes the C - C threshold for single pulses delivered to the other site. If E at short C - T intervals (i.e. 0.4 ms) is lower than E at long C - T intervals (i.e. 4.0 ms), then collision between stimulation-evoked action potentials is evidenced. Several other criteria for collision were adopted42: First, collision should be symmetrical; namely, it should not be dependent on which site receives the C pulses. An asymmetrical result suggests that a synapse is located between the substrates. Second, no local potential summation should occur at short C - T intervals; that is, the E at a C - T interval of 0.2 ms should not be greater than the E at a C - T interval of 0.4 ms. If local potential summation is ob-
332
Dr,(
( PC i (.
APT
i
,
"J
po
L DR
/i
I,tlt~ /...,o,
6'4 ',
}" "i
PnC
@ iii, i dnR /
/
//
/ ;'.Z? ~
p~
~I i i""u ,.o
A~, co DpMe /
,~pl
', RM(~\
,, /'{i;_';, vHj' i
-.v.Pb
",,d/
I
P.O
'X I'
¢
~( ]
..... i
@ I ~jI
CG
}~oR/
DpMe
rJ~'^: '" "
, ;"
RRF
©
,&
@
-
,' ~°~,,, ,r,
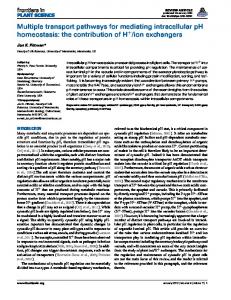
Fig. 2. The location of the electrode tips is indicated for each subject by number, and movable electrode tracks are shown. The number on the tracks shows the location of electrodes for the refractory period and collision tests.
333 SC
0
RMT
0
2
c t (~,)
PONS
3
c - t ~ms)
1
c - t (m=~
i c-t (~)
4
c - t (msl
4
c - r (m,l
c-t (~)
'®F ~ I C t (m,~
o
i)2
~ ~
i 1
i
i 3
J 4
c - t (m,)
c-t (~p
..I
t
;
# s6 I ~ = lsouA
CT(~
Fig. 3. Refractory period curves show E plotted as a function of C - T interval. Each panel shows one electrode site. For higher-current C pulse conditions, 'I'C" denotes the higher current and 'I'T" denotes the lower current. For equal-current conditions, 'I'C&T" denotes the equal current level. The C - C threshold of single pulses for the curves ranged from 20 to 48 ms. Four test sessions are represented by each curve except for the P O N S site for $3, which represents 3 sessions. Standard error bars are shown.
334 served, then current leakage has occurred or the fields of stimulation have overlapped, thereby compromising the validity of the collision experiment. Third, the estimated collision interval of axons linking two substrates should be longer than their estimated refractory periods. Finally, the conduction velocity estimates of the axons linking two substrates should be within the range of physiologically determined conduction velocities. Histology After testing, the rats were killed with sodium pentobarbital, perfused intracardially with a 0.9% saline solution, and fixed with a 10% formalin solution. Brains were removed by dissecting from the ventral surface and then stored in formalin. To identify the location of electrode sites, the brains were sectioned at 40 k~m, mounted on slides, and stained with thionin. The location of electrodes was determined using the Paxinos and Watson 33 atlas.
RESULTS Histology and behavior Fig. 2 shows electrode sites from which circling was produced. For SC stimulation sites, circling was contraversive. When the criterion response was observed, the head turned at about 1 s following stimulation onset, then the body turned 1-3 s later. The body assumed a non-rigid curved posture. The circling was elicited from the intermediate and deep SC layers. Stimulating the superficial layers of the caudal SC elicited contraversive head turning only (subjects S1 and S10), and stimulating the superficial lay-
ers of the rostral SC elicited contraversive jumping behavior ($3). Stimulating the tegmentum below the rostral SC produced ipsiversive turning ($3). For R M T stimulation sites, the circling was ipsiversive and the head and body turned at about 1 s following stimulation onset. The head remained tilted to the side of stimulation, pivoting was done about the hindquarters. The body maintained a very rigid posture, and the diameter of circles produced equaled the rat's body length. The circling was elicited from sites located from the rostromedial tegmentum to the dorsal tegmental decussation. For PONS stimulation sites, the circling was ipsiversive and the head turned at about 1 s following stimulation onset. The body turned immediately after the head turn started, pivoting was done about the hindquarters, and the body always assumed a nonrigid curved posture. The diameter of circles produced was larger than that produced during stimulation of the SC, yet smaller than that produced during stimulation of the RMT. The circling was elicited from the medial reticular formation between the caudal midbrain and caudal pons. Refractory periods Threshold curves for the SC, R M T and PONS are illustrated with E plotted as a function of C - T interval (Fig. 3). For each stimulation site, a range of refractory periods was determined by noting the C - T intervals for which the curve achieves 20 and 80% of its maximum rise (Table I). The ranges of refractory periods were similar for SC, RMT, and PONS. For the SC ($2 to $4), the ranges were from 0.5 to 1.6 ms; for the R M T ($2, and $5 to $8), the ranges were from
TABLE I Ranges of refractory periods and conduction velocities are listed according to subject and electrode site
Conduction times and distances are also included. Sub/ects
$2 $3 $4 $5 $6 $7 $8
Refractory periods (ms) RMT
SC
PONS
0.3-1.0 0.5-1.6 0.3-1.0 0.4-0.7 0.5-1.2
0.5-1.0 0.7-1.5 0.5-1.6 -
0.4-0.9 0.4-0.9 0.4-0.9 0.7-1.3 0.5-1.7 0.3-0.8 0.4-1.2
Conduction time (ms)
Conduction distance (ram)
Conduction velocity (m/s)
0.5-2.5 0.6-2.2 0.4-1.1 2.5-3.8 0.9-4.4 0.5-0.9 0.3-1.0 0.3-0.7
3.2 7.7 5.5 6.3 3.6 3.8 4.0 3.5
1.3-6.4 3.5-12.8 5.0-13.8 1.7-2.5 0.8-4.0 4.2-7.6 4.0-13.3 5.0-11.7
335
RMT + PONS A
100
C
$1
P-,
80
100
80
~
60
6o
uJ
40
40 cr'~
IpONS- 1000 ,uA
20
InMT = 300,uA IpONS = 300/zA
20
0
J
I
I
J
1
2
3
4
0
0
l
i
,
i
1
2
3
4
C-T
l,L_l
i
8
12
(ms)
I00 D
8O
100
. I P-A 8O
g
60 60
u.I 40
iii 4O
$1 I~MT = 180pA IpoNS : 300 #A
2O
0
0
J 1
i
i
2
IRMT = 400pA IpoNs = 150uA
2O
I 4
3
C-T
100
E
(ms)
1oo
80 8O
,-/
60
----9---~..4
40 $1 IRMT = 90 #/A IpONS= 150pA
20
4(]
fRMT= S00#A IPONS- 300,uA
2C f I 1
I 2
C-T
I
I
3
4
(ms)
I
I
I
i
1
2
3
4
/~ 12
C-T (ms)
B loo
F
80
d .I......I P-A
100
80
I /"
..,,~---o---o. ~r
l
60 I.fl
uJ
40
40
'I~:/~l IS2T = 800,uA 20
IpONS= 30OpA
1
2
3 C-T
4 (ms)
$8
T
IRMT = 1400,uA IpoNs = 400/zA
20
12
1
4 C-T
10
(ms)
Fig. 4. Collision curves show E plotted as a function of C - T interval for the RMT and PONS. Each panel shows two curves. A - P : C pulses were delivered to the RMT (anterior substrate), and T pulses were delivered to the PONS (posterior substrate). P - A : C pulses were delivered to the PONS and T pulses were delivered to the RMT. Each plot represents 2 sessions, except for $1 ( A - P and P - A ) of the low current condition and $7 ( P - A ) , which plots represent single sessions. Standard error bars are shown.
336 er. The refractory period curves for the SC rose later than those for the RMT and PONS, and the refractory period curves for two ventral PONS sites ($4, $5),
0.3 to 1.6 ms; and for the PONS ($2 to $6, and $8), the ranges were from 0.3 to 1.7 ms. Some interesting differences were found, howev-
SC + PONS
A
100
$1
C
$3
100[
8O
60
60
40
40 o~"
Sl
20
0
Isc = 1400 pA I ~ s = 400 pA _ _
I
1_
t
I
1
2
3
4
IF~)NS= 400 pA
20
~
uJ
0
i
1
i
2
~-
i
1Jo
fb
4
LLI
100
100
80
80
$3 Is(; - 500,uA I~Ns - 200/JA
60
60 Sl = 700 ,uA = 300/JA
I sc I~s
40 ~
~
~.~.
~
~
.
.
.
~
.
.
.
.
40
A-P
20
o;
A~.P
P-A
.
20
i
I
I
I
1
2
3
4
0
0
1
'
2
C-T (ms)
g
C-T
$2
lOO
'.,'---'---'--,,--'---
80
60
D
4 (ms)
$4
lOO
8O ,,
T T
.~..._.........~ A P
60 . . . . . . . .
g Iii
40
40 = 400 pA IpoN s = 300/~A
::~t--'~
I sc
$4 Isc = 500 pA I pONS = 200 pA
2O
20
0
t~
'
3
1
,
2
L
3
C-T (ms)
~
4
//
'
8
~2
0 _
i 1
2
t_
i _-4/
k
3
4
6
10
C-T (ms)
Fig. 5. Collision curves show E plotted as a function of C - T interval for the SC and PONS. Each panel shows two curves. A - P : C pulses were delivered to the SC, and T pulses were delivered to the PONS. P - A : C pulses were delivered to the P O N S , and T pulses were delivered to the SC. Each plot represents 2 sessions, except for S1 ( A - P and P - A ) of the low current condition, which plots represent a single session. Standard error bars are shown.
337 rose later and more gradually than those for the more dorsal PONS sites. All these effects were independent of current. RMT -I- SC
100
80
$9 I ~ = 700 p A Isc = 800,uA
60
P-A
40
20
0
0
I
I
I
/
1
2
3
4
100
~A-P 80
6O I.U InMr = 600 p A I sc = 350 uA
40
20
100 ...... ~ P-A
80
60
Inur = 550/~A
40
I sc = 200 p A
20
Collision Collision curves are displayed for the RMT and PONS (Fig. 4), the SC and PONS (Fig. 5), and the RMT and SC (Fig. 6). For the highest current conditions, collision was evidenced for both the RMT and PONS and the SC and PONS: i.e., the E at a short C - T interval (0.4 ms) was lower than the E at a long C - T interval (4.0 ms) (Figs. 4, 5). Moreover, collision was approximately symmetrical in all these cases, and local potential summation was never observed. In contrast, collision was not evidenced for the RMT and contralateral SC at any of 3 current levels (Fig. 6). At the two lower currents, near-perfect summation of stimulation-evoked action potentials (i.e. E = 100% for short and long C - T intervals) was observed. The amount of collision was calculated by the difference between E at a C - T interval of 4.0 ms and E at a C - T interval of 0.4 ms. The amount of collision for the RMT and PONS and the SC and PONS was found to increase with current. For the lowest currents no collision was observed (the bottom curves in Figs. 4A, 5A, and 5C). For the highest current conditions, the amount of collision evidenced for the RMT and PONS was markedly greater (ranging from 46 to 62% for the highest currents) than that evidenced for the SC and PONS (ranging from 15 to 29% for the highest currents) (Table II). The collision interval was greater than the estimated refractory periods for all cases tested (Table I: $2 to $8). Collision curves rose quickly near 1.0 ms in most cases. The rise occurred at longer intervals for the most ventral PONS sites (Figs. 4B, 4C, 5D). The collision intervals for the SC and PONS were not longer than those for the RMT and PONS in spite of longer conducton distances between the SC and PONS. DISCUSSION
I
I
I
I
1
2
3
4
C-T (ms) Fig. 6. Collision curves show E plotted as a function of C - T interval for the R M T and SC. E a c h panel shows two curves. A - P : C pulses were delivered to the R M T , and T pulses were delivered to the contralateral SC. P - A : C pulses were delivered to the contralateral SC, and T pulses were delivered to the R M T . Each plot represents 2 sessions. Standard error bars are shown.
Behavior The circling produced from the PONS had features in common with both RMT circling and SC circling. Like R M T circling, PONS circling was ipsiversive and the body turn began shortly after stimulation onset; like SC circling, the head turned before the body and the body assumed a very natural, non-rigid posture. Furthermore, the radius of the circles produced
338 TABLE
2N
II
Percent collision is listed by subject and electrode site The current and the C-Csp, which is the mean C-C threshold between sites [(C-C'C' + C-C'T')/2], are also indicated. The asterisk (*) indicates that the E peaked beyond a C - T interval of 4.0 ms; therefore, in calculating the percent collision, the high E value was not taken at a C-T interval of 4.0 ms, but rather at a higher C-T interval.
Subjects Current(~A) VMT SC S1
$2 $3 $4 $5 $6 $7 $8 $9
SIO
PONS
C-Csp (ms)
% Collision
1000 180 90 -
1400
1000 300 180 400
45 26 14 34
53 23 11 15
800 -
700 400 1000 500 500 800 600 550 700
300 300 300 400 200 200 300 150 300 400 -
24 24 26 29 23 41 34 22 17 19 26 16 12 20
2 46* 23 29 6 27 52* 62 60 52* -9 0 -7 -
300 400 800 1400 700 350 200 -
/
/
/
I
f I
1
2
3
I
4
C-T (ms) Fig. 7. A refractory period curve shows the number of firings plotted as a function of C-T interval for 11 tectobulbar units of the rat. 1N indicates that all the units were fired once, and 2N indicates that all the units were fired twice. The curve shows the distribution of refractory periods. These data were obtained using the method of Yeomans and Linney 48.
tory periods found in the SC and ventral P O N S suggest that the directly excited substrates in these sites recover more slowly.
was midway b et ween the radii of those produced from the R M T and those p r o d u c e d from the SC.
The distribution of the behaviorally estimated refractory periods is consistent with the distribution of electrophysiologically d e t e r m i n e d refractory periods
Refractory periods
for rat tectobulbar axons (Fig. 7).
The negatively accelerating decline in E observed at C - T intervals from 0.1 to 0.4 ms is consistent with local potential summation 26'28'47-49. T h e sharp rise in
Collision
E observed at C - T intervals from 0.3 to 2.0 ms is consistent with recovery from refractoriness 26'28"47'48.
ments occurred most sharply at C - T intervals near
T he slope of the rising curve roughly describes the
periods. No local potential summation decline was
distribution of absolute refractory periods of the di-
observed in any case. The results were the same
rectly stimulated axons mediating circling, weighted by their behavioral importance 47'48. T h e r e is a slight
whether C pulses were delivered via rostral electrode
contamination due to relative refractoriness, however, at C - T intervals above 0.8 m s 48.
sion between o r t h o d r o m i c and antidromic action potentials occurred in the axons mediating circling28,42,48.
The behaviorally estimated refractory periods of
The rise in E in two-electrode paired-pulse experi1.0 ms. These intervals were longer than the refractory
or caudal electrode. These results suggest that colli-
the R M T , the SC, and the P O N S were similar, ranging from 0.3 to 1.7 ms. Thus, similar axonal popula-
P O N S and for the SC and contralateral P O N S .
tions were stimulated at each site. The range of these
H e n c e , the axons from the R M T and the SC project
refractory periods suggests that the stimulated axons are myelinated 33'45. T h e refractory periods r e p o r t e d
through the P O N S for the production of circling be-
here for the P O N S are similar to those r e p o r t e d by other investigators 26'28'48. The slightly longer refrac-
tween the R M T and P O N S was greater than b e t w e e n the SC and PONS. This indicates that there was a
Collision was observed for the R M T and ipsilateral
havior. F u r t h e r m o r e , the amount of collision be-
339 better alignment between the RMT and PONS electrodes than between the SC and PONS electrodes. Collision was not evidenced between the RMT and contralateral SC. Nevertheless, close to perfect summation occurred between these sites. This suggests that the outputs from the RMT and SC converge onto a common substrate for the production of circling. These data agree with the known anatomy of the substrates: the medial tegmental tract connects the RMT and ipsilateral PONS 3'31'38'39, and the tectospinal tract connects the SC and contralateral
PONS6,17,20,22,24,35. It remains unclear where the circling signals are integrated. One possible site of integration is the cervical spinal cord. Efferents from the RMT and the SC terminate in the cervical spinal cord 8'22'30'35,and electrical stimulation of the RMT or the SC activates neck motoneurons H3'~4. The collision method does not test the direction of conduction. It is commonly assumed that the circling substrates of the RMT and PONS and the SC and PONS project caudally 18'19. Between the RMT and ipsilateral PONS both descending and ascending projections are found 3'31,38'39, but between the SC and contralateral PONS descending projections only are
known6,17,20,22,24,35. Field of stimulation The radius of the stimulation fields can be estimated by the formula R = V]7-K, where R is the radius of the field of excitation in mm, I is the current in pA, and K is the current-distance constant of axons 2'34. K has been estimated to range from 400 to 4000 pA/mm 2 for circling substrates in caudal midbrain 51. To estimate the field of stimulation at RMT and PONS circling sites, it was assumed that the axons at these sites have K values comparable to those estimated for caudal midbrain 51. For RMT stimulation, the currents for which maximal collision was observed ranged from 300 to 1400 BA. Therefore, for axons with low K (400 pA/mm2), the radius of stimulation should range from 0.9 to 1.9 ram; and for axons with high K (4000 pA/mmZ), the radius should range from 0.3 to 0.6 mm. For PONS stimulation, the currents for which maximal collision was observed ranged from 150 to 1000 pA. Therefore, for axons with low K, the radius of stimulation should range
from 0.6 to 1.6 mm; and for axons with high K, the radius should range from 0.2 to 0.5 mm. In 4 cases in which collision was observed between the RMT and PONS ($1, $2, ST, $8), the estimated field of stimulation from the RMT electrode included the decussation of the tectospinal pathway. For $1, the RMT placement was located approximately 1.5 mm anterior to the decussation. The radii of stimulation were 1.6 and 0.5 mm for axons with low and high K. For $2 and $7, the RMT placements were located approximately 1.0 and 0.5 mm, respectively, anterior to the decussation. The radii of stimulation were 1.4 and 0.5 mm for axons with low and high K. For $8, the placement was located approximately 1.0 mm anterior to the decussation, and the radii of stimulation were 1.9 and 0.6 mm for axons with low and high K. For the remaining cases ($5, $6), the estimated field of stimulation did not include the decussation of the tectospinal pathway. For $5 and $6, the placements were both approximately 1.0 mm anterior to the decussation, and the radii of stimulation were 0.9 and 1.0 mm, respectively, for axons with low K and 0.3 and 0.3 mm, respectively, for axons with high K. All the field of stimulation estimates are based on current spread across, rather than along, a bundle of axons 51. Current spreads less easily across a bundle of axons than along a bundle of axons 15. The field of stimulation estimates, therefore, somewhat underestimate the spread of stimulation along the rostral-caudal extent of the RMT substrate. In all cases where collision was evidenced for the RMT and PONS, some fibers from the tectospinal pathway may have been activated. Nonetheless, it may be argued that the RMT still accounts for most of the collision. For $5 and $6, cases in which the field of stimulation encroached least on the decussation of the tectospinal pathway, 52 and 62% collision, respectively, were observed for the RMT and PONS. The highest amount of collision achieved for any RMT site was 62%. Furthermore, the lowest current thresholds occurred not when the RMT placement was near the tectospinal decussation ($7: I = 800 pA), but instead when they were some distance rostral to the decussation ($5: I = 300 pA; $6: I = 400 pA). Finally, the collision observed between the RMT and PONS was always much greater than that observed between the SC and PONS, indicating that the SC alone cannot account for most of the collision.
340 A
Conduction velocity estimates To determine the conduction velocities of axons between the RMT and PONS and between the SC and PONS, the conduction distance was divided by conduction time. The conduction distance between RMT and PONS sites was taken to be the distance between the two electrodes. The conduction distance between SC and PONS sites was estimated from the histology and known trajectory of the tectobulbar and tectospinal pathways via the dorsal tegmental decussation 6,33. Conduction time was calculated by subtracting the refractory period from the collision time. The problem in comparing these curves is that the collision curves take up a narrower range of E values than the refractory period curves. Should the collision curve be compared with the initial rise in the refractory period curve, or with the entire refractory period curve? Yeomans and Linney48 argued that neither of these methods is accurate, but that the correct estimate falls in between these two extremes. Their method of taking the average of these two methods has been adopted here. Before the collision curves were adjusted, the refractory period curves were adjusted to occupy a range of 100% (Fig. 8). The following formula was used: E(adjusted) = [E(C-T)/{E(H1) + E(H2)}/2] x 100 E(adjusted) denotes the adjusted E; E ( C - T ) denotes the E of an unadjusted refractory period curve for a particular C - T interval; {E(H1) + E(H2)}/2 denotes the mean of the two highest E values, E(H1) and E(H2), of an unadjusted refractory period curve. Curves A and B of Fig. 8 represent adjusted refractory period curves of the RMT and PONS of $2. The two methods used to adjust collision curves are as follows. With the first method, a collision curve was compared with the lowest part of a refractory period distribution (the initial rise of curves A and B). The two lowest values of a collision curve were set at zero. That is, a mean was calculated between the two lowest E values; then this mean was subtracted from every E value depicted by that curve. In Fig. 8, curve C represents the zeroed collision curve for the RMT and PONS of $2. Conduction
..........~.-:.:.~.--~.-: 2
..u ......
[] D
'°°F /
60 w
fi /
40
tI
/yf
N
o
IV ; S
~o ~ , ! /
"
;
oC
s2
i
2
t
3
~
//
;
i
~2
C - T (ms)
Fig. 8. Refractory period and collision curve adjustments: A and B represent adjusted refractory period curves. C represents a zeroed collision curve, and D represents a stretched collision curve. Conduction times are indicated by line segments M and N for the zeroed collision curve and by line segments P and Q for the stretched collision curve.
times were calculated at 20 and 80% of the rise of a zeroed collision curve as shown by line segments M and N. The assumption underlying this method is that the axons showing collision are those that show the shortest refractory periods 48. With the second method, a collision curve was compared with the entire distribution of refractory periods (the total rise of curves A and B). A collision curve was first zeroed. Then the zeroed curve was stretched so that the two highest E values of the zeroed curve approximated an E value of 100% (Fig. 8, curve D). This transformation was done using the formula: E(stretched) -- [E(zeroed)/{E(H1) + E(H2)}/2] x 100 E(stretched) denotes the E value of a stretched collision curve after zeroing; E(zeroed) denotes the E value of a zeroed collision curve for a particular C - T interval; {E(H1) + E(H2)}/2 denotes the mean of the two highest E values, E(H1) and E(H2), for a zeroed collision curve. Conduction times were calculated at the 20 and 80% rise of a stretched collision curve as shown by line segments P and O. The assumption underlying this method is that the axons along which collision occurs have the same distribution of refractory periods as those at each electrode site.
341 Since method 1 overestimates conduction time whereas method 2 underestimates it, a mean was computed between the conduction times determined by each method (conduction time at 20% of maximum rise of curves = (M + P)/2; conduction time at 80% of maximum rise of curves = (N + Q)/2). These means represent the lower and upper limits of conduction time (Table I). The behaviorally estimated conduction velocities of axons between the R M T and PONS and the SC and PONS were similar, ranging from 0.8 to 13.3 m/s and 1.7 to 13.8 m/s, respectively (Table I). These velocities are similar to those reported by other investigators for circling axons within the P O N S 26A6, thereby indicating that the R M T and the PONS and the SC and the PONS contain similar populations of circling axons. Furthermore, these velocities are in the range of the physiologically determined conduction velocities of the crossed tectospinal axons, which range from 0.7 to 40 m/s 48. The individual conduction velocities varied some-, what within each group. Some of this variance can be explained by the difference in depth of the PONS electrode. Conduction velocities for R M T - P O N S axons tended to be higher for dorsal PONS sites ($6: 4.2-7.6 m/s; $ 7 : 4 . 0 - 1 3 . 3 m/s; $ 8 : 5 . 0 - 1 1 . 7 m/s) than for the most ventral P O N S sites ( $ 2 : 1 . 3 - 6 . 4 m/s; $ 5 : 0 . 8 - 4 . 0 m/s). This suggests that the R M T - P O N S axons projecting through the dorsal pontine reticular formation have greater diameters
than those projecting through the ventral pontine reticular formation, just dorsal to the medial lemniscus. The longer refractory periods found in these ventral PONS sites are consistent with this conclusion. This tendency was not as apparent for the S C - P O N S axons. CONCLUSION The R M T and SC send myelinated axons through the PONS for the production of lateral head and body movements. Evidence to support this contention is based on the following: First, the circling behavior exhibited during PONS stimulation had features in c o m m o n with both R M T circling and SC circling; second, the refractory periods of the R M T and PONS and of the SC and PONS were similar; third, collision was evidenced between the R M T and PONS and between the SC and PONS; fourth, near-perfect summation occurred between the R M T and the SC; and finally, the conduction velocities of the circling axons projecting between the R M T and PONS and between the SC and PONS were consistent with those reported for the PONS.
ACKNOWLEDGEMENTS Supported by N S E R C C Grant A7077 to J.S.Y. and N S E R C C Postgraduate Fellowship to E.J.T.
REFERENCES 1 Anderson, M.E., Yoshida, M. and Wilson, V.J., Influences of superior colliculus on cat neck motoneurons, J. NeurophysioL, 34 (1971) 898-907. 2 Asanuma, H., Arnold, A.P. and Zarzecki, P., Further study on the excitation of pyramidal tract cells by intracortical microstimulation, Exp. Brain Res., 26 (1976) 443-461. 3 Bebin, J., The central tegmental bundle: an anatomical and experimental study in the monkey, J. Cornp. Neurol., 105 (1956) 287-332. 4 Bielajew, C. and Shizgal, P., Behaviorally derived measures of conduction velocity in the substrate for rewarding medial forebrain bundle stimulation, Brain Research, 237 (1982) 109-119. 5 Bender, M.B. and Shanzer, S., Oculomotor pathways defined by electrical stimulation and lesions in the brainstem of monkey. In M.B. Bender (Ed.), The Oculomotor System, Harper and Row, New York, 1964, pp. 81-140. 6 Burne, R.A., Azizi, S.A., Mihailoff, G.A. and Woodward, D.J., The tectopontine projection in the rat with comments
7 8 9
10 11 12 13
on visual pathways to the basilar pons, J. Comp. Neurol., 202 (1981) 287-307. Casagrande, V.A. and Diamond, I.T., Ablation study of the superior colliculus in the tree shrew (Tupaia glis), J. Comp. Neurol., 156 (1974) 207-238. Castiglioni, A.J., Galloway, M.C. and Coulter, J.D., Spinal projections from the midbrain of the monkey, J. Comp. Neurol., 178 (1978) 329-346. Ellard, C.G. and Goodale, M.A., The role of the predorsal bundle in head and body movements elicited by electrical stimulation of the superior colliculus in the Mongolian gerbil, in preparation. Faulkner R.F. and Hyde, J.E., Coordinated eye and body movements evoked by brainstem stimulation in decerebrated cats, J. Neurophysiol., 21 (1958) 171-182. Ferrier, D., The Function of the Brain, London, 1876. Finlay, B.L., Sengelaub, D.R., Berg, A.T. and Cairns, S.J., A neuroethological approach to hamster vision, Behay. Brain Res., 1 (1980) 479-496. Fukushima, K., Pitts, N.G. and Peterson, B.W., Direct excitation of neck motoneurons by interstitiospinal fibres,
342
Exp. Brain Res., 33 (1978) 565-581. 14 Fukushima, K., Hirai, N. and Rapoport, S., Direct excitation of neck flexor motoneurons by the interstitiospinal tract, Brain Research, 160 (1979) 358-362. 15 Geddes, L.A. and Baker, L.E., The specific resistance of biological material - - a compendium of data for the biomedical engineer and physiologist, Med. Biol. Eng., 5 (1967) 271-293. 16 Goodale, M.A. and Murison, A.D., The effects of lesions of the superior colliculus on locomotor orientation and the orienting reflex in the rat, Brain Research, 88 (1975) 1-19. 17 Harting, J.K., Descending pathways from the superior colliculus: an autoradiographic analysis in the rhesus monkey (Macaca mulatta), J. Comp. Neurol., 173 (1977) 583-612. 18 Hess, W.R., Burgi, S. and Biicher, V., Motorische Funktionen des Tektal- und Tegmentalgebietes, Monatsschr. Psychiatr. Neurol., 112 (1946) 1-52. 19 Hinsey, J.C., Ranson, S.W. and Dixon, H.H., Responses elicited by stimulation of the mesencephalic tegmentum in the cat, Arch. Neurol. Psychiatry, 24 (1930) 966-977. 20 Holcombe, V. and Hall, W.C., The laminar origin and distribution of the crossed tectoreticular pathways, J. Neurosci., 1 (1981) 1103-1112. 21 Hopf, G., Heller, H. and Schaefer, R.P., Stimulation experiments on the tectum opticum of freely moving decorticate cats, Electroencephalogr. Clin. Neurophysiol., 27 (1969) 617-629. 22 Huerta, M.F. and Harting, J.K., Tectal control of spinal cord: neuranatomical demonstration of pathways connecting the superior colliculus with the cervical spinal cord grey, Prog. Brain Res., 57 (1982) 293-328. 23 Ingram, W.R., Ranson, S.W., Hannett, F.I., Zeiss, F.R. and Terwilliger, E.H., Results of stimulation of the tegmentum with the Horsley-Clarke stereotaxic apparatus, Arch. Neurol. Psychiatry, 28 (1932) 513-541. 24 Kawamura, K., Brodal, A. and Hoddevik, G., The projection of the superior colliculus onto the reticular formation of the brain stem: an experimental anatomical study in cat, Exp. Brain Res., 19 (1974) 1-19. 25 Mabuchi, M., Rotatory head response evoked by stimulating and destroying the interstitial nucleus and surrounding region, Exp. Neurol., 27 (1970) 175-193. 26 Miliaressis, E., Refractoriness of neurons subserving circling following stimulation of the median raphe region in the rat, Physiol. Behav., 26 (1981) 709-712. 27 Miliaressis, E. and Philippe, L., A dual movable stimulation electrode and its application to the behavioral version of the collision test, Brain Res. Bull., 10 (1983) 573-577. 28 Miliaressis, E. and Philippe, L., The pontine substrate of circling, Brain Research, 293 (1984) 143-152. 29 Mlinar, E.J. and Goodale, M.A., Cortical and tectal control of visual orientation in the gerbil: evidence for parallel channels, Exp. Brain Res., 55 (1984) 33-48. 30 Nyberg-Hansen, R., Sites of termination of interstitiospinal fibers in the cat. An experimental study with silver impregnation methods, Arch. ltal. Biol., 104 (1966) 98-111. 31 Ogawa, T., The tractus tegmenti medialis and its connection with the inferior olive in the cat, J. Comp. Neurol., 70 (1939) 181-190. 32 Paintal, A.S., Conduction properties of normal peripheral mammalian axons. In S.G. Waxman (Ed.), Physiology and Pathobiology of Axons, Raven Press, New York, 1978, pp. 138.
33 Paxinos, G. and Watson, C., The Rat Brain in Stereotaxic Coordinates, Academic Press, New York, 1982. 34 Ranck, J.B., Which elements are excited in electrical stimulation of the mammalian central nervous system: a review, Brain Research, 98 (1975) 417-440. 35 Rhoades, R.W. and Della Croce, D.R., Cells of origin of the tectospinal tract in the golden hamster: an anatomical and electrophysiological investigation, Exp. Neurol., 67 (1980) 163-180. 36 Robinson, T.E., Electrical stimulation in freely moving rats. I. Effects on behavior, Physiol. Behav., 21 (1978) 223-231. 37 Rolls, E.T., Involvement of brainstem units in medial forebrain bundle self-stimulation, Physiol. Behav., 7 (1971) 297-310. 38 Saint-Cyr, J.A. and Courville, J., Projections from the motor cortex, midbrain, and vestibular nuclei to the inferior olive in the cat: anatomical organization and functional correlates. In J. Courville, C. de Montigny and Y. Lamarre (Eds.), The Inferior Olivary Nucleus: Anatomy and Physiology, Raven Press, New York, 1980, pp. 97-124. 39 Saint-Cyr, J.A. and CourviUe, J., Descending projections to the inferior olive from the mesencephalon and superior colliculus in the cat, Exp. Brain Res., 45 (1982) 333-348. 40 Schaefer, K.P., Unit analysis and electrical stimulation in the optic rectum of rabbits and cats, Brain Behav. Evol., 3 (1970) 222-240. 41 Schneider, G.E., Two visual systems: brain mechanisms for localization and discrimination are dissociated by tectal and cortical lesions, Science, 163 (1969) 895-902. 42 Shizgal, P., Bielajew, C., Corbett, D., Skelton, R. and Yeomans, J., Behavioral methods for inferring anatomical linkage between rewarding brain stimulation sites, J. Comp. Physiol. Psychol., 94 (1980)227-237. 43 Skultety, F.M., Circus movements in cats following midbrain stimulation through chronically implanted electrodes, J. Neurophysiol., 25 (1962) 152-164. 44 Sprague, J.M. and Meikle, T.H., Jr., The role of the superior colliculus in visually guided behavior, Exp. Neurol., 11 (1965) 115-146. 45 Swadlow, H.A. and Waxman, S.G., Activity-dependent variations in the conduction properties of central axons. In S.G. Waxman (Ed.), Physiology and Pathobiology of Axons, Raven Press, New York, 1978. 46 Trevarthen, C.B., Two mechanisms of vision in primates, Psychol. Forsch., 31 (1968)299-337. 47 Yeomans, J.S., Absolute refractory periods of self-stimulation neurons, Physiol. Behav., 22 (1979) 911-919. 48 Yeomans, J.S. and Linney, L., Longitudinal brainstem axons mediating circling: behavioral measurement of conduction velocity distributions, Behav. Brain Res., 15 (1985) 121-135. 49 Yeomans, J.S., Matthews, G.G., Hawkins, R.D., Bellman, K. and Doppelt, H., Characterization of self-stimulation neurons by their local potential summation properties, Physiol. Behav., 22 (1979) 921-929. 50 Yeomans, J.S., Mercouris, N. and Ellard, C., Behaviorally measured refractory periods are lengthened by reducing electrode tip exposure or raising current, Behav. Neurosci., 99 (1985) 913-928. 51 Yeomans, J.S., Prior, P. and Bateman, F., Current-distance relations of axons mediating circling elicited by midbrain stimulation, Brain Research, 372 (1986) 95-106.