Journal of Athletic Training 2012:47(1):32--41 © by the National Athletic Trainers' Association, Inc www.nata.org/jat
original researCh.
Two Different Fatigue Protocols and Lower Extremity Motion Patterns During a Stop-Jump Task David Quammen, MS*; Nelson Cortes, PhD*t; Bonnie L. Van Lunen, PhD, ATC*; Shawn Lucci, MS*; Stacie I. Ringleb, PhD:t:;James Onate, PhD,ATC§ *Human Movement Sciences Department, Old Dominion University, Norfolk, VA; tSchool of Recreation, Health, and Tourism, George Mason University, Manassas, VA; tDepartment of Mechanical Engineering, Old Dominion University, Norfolk, VA; §School of Allied Medical Professions, The Ohio State University, Columbus Context: Altered neuromuscular control strategies during fatigue probably contribute to the increased incidence of noncontact anterior cruciate ligament injuries in female athletes. Objective: To determine biomechanical differences between 2 fatigue protocols (slow linear oxidative fatigue protocol [SLOFP] and functional agility short-term fatigue protocol [FAST-FP]) when performing a running-stop-jump task. Design: Controlled laboratory study. Setting: Laboratory. Patients or Other Participants: A convenience sample of 15 female soccer players (age = 19.2 ± 0.8 years, height = 1.67 ± 0.05 m, mass = 61.7 ± 8.1 kg) without injury participated. Intervention(s): Five successful trials of a running-stopjump task were obtained prefatigue and postfatigue during the 2 protocols. For the SLO-FP, a peak oxygen consumption (V02peak) test was conducted before the fatigue protocol. Five minutes after the conclusion of the V02peak test, participants started the fatigue protocol by performing a 30-minute interval run. The FAST-FP consisted of 4 sets of a functional circuit. Repeated 2 (fatigue protocol) x 2 (time) analyses of variance were conducted to assess differences between the 2 protocols and time (prefatigue, postfatigue).
Main Outcome Measure(s): Kinematic and kinetic measures of the hip and knee were obtained at different times while participants performed both protocols during prefatigue and postfatigue. Results: Internal adduction moment at initial contact (lC) was greater during FAST-FP (0.064 ± 0.09 Nm/kgm) than SLOFP (0.024±0.06 Nm/kgm) (FI14=5.610, P=.03). At IC, participants had less hip flexion' postfatigue (44.7° ± 8.1 0) than prefatigue (50.1°±9S) (F1,14=16.229, P=.001). At peak vertical ground reaction force, participants had less hip flexion postfatigue (44.7° ± 8.4 0) than prefatigue (50.4° ± 10.3°) (F1 14 = 17.026, P= .001). At peak vertical ground reaction force, participants had less knee flexion postfatigue (-35.9° ± 6.5°) than prefatigue (-38.8° ±5.03°) (FI14= 11.537, P= .001). Conclusions: bur results demonstrated a more erect landing posture due to a decrease in hip and knee flexion angles in the postfatigue condition. The changes were similar between protocols; however, the FAST-FP was a clinically applicable 5-minute protocol, whereas the SLO-FP lasted approximately 45 minutes. Key Words: anterior cruciate ligament, hip, knee, biomechanics
Key Points •
• •
Both the slow linear oxidative fatigue protocol (SLO-FP) and the functional agility short-term fatigue protocol (FAST-FP) demonstrated that the lower extremity is at a higher risk for sustaining injury when fatigue and unanticipated movement are combined. Similar lower extremity biomechanical modifications occurred after 5 minutes of fatigue during the FAST-FP and after 45 minutes of fatigue during the SLO-FP. Fatigue-induced decreases in hip and knee flexion resulted in a more extended landing posture, which can increase anterior tibial translation and thus increase strain on the anterior cruciate ligament.
urrent research on anterior cruciate ligament (ACL) injury and the implications of sex continue to reveal an increased incidence in females sustaining noncontact ACL injury.l-4 When comparing the incidence of ACL injury in intercollegiate athletics, Mihata et al2 found the incidence was almost 3 times higher in female than male soccer athletes,
C
32
Volume 47 • Number 1 • February 2012
JAT 47-1 04_onate.032-041.indd 32
whereas it was almost 4 times higher in female than male basketball players. In intercollegiate athletics, Hootman et al5 reported that 3 of the 4 sports with the highest rates of ACL injury were women's sports: gymnastics, soccer, and basketball. Anterior cruciate ligament injury has multiple negative health consequences, including early onset of osteoarthritis, damage
to menisci and chondral surfaces, increased probability of ad- force. Furthermore, those changes would be more pronounced after the FAST-FP. ditional surgery, and decreased activity level due to functional instability.6,7 In a 20-year follow-up study of operatively repaired ACL ruptures, Maletius and Messner6 found that 87% METHODS of patients had signs of osteoarthritis on radiographic examination, 45% of patients had undergone additional surgery, and Participants only 23% of patients were satisfied with their knee function. An a priori power calculation was conducted to estimate the The 4 categories of risk factors for ACL injury are anatomisample needed to establish differences between fatigue protocal, hormonal, environmental, and neuromuscular.8,9 Of all the cols. Using data from the literature,11-13 we determined that a risk factors associated with ACL injury, altered neuromuscular control strategies and movement variables are most likely to sample size of approximately 15 participants was needed for a contribute to the greater incidence of noncontact ACL injury for power level of 80%, an a level of .05, and an anticipated effect size of 0.7. A convenience sample of 15 National Collegiate female athletes. to Neuromuscular control strategies are altered Athletic Association (NCAA) Division I female soccer players further when the effects of fatigue combined with unanticipated (age = 19.2±0.8 years, height=1.67±0.05 m, mass=61.7±8.1 movements are present.11 Fatigue has been found to increase peak proximal tibial anterior shear force,12 increase knee ab- kg) volunteered to participate. Inclusion criteria were no hisduction angle,11,13decrease knee flexion angle,12 decrease hip tory of cardiovascular or respiratory disease. In addition, clearance from the team physician to practice and play in games was flexion angle,l1 increase peak valgus angle and maximum valgus angle,11,13increase knee internal rotation,11,14and result in a required at the time of data collection. The dominant leg, which greater knee extension moment.12 Unanticipated movement has was defined as the leg that the participant would use to kick a soccer ball as far as possible, was analyzed. All participants been found to induce an increase in knee valgus moment, hip internal rotation, knee abduction, and knee internal rotation.11,15 provided written informed consent, and the study was approved by the Institutional Review Board of Old Dominion University. The combination of fatigue and unanticipated movement typically results in altered lower extremity mechanics in which the foot is planted, the knee is near full extension in an abducted Instrumentation position, and the femur (hip) is rotated internally; all of these The lower extremity was analyzed using 8 high-speed inare hypothesized mechanisms for ACL injuryY6-19 frared cameras (Vicon, Oxford, United Kingdom) sampling at The occurrence of the theorized risk factors associated with ACL injury varies depending on the task being analyzed. Vari- a rate of 270 Hz. Ground reaction forces were measured via 2 force plates (model 4060-10; Bertec Corporation, Columbus, ous tasks have been used in previous research, including sideOH) at a sampling rate of 1080 Hz. A metabolic cart (model step cutting,11,20drop_jump,13,21and stop_jumpI2,22tasks. The use Vmax 29c; CareFusion, San Diego, CA) was used during the of different tasks when analyzing the lower extremity biomeSLO- FP to measure submaximal oxygen consumption and chanical variables has yielded conflicting results. Researchpeak oxygen consumption (V02peak). The flow sensor was caliers11,20using the side-step cutting task have reported that fatigue brated against a 3.0-L syringe, and carbon dioxide and oxygen produces changes mainly in frontal-plane kinematics and kinetsensors were calibrated against known gases before the maxiics. However, researchers12 who analyzed the stop-jump task found that fatigue produces changes in both frontal-plane and mum oxygen consumption (V02max) test. The flow sensor and mouthpiece were attached to a headset, which was used to colsagittal-plane kinematics and kinetics. lect expired air. An average of the 3 highest, continuous, 20-s Current research on fatigue and its associated relationship interval oxygen consumption (V02) measurements was used to between noncontact ACL injuries has been focused on either short-term fatigue or long-term fatigue protocolsy,12,14,20,23-26calculate V02peak. A heart rate monitor (model FS2C; Polar Electro, Inc, Lake Success, NY) was used to collect measureShort-term fatigue protocols have induced fatigue through ments of resting and exercise heart rates during the entire test. single-leg squats,20 consecutive repetitions of vertical jumps From the standing (static) trial, a lower extremity kineand short sprints,12 and maximum repetitions on a leg-press matic model was created for each participant using Visual3D machine.25 No consensus exists in the literature to indicate (C-Motion, Inc, Germantown, MD). Motion at the hip, knee, which type of fatigue protocol results in greater biomechaniand ankle joints was quantified using this kinematic model. The cal alterations to the lower extremity during unanticipated standing (dynamic) trial with circular motion of the pelvis was movement. Furthermore, little research comparing the effects used to estimate a functional hip joint center.27,28Based on a of functional sport-specific fatigue on lower extremity joint power spectrum analysis, all kinematic and kinetic data were kinematics and kinetics is available. Soccer-specific fatigue low-pass filtered through a fourth-order, zero-phase lag, Butusing various aspects of an actual soccer practice and games terworth filter with a cutoff frequency of 25 Hz. should be implemented to accurately and effectively analyze the neuromuscular changes that occur during fatigued states in this specific population. Therefore, the purpose of our study Experimental Protocol was to determine biomechanical differences between 2 fatigue Participants wore spandex shorts, sports bras, and team protocols (slow linear oxidative fatigue protocol [SLO-FP] and functional agility short-term fatigue protocol [FAST-FP]) as running shoes (Supernova; Adidas AG, Herzogenaurach, Germeasured by various kinematic and kinetic variables. We hy- many). The participants were given a lO-minute warmup period, which consisted of self-directed cycling and stretching. pothesized that fatigue would negatively alter lower extremity biomechanics. Specifically, participants would have less hip After this period, 40 reflective markers were placed on specific anatomical landmarks. Thirty markers were tracking markers flexion and knee flexion and more knee valgus, hip abduction, consisting of 1 on each posterosuperior iliac crest and anterior vertical ground reaction force, and posterior ground reaction
Journal of Athletic Training
33
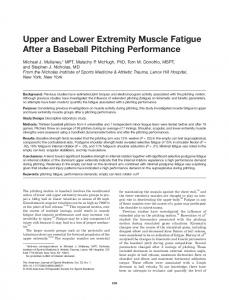
iliac crest, clusters of 4 on each thigh and shank, and 5 on each foot. The remaining 10 were calibration markers, which were placed on the greater trochanters, medial and lateral femoral condyles, and medial and lateral malleoli. The same researcher (N.C.) placed the markers on all participants. Pilot testing in our laboratory has shown good to excellent reliability in marker placement and data repeatability for lower extremity biomechanical measures (intraclass correlation coefficient range, 0.620-0.889). Standing and dynamic calibration trials were done to calculate hip joint center. After those trials, the calibration markers were removed. After the running-stop-jump task was explained, the participants were given time to practice. An infrared beam was placed across and 2 m before the force plates where the participants were running. When the participants crossed and interrupted the light beam, it triggered a software program, which we developed, on the desktop to randomly generate 1 of the soccer athletic tasks (eg, running stop-jump, side step) and project it onto a screen in front of the participants.29 For the purpose of our study, only the running-stop-jump task was used for analysis. Participants had to attain a minimal approach speed of 3.5 mls,30 which was monitored by a timing system (Brower Timing Systems, Draper, UT). The running-stop-jump task consisted of the participants standing at the beginning of the runway, running and planting onto the force plates with 1 foot on each force plate, and jumping straight into the air as if performing a soccer header. Testing trials were repeated if the participant did not land completely on the force plate or was unable to execute the trials at a minimum speed of 3.5 mls. After completing 5 successful unanticipated trials, the participants received instructions about the fatigue protocol to be performed. They rested for 1 minute between trials to minimize fatigue during prefatigue assessment. Functional Agility Short-Term Fatigue Protocol Before beginning the FAST-FP, 1 investigator (D.Q.) measured the participants' maximal vertical jumps with a measuring tape on the wall. The average of 3 maximal jumps was recorded as the participant's maximal vertical jump for the protocol. Participants began the fatigue protocol by performing a series of step-up and step-down movements onto and off of a 30-cm-high box for 20 seconds in time with a metronome set to 220 beats per minute. Next, the participants immediately performed 1 repetition of an L drill among 3 cones. Participants started in a 3-point stance in front of 3 cones that were set up in an L shape and spaced 4.5 yd (4.05 m) apart. Starting at the first cone, they sprinted 4.5 yd (4.05 m) to the second cone, sprinted back to the first cone, ran to the second cone, ran around the right side of the second cone and to the third cone, ran in a circle around the third cone from the inside to the outside, sprinted back to the second cone, ran around the left side of the second cone, and ran back to the first cone (Figure 1). Immediately after the L drill, participants performed 5 consecutive countermovement jumps, staying within 80% (±2%) of their maximal vertical jump recorded before the start of the protocol. Marks were placed within 80% (±2%) to ensure that they stayed within the range. After the vertical jumps, the participants ran down and back on an agility ladder. When completing the protocol for the first and third times, the participants ran forward, ensuring that both feet touched inside each space of the ladder. When completing the protocol for the second and fourth times, the participants went sideways, ensuring that both
34
Volume 47 • Number 1 • February 2012
JAT 47·1 04_onate.032·041.indd 34
~-----------------------------~:::~tC:-----~ '\
'
•
..-
"
.
t
"
2
Figure 1. Schematic fatigue protocol.
of the L drill of the functional
The distance
agility short-term
between cones was 4.5 yd (4.05 m).
feet touched inside each space of the ladder. The metronome also was used for the ladder drill and was set at 220 beats per minute so the participants would maintain a constant speed throughout the protocol. Completing the 4 tasks (step-up and step-down movements, L drill, vertical jumps, and ladder drill) counted as 1 set of the protocol. Participants had to perform 4 sets of the protocols with no rest in between, which took approximately 5 minutes per participant. Slow Linear Oxidative Fatigue Protocol Participants started the fatigue protocol by performing a test. The protocol was explained to the participants, and they were fitted with a mouthpiece and headset, which they were required to wear for the V02max test. Running shorts were placed over the tracking markers, and skin lubricant was applied to any areas on the participants' thighs that might rub and cause irritation during the prolonged run. The protocol for the V02max test has been used in previous research31,32and required the participants to run at 9 kmIh for 5 minutes followed by l-kmIh speed increments every 2 minutes until exhaustion. Participants were instructed to grab the sides of the treadmill when they felt they were fatigued maximally and could not continue running, at which point the treadmill was slowed down to a walk (Figure 2). A participant was considered to have reached maximal fatigue when she met 2 of the following criteria: (1) her heart rate reached 90% of her age-calculated maximum heart rate, (2) her respiratory quotient was more than 1.1, (3) she reached the plateau in the V02max curve, and (4) she was unable to continue running. The treadmill gradient was kept at 0° for the entire V02max test. After completing the V02max test, the participants rested for 5 minutes. Immediately after the rest period, the participants alternated between 2 running speeds throughout the 30-minute treadmill run. Six intervals consisting of running at a speed of 70% of the final V02max speed for 4 minutes followed by running at a speed of 90% of their final V02max speed for 1 minute were conducted. The estimated time for the V02max test was 15 minutes, which, when combined with the 30-minute treadmill run, equaled 45 minutes and simulated 1 half of a collegiate soccer match.
V02max
Posttest Fatigue Assessment After completing each fatigue protocol, the participants again were required to perform 5 successful unanticipated tri-
FAST-FP, participants were required to complete 3 vertical jumps between dynamic trials to maintain fatigue throughout the posttest fatigue assessment. The fatigue protocols (SLO-FP, FAST-FP) were counterbalanced between participants, with a I-week break between fatigue and data collection sessions. Statistical Analysis
Figure 2. A maximum fore the 30-minute fatigue
oxygen consumption running
protocol
test was conducted
for the slow
be-
linear oxidative
protocol.
als of the running-stop-jump task. After each running-stopjump task, participants immediately ran back to the start of the runway and performed another trial until 5 successful running-stop-jump tasks were completed. After completing the
Prefatigue conditions (SLO-FP, FAST-FP) were compared with a paired t test to assess the baseline assumption (prefatigue was equal between protocols) for possible comparison of postfatigue conditions between the SLO-FP and FAST-FP. The independent variables were fatigue protocols and time. Separate repeated-measures 2 (fatigue protocols: SLO-FP, FAST-FP) x 2 (time: prefatigue, postfatigue) analyses of variance were conducted for each dependent variable and time instant. Kinematic variables were knee flexion, knee abduction, knee rotation, hip flexion, and hip abduction. Kinetic variables were vertical and posterior ground reaction forces, knee flexion-extension moment, knee abduction-adduction moment, hip flexion moment, and hip abduction-adduction moment; these were measured at various time instants: initial contact, peak vertical and posterior ground reaction forces, peak knee flexion, and peak during the stance phase. Kinematic variables were measured in degrees, internal joint moments were normalized to height and mass, and ground reaction forces were normalized to body weight. Initial contact was defined as the time at which vertical ground reaction force was greater than 10 N. Peak was defined as the maximum value obtained between initial contact and 50% of stance phase. We used Visual3D and a custom-made MATLAB (The Math Works, Inc, Natick, MA) for data reduction to export data into SPSS (version 16.0; SPSS Inc, Chicago, IL). The average of 5 trials was used for all analyses. The a level was set a priori at .05.
Table 1. Descriptive Statistics for Kinematic Variables Between 2 Fatigue Protocols at Initial Contact, Peak Vertical Ground Reaction Force, Peak Posterior Ground Reaction Force, Peak Knee Flexion, and Peak Stance (Mean±SD) Slow Linear Oxidative Kinematic Variable
Pretest
Initial contact, 0 Knee flexion (-)/extension (+) Knee abduction (-)/adduction (+) Knee internal rotation (+)/external rotation (-) Hip flexion Hip abduction (-)/adduction (+) Peak vertical ground reaction force, 0 Knee flexion (-)/extension (+) Hip flexion Peak posterior ground reaction force, Knee flexion (-)/extension (+) Knee abduction (-)/adduction (+) Hip flexion Peak knee flexion, 0 Knee flexion (-)/extension (+) Knee abduction (-)/adduction (+) Hip flexion Hip abduction (-)/adduction (+) Peak stance, 0 Knee abduction (-)/adduction (+) Hip flexion
-27.4±8.5 -D.9±3.2
Fatigue Protocol Posttest
-24.5±9.2 -1.0±3.9
Functional Agility Short-Term Pretest
-25.9±8.1 -1.3±4.2
Fatigue Protocol Posttest
-25.2±9.1 -2.3±5.6
8.8±7.3 50.3±10.5 -5.0±5.2
8.8±6.5 46.5±6.6 -5.6±4.6
7.9± 7.8 49.9±8.4 -5.5±4.5
11.9±9.8 42.9±9.6 --6.4±5.8
-39.1 ±5.1 50.4±11.5
-36.1 ±7.4 46.9±7.3
-38.4±5.0 50.5±9.1
-35.7±5.6 42.5±9.5
-38.3±5.7 -D.4±4.7 51.3±12.0
-36.6± 7.8 -1.1 ±5.2 46.9±7.3
-38.5±5.5 -1.8±5.1 50.8±9.5
-34.9±6.7 -2.5±6.6 43.4±9.9
-55.9±7.8 -2.4±5.9 44.6±12.8 -1.8±4.1
-53.3±5.6 -3.7±6.2 40.5±7.6 -1.9±3.7
-57.61 ±8.9 -5.2±5.3 45.6± 10.4 -3.1±4.6
-51.6±10.1 -5.6±6.4 36.8±9.7 -4.4±4.7
-4.6±3.9 53.3±11.9
-5.5±5.1 49.1 ±6.7
-6.1±4.9 53.3± 10.0
0
-7.0±5.9 45.6±9.8
Journal of Athletic Training
JAT 47-1 04_onate.032-041.indd 35
35
Table 2. Descriptive Statistics for Kinetic Variables Between 2 Fatigue Protocols at Initial Contact, Peak Vertical Ground Reaction Force, Peak Posterior Ground Reaction Force, Peak Knee Flexion, and Peak Stance (Mean±SD) Slow Linear Oxidative Kinetic Variable Initial contact, Nm/kgm Knee abduction (-)/adduction moment
Posttest
Functional Agility Short-Term Pretest
Fatigue Protocol Posttest
(+)
Knee flexion (-)/extension (+) moment Peak vertical ground reaction force" Vertical ground reaction force Peak posterior ground reaction force" Posterior ground reaction force Peak knee flexion" Posterior ground reaction force Peak stance, Nm/kgm Knee flexion (-)/extension (+) moment Knee abduction (-)/adduction (+) moment "Indicates
Fatigue Protocol
Pretest
-0.006 ±0.28 0.08±0.21
-D.03± 0.24 0.02±0.15
0.05±0.20 0.04±0.18
0.071 ±0.23 0.06±0.23
5.1 ±1.3
5.2±1.1
4.6± 1.2
4.9± 1.3
1.9±0.5
1.8± 0.4
1.8±0.4
1.8±0.3
1.3±0.3
1.3± 0.3
1.2±0.4
1.3±0.3
2.09±0.33
2.08±0.30
1.98±0.33
1.92±0.39
0.34±0.16
0.37±0.25
0.33±0.13
0.41 ±0.22
ground reaction forces measures are given in multiples of body weight.
Table 3. Descriptive Statistics for Kinematic Variables by Protocol and Fatigue at Initial Contact, Peak Vertical Ground Reaction Force, Peak Posterior Ground Reaction Force, Peak Knee Flexion, and Peak Stance (Mean ± SD) Protocol Slow Linear Oxidative Fatigue
Kinematic Variable Initial contact, 0 Knee flexion(-)/extension(+) Knee abduction (-)/adduction (+) Hip flexion Hip abduction (-)/adduction (+) Knee internal rotation (+)/external rotation (-) Peak vertical ground reaction force, 0 Knee flexion (-)/extension (+) Hip flexion Peak posterior ground reaction force, Knee flexion (-)/extension (+) Knee abduction (-)/adduction (+) Hip flexion Peak knee flexion, 0 Knee flexion (-)/extension (+) Knee abduction (-)/adduction (+) Hip flexion Hip abduction (-)/adduction (+) Peak stance, 0 Knee abduction Hip flexion
(-)/adduction
(+)
Posttest
-25.6±8.6 -1.8±4.9 46.4±9.0 -5.9±5.1 9.9±8.8
-26.6±8.3 -1.1 ±3.7 50.1±9.5 -5.2±4.9 8.4± 7.5
-24.9±9.2 -1.7±4.7 44.7±8.1 -6.0±5.2 10.3±8.2
-37.6±6.3 48.7±9.4
-37.0±5.3 46.5±9.3
-38.8±5.0 50.4±10.3
-35.9±6.5 44.7±8.4
-37.5±6.7
-36.7±6.1
-38.4±5.6
-35.8± 7.2
0
49.1 ±9.7
47.1 ±9.7
51.1 ± 10.8
45.2±8.6
-54.6±6.7 -3.0±6.0 42.6±10.2 -1.8±3.9
-54.6±9.5 -5.4±5.8 41.2 ± 10.1 -3.8±4.6
-56.8±8.3 -3.8±5.6 45.1 ± 11.6 -2.4±4.4
-52.5± 7.9 -4.7±6.3 38.7±8.7 -3.1±4.2
-5.0±4.5 51.2±9.3
-6.5±5.4 49.5±9.9
-3.8±4.4 53.3±11.0
-4.7±5.5 47.3±8.2
Descriptive statistics are presented in Tables 1-4. Participants had an approach speed of 3.6±0.19 mls before SLO-FP, 3.5±0.14 mls after SLO-FP, 3.6±0.12 mls before FAST-FP, and 3.5 ±0.12 mls after FAST-FP. We found no differences between approach speeds for either protocol or fatigue condition (P>.05). Fatigue The primary differences attained due to the fatigue main effect were observed at the sagittal plane of the knee and hip at the
Volume 47 • Number 1 • February 2012
JAT 47-1 04_onate.032-041.indd 36
Pretest
-25.9±8.9 -0.96±3.5 48.4±8.6 -5.3±4.9 8.8±6.9
RESULTS
36
Fatigue
Functional Agility ShortTerm Fatigue
different time instants. Participants landed with less hip flexion at postfatigue than prefatigue at all time instants analyzed. At initial contact, the participants landed in less hip flexion postfatigue (44.7°±8.1°) than prefatigue (50.1°±9S) (Fl,14= 16.229, P=.OOI, Cohen d=0.57). At peak vertical ground reaction force, participants landed in less hip flexion postfatigue (44.7°±8.4°) than prefatigue (50.4°±1O.3°) (Fl,14= 17.026, P=.OOI, Cohen d=0.55). At peak posterior ground reaction force, participants had less hip flexion postfatigue (45.2° ± 8.6°) than prefatigue (51.1°±1O.8°) (Fl,14= 18.533, P=.OOI, Cohen d=0.55) (Figure 3). At peak knee flexion, participants landed in less hip flexion postfatigue (38.7°±8.7°) than prefatigue (45.1 o± 11.6°) (Fl,14= 17.331, P=.OOI, Cohen d=0.55)
Table 4. Descriptive Statistics for Kinetic Variables by Protocol and Fatigue at Initial Contact, Peak Vertical Ground Reaction Force, Peak Posterior Ground Reaction Force, Peak Knee Flexion, and Peak Stance (Mean ± SO) Protocol Slow Linear Oxidative Fatigue
Kinetic Variable Initial contact, Nm/kgm Knee flexion (-)/extension (+) moment Knee abduction (-)/adduction (+) moment Peak vertical ground reaction force" Vertical ground reaction force Peak posterior ground reaction force" Posterior ground reaction force Peak knee flexion" Posterior ground reaction force Peak stance, Nm/kgm Knee flexion (-)/extension (+) moment Knee abduction moment "Indicates
(-)/adduction
Fatigue
Functional Agility ShortTerm Fatigue
Pretest
Posttest
0.051 ±0.18
0.050±0.20
0.057±0.19
0.044±0.19
0.024±0.06
0.064±0.09
0.037±0.06
0.048±0.09
5.1 ± 1.2
4.8± 1.2
4.9±1.2
5.1 ± 1.2
1.9±0.42
1.8± 0.36
1.9±0.45
1.8± 0.34
1.3± 0.30
1.2± 0.33
1.2± 0.35
1.3± 0.27
2.01 ±0.32
1.9±0.36
2.0±0.33
2.0±0.35
0.36±0.21
0.37±0.18
0.34±0.14
0.39±0.24
(+)
ground reaction forces measures are given in multiples of body weight.
(Figure 3). Lastly, at peak hip flexion, participants landed in less hip flexion postfatigue (47.3°±8.2°) than prefatigue (53.3°± 10.95°) (Fl,14 = 16.616, P=.OOI, Cohen d=0.55). For knee flexion, the following differences were obtained. At peak knee flexion participants landed in less knee flexion postfatigue (-52S±7.9°) than prefatigue (56.8°±8.3°) (Fl,14 = 24.346, P < .001, Cohen d = 0.52) (Figure 4). At peak vertical ground reaction force, participants landed in less knee flexion postfatigue (-35.9°±6S) than prefatigue (-38.8°±5.03°)
(Fl,14 = 11.537, P=.OOI, Cohen d=0.48). Lastly, at peak posterior ground reaction force, participants landed in less knee flexion postfatigue (-35.8°±7.2°) than prefatigue (-38.4°±5.6°) (Fl,14 =9.300, P=.OO9, Cohen d=0.39). Protocol At peak knee flexion, hip abduction ing the posttest of FAST-FP (-3.8°±4.6°)
was greater durthan the SLO-FP
55.0
40.0 Cl
.;
c: ell
E
ell U C'll
c.. l/l
25.0
C
•..
~
::::l Cl
c:
«
10.0
-5.0
o
25
100
75
50
Stance Phase, % --
Figure 3. Hip flexion fatigue
protocol
Pre functiOr\Ell agility short-Ierm -
- - - - Post functional
Pre slow linear oxidative fatigue
angle during
(prefatigue
fatigue
-
the slow linear oxidative
and postfatigue
conditions)
fatigue
- -
agility short-term
fatigue
Post slow linear oxidati"-'e fatigue
protocol
in a running-stop-jump
and functional
agility
short-term
task.
Journal of Athletic Training
JAT 47-1 04_onate.032-041.indd 37
37
-18.3
-28.7 0
.J'
r:::
\\
ell
E ell
(,)
cu Q.
.!!!
-39.1
c
•..
\\"
!i! ~ Cl
r:::
«
\
-49.5
~~
-
-
~
'----60.
o
25
50
75
100
Stance Phase, % --
-
Pre functional agility short-term fatigue
- - - -
Post functional agility short-term fatigue
Pre slOw linear oxidative fatigue
-
Post slow linear oxida~ve faligue
• -
Figure 4. Knee flexion angle during the slow linear oxidative fatigue protocol and functional fatigue protocol (prefatigue and postfatigue
conditions)
(-1.8°±3.9°) (Fl,14= 13.086, P=.OO3, Cohen d=0.41). At initial contact, internal knee adduction moment was greater during the FAST-FP (0.064±0.09 Nmlkgm) than the SLO-FP (0.024±0.06 Nmlkgm) (Fl,14=5.61O, P=.03, Cohen d=0.44). At peak stance (maximum value), internal knee extension moments were greater during the SLO-FP (2.01±0.32 Nmlkgm) than the FAST-FP (1.9±0.36 Nmlkgm) (Fl,14=6.486, P=.02, Cohen d=0.31). The only interaction attained was at initial contact. We found that knee internal rotation was greater after the FASTFP (1l.9°±9.8°) than before the FAST-FP (7.9°±7.8°) (Fl,14=7.025, P=.02, Cohen d=0.41). DISCUSSION We evaluated the effects of 2 fatigue protocols (SLO-FP, FAST-FP) on lower extremity biomechanics during an unanticipated running-stop-jump task in female NCAA Division I soccer players. We hypothesized that fatigue would induce lower extremity biomechanical alterations in the hip and knee during the landing phase of the running-stop-jump task. One of our main results was a decrease in knee and hip flexion after the 2 types of fatigue protocols. The participants presented a more erect or extended position after being fatigued. Landing with the knee in a more extended position is thought to increase anterior shear force on the proximal end of the tibia via an increased patellar tendon-tibia shaft angle.33 Researchers have suggested that increased tibial anterior shear force results in increased loads being placed on the ACL,12,21Blackburn and
38
Volume 47 • Number 1 • February 2012
JAT 47·1 04_onate.032·041.indd 38
in a running-stop-jump
agility short-term
task.
Padua34 showed that landing in a more erect posture results in increased ground reaction forces and subsequent quadriceps activation. Therefore, our participants might have increased the strain placed on the ACL and consequently increased ACL loading because of their erect positions. The decreased joint angles (eg, knee flexion) are thought to produce a mechanical disadvantage for the hamstring muscles by decreasing their angles of pull and reducing the amount of posterior force that can be applied to the tibia.35 This decreased posterior force allows increased anterior translation, which also could increase the load placed on the ACL,35 The combination of lower knee and hip joint angles during an unanticipated task (decision-making process) under a fatigued condition might increase the likelihood of injury. The fatigue protocols created for our study were based on previous research; however, various aspects of each protocol are unique to our study. The FAST-FP used tasks, including vertical jumps12 and step-ups,13 from previous research. To our knowledge, the L drill and agility ladder have not been used to induce fatigue; we chose both activities to reproduce the functional demands of soccer. The Vo2max protocol used in the SLO-FP was based on previous research.31,32The 30-minute treadmill run was based on the fatigue protocol of Sanna and O'Connor.14 Fatigue has been shown to alter hip and knee kinematics during various athletic tasks.13,20,21,36 Our results, which showed that fatigue changes lower extremity biomechanics during a landing task, are similar to those of other investigators.ll,12,20Chappell et al12 found a decrease in knee flexion angle at peak proximal tibial anterior shear force in a stop-jump
task similar to the one we used. Their participants had a knee flexion angle at prefatigue of 26.3° and at postfatigue of 23.1 0, representing a 12% decrease between fatigue states.12 We analyzed knee flexion at peak posterior ground reaction force and peak vertical ground reaction force, both of which have been shown to be correlated with peak proximal tibial anterior shear force,37 and found a decrease of 6.9% (prefatigue=-38.4°, postfatigue=-35.8°) and 7.4% (prefatigue= -38.8°, postfatigue =-35.9°), respectively. The percentage change for our study was smaller than the change reported by Chappell et al.12 The smaller decrease in knee flexion angle in our study could be a result of the increased level of conditioning and athletic ability present in our participants. However, the reduced knee flexion angle at peak posterior ground reaction force still might be increasing the load on the ACL, thereby increasing its likelihood of rupture. Cerulli et al38 analyzed the strain placed on the ACL during rapid deceleration and found ACL strain to be highest during peak ground reaction force. Anterior displacement of the tibia via the quadriceps is most pronounced between 15° and 45° of knee flexion, with the peak anterior translation occurring at 30° of knee flexion.39 With fatigue, knee flexion decreased from -38.8° to -35.9° at peak vertical ground reaction force and decreased from -38.4° to -35.8° at peak posterior ground reaction force. In effect, fatigue is moving the knee closer to 30° of knee flexion, where peak anterior translation of the tibia is thought to occur. However, this change in flexion of approximately 3° might not appear to be clinically relevant. From our standpoint, we cannot precisely say whether the 3° change is clinically important; however, we believe it is relevant and important when analyzing how the lower extremity responds to the demands of fatigue. This small change can represent the difference between injury and no injury occurring. We and others11,13,14,20 analyzed lower extremity biomechanics during the performance of various unanticipated tasks. Although each task performed was unanticipated, the participant knew the task had to be 1 of 3 options and was never exposed to repeated unanticipated movements. Therefore, to complete a successful trial, the participant was required only to complete 1 unanticipated movement without being concerned with what would happen next. In real-life game situations, athletes are exposed to a constantly evolving environment in which they are required to perform multiple unanticipated movements in conjunction with each other. This collection of unanticipated movements along with a combination of motion in the sagittal, frontal, and transverse planes might be what produces the abnormal out-of-plane motion commonly seen during an ACL injury. In the future, researchers should examine the effects that multiple unanticipated movements have on lower extremity biomechanics. Landing in a more extended position possibly decreases the capability of the lower extremity to effectively absorb shock through decreased flexion of the joints.40 This increased force on the knee joint could decrease the stability of the joint, making it more susceptible to out-of-plane motions and increasing the likelihood of ACL injury. Researchers have analyzed the landing phase of single-legged jumps both prefatigue and postfatigue and have found the following frontal-plane changes: increased knee abduction and internal rotation,11,13,20,41 increased hip internal rotation,11,20,42and increased hip internal rotation moment from prefatigue to postfatigue.20 The task used in those studies differed from the running-stop-jump task we used. The lower extremity biomechanical adaptation for the demands of
different tasks partially might explain the difference in results. With the running-stop-jump task, the demands occur primarily in the sagittal plane with full deceleration to perform a vertical jump, whereas the side-step cutting task combines a deceleration with an acceleration phase and a change in direction (eg, 45° angle). Characteristics of both tasks have been observed during ACL tear events; however, the difference between these tasks makes comparison challenging. How each task (running stop, side-step cut, single-legged landing, and double-legged landing) is modified by increasing or decreasing the lower extremity biomechanical variables is important and should be the focus of future research. Although the differences between the 2 fatigue protocols were minimal, we found that the FAST-FP induced changes in frontal-plane hip and knee biomechanics when compared with the SLO-FP. Hip abduction at peak knee flexion was greater during the FAST-FP than during the SLO-FP. The multidirectional movements associated with the FAST-FP possibly induced greater amounts of fatigue to the hip musculature of our participants, resulting in greater hip abduction after FASTFP. The multidirectional functional protocol recruited various muscle groups (eg, flexors and extensors, abductors and adductors), whereas the SLO-FP affected primarily the flexors and extensors. This increased hip abduction angle during landing has been associated with excessive knee valgus and abduction moments.21,43 Furthermore, at initial contact participants had greater knee adduction moments during the FAST-FP than the SLO-FP. In the transverse plane, knee internal rotation increased from prefatigue to postfatigue in the FAST-FP. Fatigue has been shown to alter knee abduction and adduction moments20 and knee internal rotation11 during landing tasks. We assume that a relationship exists between the increase in internal knee adduction moment induced by the FAST-FP and the increased knee internal rotation present postfatigue during the FAST-FP. The increased internal knee adduction moment probably is a response to an increased external valgus load attempting to force the knee into an abducted position. Our assumption is based on the premise that an external knee abduction moment tends to produce an abducted knee angle that would be resisted by an internal knee adduction moment. Our results indicated that both the SLO-FP and FAST-FP induced similar kinematic and kinetic changes to the lower extremity during the running-stop-jump task. The fatigue protocols elicited the largest variations in sagittal-plane lower extremity kinematics. Specifically, participants landed with less hip flexion at all time instances analyzed. Sagittal-plane knee mechanics were altered with fatigue; specifically, a decrease in knee flexion was seen at peak vertical ground reaction force, peak posterior ground reaction force, and peak knee flexion. Researchers who did not completely use a SLO-FP or FAST-FP but induced lower extremity fatigue found similar results for these kinematic variablesy,12,20 An interesting result to note is the lack of difference between fatigue protocols (SLO-FP and FAST-FP). Most prefatigue to postfatigue changes were observed regardless of the fatigue protocol used, with minimal differences noted between the 2 protocols. One possible reason for the similarities between the SLO-FP and FAST-FP was that our participant population was accustomed to a wide range of activity, including short-term, high-intensity exercise and long-duration, low-intensity exercise. During competition, elite female soccer athletes change activity an average of 1459 times. The changes in activity range from standing to walking, low-intensity running, and high-
Journal of Athletic Training
JAT 47·1 04_onate.032·041.indd 39
39
intensity running.44 Krustrup et al44 reported that elite female soccer players had an average heart rate during a competitive match that was 87% of their maximum heart rates. The average heart rate for our participants during both fatigue protocols was 89.6% of their maximum heart rates, which was similar to what is experienced during competition. Therefore, our participant population of elite soccer athletes appears to have been able to adjust accordingly to both the SLO-FP and FAST-FP because both protocols are similar to what is experienced during a game. We initially hypothesized that the FAST-FP would create greater changes on the lower extremity biomechanics because of its functional drills performed at high intensity. However, the SLO-FP with moderate intensity produced similar biomechanical adaptations in our participants. When ACL injuryprevention programs are developed, feedback on proper mechanics should be stressed early because fatigue-related lower extremity modifications occur in as few as 5 minutes of intense multidirectional movements. Both fatigue protocols appear to be anaerobic; that is, the participants were at or above their anaerobic threshold at the end of both. Furthermore, the finding that the most severe neuromuscular changes, which include increased hip abduction, increased knee internal rotation, and increased internal knee adduction moment, occurred after 5 minutes of exercise (FAST-FP) when compared with 45 minutes of exercise (SLO-FP) is clinically relevant. A 5minute fatigue protocol similar to the FAST- FP could be used to induce fatigue. A quick and effective screening process similar to the Landing Error Scoring System45 could be implemented to analyze lower extremity biomechanics in a fatigued state. This tool could be used to identify lower extremity movement patterns that place people at high or low risk for ACL injury. This would be an inexpensive and efficient process to determine which risk factors are modified during fatigue conditions and, therefore, which areas should be the focus of an ACL injury-prevention program. Individualized prevention programs that consider specific neuromechanical characteristics with and without fatigue should be developed. This would allow people to adjust their specific risk factors in an unfatigued state. The same prevention program would be completed again near the end of practice, when participants are fatigued. Each participant would be given proper feedback on how to improve her previously identified neuromechanical risk factors. Therefore, this instruction could carry over to game situations that take place during fatigued states. CONCLUSIONS One of our main outcomes was the similarity of the 2 fatigue protocols. Both demonstrated that when fatigue and unanticipated movement are combined, the lower extremity is at a higher risk for sustaining injury. Similar lower extremity biomechanical modifications occurred after 5 minutes of fatigue with the FAST- FP and after 45 minutes of fatigue with the SLOFP. Altered lower extremity biomechanical movement patterns are known risk factors for ACL injury. Our results indicated that fatigue, regardless of type, makes these biomechanical risk factors more pronounced. Therefore, ACL injury-prevention programs should be designed to prevent the detrimental effects of fatigue. To accomplish this, people need to be trained and instructed on proper mechanics while in a fatigued state. During this fatigued state, feedback on proper mechanics should be given early and often and should be continued throughout
40
Volume 47 • Number 1 • February 2012
JAT 47·1 04_onate.032·041.indd 40
the injury-prevention program. We found fatigue-induced decreases in hip and knee flexion, resulting in a more extended landing posture. Landing in a more extended position is thought to increase anterior tibial translation and thus increase the strain placed on the ACL. The FAST-FP produced increases in hip abduction, internal knee adduction moment, and knee internal rotation, all of which are either a cause or result of increased valgus loading on the knee joint. REFERENCES 1. Agel J, Arendt EA, Bershadsky B. Anterior cruciate ligament injury in National Collegiate Athletic Association basketball and soccer: a 13-year review. Am J Sports Med. 2005;33(4):524-530. 2. Mihata LC, Beutler AI, Boden BP. Comparing the incidence of anterior cruciate ligament injury in collegiate lacrosse, soccer, and basketball players: implications for anterior cruciate ligament mechanism and prevention. Am J Sports Med. 2006;34(6):899-904. 3. Mountcastle SB, Posner M, Kragh IF Jr, Taylor DC. Gender differences in anterior cruciate ligament injury vary with activity: epidemiology of anterior cruciate ligament injuries in a young, athletic population. Am J Sports Med. 2007;35(10):1635-1642. 4. Uhorchak JM, Scoville CR, Williams GN, Arciero RA, St Pierre P, Taylor DC. Risk factors associated with noncontact injury of the anterior cruciate ligament: a prospective four-year evaluation of 859 West Point cadets. Am J Sports Med. 2003;31(6):831-842. 5. Hootman JM, Dick R, Agel J. Epidemiology of collegiate injuries for 15 sports: summary and recommendations for injury prevention initiatives. J Athl Train. 2007;42(2):311-319. 6. Maletius W, Messner K. Eighteen- to twenty-four-year follow-up after complete rupture of the anterior cruciate ligament. Am J Sports Med. 1999; 27(6):711-717. 7. Yu B, Garrett WE. Mechanisms of non-contact ACL injuries. Br J Sports Med. 2007;41(suppll):i47-i51. 8. Griffin LY, Agel J, Albohm MJ, et al. Noncontact anterior cruciate ligament injuries: risk factors and prevention strategies. J Am Acad Orthop Surg.2000;8(3):141-150. 9. Schulz BW, Ashton-Miller JA, Alexander NB. The effects of age and step length on joint kinematics and kinetics of large out-and-back steps. Clin Biomech (Bristol, Avon). 2008;23(5):609-618. 10. Malinzak RA, Colby SM, Kirkendall DT, Yu B, Garrett WE. A comparison of knee joint motion patterns between men and women in selected athletic tasks. Clin Biomech (Bristol, Avon). 2001;16(5):43~45. II. Borotikar BS, Newcomer R, Koppes R, McLean SG. Combined effects of fatigue and decision making on female lower limb landing postures: central and peripheral contributions to ACL injury risk. Clin Biomech (Bristol, Avon). 2008;23(1):81-92. 12. Chappell ro, Herman DC, Knight BS, Kirkendall DT, Garrett WE, Yu B. Effect of fatigue on knee kinetics and kinematics in stop-jump tasks. Am J Sports Med. 2005;33(7):1022-1029. 13. McLean SG, Fellin RE, Suedekum N, Calabrese G, Passerallo A, Joy S. Impact of fatigue on gender-based high-risk landing strategies. Med Sci Sports Exerc. 2007;39(3):502-514. 14. Sauna G, O'Connor KM. Fatigue-related changes in stance leg mechanics during sidestep cutting maneuvers. Clin Biomech (Bristol, Avon). 2008;23(7):946-954. 15. Besier TF, Lloyd DG, Ackland TR, Cochrane JL. Anticipatory effects on knee joint loading during running and cutting maneuvers. Med Sci Sports Exerc.2001;33(7):1176-1181. 16. Boden BP, Dean GS, Feagin JA Jr, Garrett WE Jr. Mechanisms of anterior cruciate ligament injury. Orthopedics. 2000;23(6):573-578. 17. Hewett TE, Myer GD, Ford KR. Reducing knee and anterior cruciate ligament injuries among female athletes: a systematic review of neuromuscular training interventions. J Knee Surg. 2005;18(1):82-88. 18. Liederbach M, Dilgen FE, Rose DJ. Incidence of anterior cruciate ligament injuries among elite ballet and modem dancers: a 5-year prospective study. Am J Sports Med. 2008;36(9):1779-1788. 19. Olsen OE, Myklebust G, Engebretsen L, Bahr R. Injury mechanisms for
20.
21.
22.
23.
24.
25.
26.
27. 28. 29. 30.
31.
anterior cruciate ligament injuries in team handball: a systematic video analysis. Am J Sports Med. 2004;32(4):1002-1012. McLean SG, Samorezov JE. Fatigue-induced ACL injury risk stems from a degradation in central control. Med Sci Sports Exerc. 2009;41(8):16611672. Kernozek TW, Torry MR, Iwasaki M. Gender differences in lower extremity landing mechanics caused by neuromuscular fatigue. Am J Sports Med. 2008;36(3):554-565. Chappell ro, Creighton RA, Giuliani C, Yu B, Garrett WE. Kinematics and electromyography of landing preparation in vertical stop-jump: risks for noncontact anterior cruciate ligament injury. Am J Sports Med. 2007;35(2):235-241. McLean SG, Huang X, van den Bogert AJ. Investigating isolated neuromuscular control contributions to non-contact anterior cruciate ligament injury risk via computer simulation methods. Clin Biomech (Bristol, Avon). 2008;23(7):926-936. Melnyk M, Gollhofer A. Submaximal fatigue of the hamstrings impairs specific reflex components and knee stability. Knee Surg Sports Traumatol Arthrosc. 2007; 15(5):525-532. Gehring D, Melnyk M, Gollhofer A. Gender and fatigue have influence on knee joint control strategies during landing. Clin Biomech (Bristol, Avon). 2009;24(1 ):82-87. McLean SG, Borotikar B, Lucey SM. Lower limb muscle pre-motor time measures during a choice reaction task associate with knee abduction loads during dynamic single leg landings. Clin Biomech (Bristol, Avon). 2010;25(6):563-569. Begon M, Monnet T, Lacouture P. Effects of movement for estimating the hip joint centre. Gait Posture. 2007;25(3):353-359. Schwartz MH, Rozumalski A. A new method for estimating joint parameters from motion data. J Biomech. 2005;38(1):107-116. Cortes N, Blount E, Ringleb S, Onate JA. Soccer-specific video simulation for improving movement assessment. Sports Biomech. 2011;10(1):22-34. Landry SC, McKean KA, Hubley-Kozey CL, Stanish WD, Deluzio KJ. Neuromuscular and lower limb biomechanical differences exist between male and female elite adolescent soccer players during an unanticipated run and crosscut maneuver. Am J Sports Med. 2007;35(11):1901-1911. Flouris AD, Koutedakis Y, Nevill A, Metsios GS, Tsiotra G, Parasiris Y. Enhancing specificity in proxy-desigu for the assessment of bioenergetics. J Sci Med Sport. 2004;7(2):197-204.
32. Metsios GS, Flouris AD, Koutedakis Y, Theodorakis Y. The effect of performance feedback on cardiorespiratory fitness field tests. J Sci Med Sport. 2006;9(3):263-266. 33. Hughes G, Watkins J. A risk-factor model for anterior cruciate ligament injury. Sports Med. 2006;36(5):411-428. 34. Blackburn IT, Padua DA. Sagittal-plane trunk position, landing forces, and quadriceps electromyographic activity. J Athl Train. 2009;44(2):174-179. 35. Pandy MG, Shelburne KB. Dependence of cruciate-ligament loading on muscle forces and external load. J Biomech. 1997;30(10):1015-1024. 36. MacDonald SW, Hultsch DF, Dixon RA. Performance variability is related to change in coguition: evidence from the Victoria Longitudinal Study. Psychol Aging. 2003;18(3):510-523. 37. Yu B, Lin CF, Garrett WE. Lower extremity biomechanics during the landing of a stop-jump task. Clin Biomech (Bristol, Avon). 2006;21(3):297-305. 38. Cerulli G, Benoit DL, Lamontagne M, Caraffa A, Uti A. In vivo anterior cruciate ligament strain behaviour during a rapid deceleration movement: case report. Knee Surg Sports Traumatol Arthrosc. 2003;11(5):307-311. 39. Hirokawa S, Solomonow M, Lu Y, Lou ZP, D'Ambrosia R. Anteriorposterior and rotational displacement of the tibia elicited by quadriceps contraction. Am J Sports Med. 1992;20(3):299-306. 40. Decker MI, Torry MR, Wyland DJ, Sterett WI, Steadman JR. Gender differences in lower extremity kinematics, kinetics and energy absorption during landing. Clin Biomech (Bristol, Avon). 2003;18(7):662-669. 41. McNair PJ, Hewson DJ, Dombroski E, Stanley SN. Stiffness and passive peak force changes at the ankle joint: the effect of different joint angular velocities. Clin Biomech (Bristol, Avon). 2002;17(7):536-540. 42. Baca A. A comparison of methods for analyzing drop jump performance. Med Sci Sports Exerc. 1999;31(3):437-442. 43. Chappell ro, Yu B, Kirkendall DT, Garrett WE. A comparison of knee kinetics between male and female recreational athletes in stop-jump tasks. Am J Sports Med. 2002;30(2):261-267. 44. Krustrup P, Mohr M, Ellingsgaard H, Bangsbo J. Physical demands during an elite female soccer game: importance of training status. Med Sci Sports Exerc. 2005;37(7):1242-1248. 45. Padua DA, Marshall SW, Boling MC, Thigpen CA, Garrett WE Jr, Beutler AI. The Landing Error Scoring System (LESS) is a valid and reliable clinical assessment tool of jump-landing biomechanics: the JUMP-ACL study. Am J Sports Med. 2009;37(10):1996-2002.
Address correspondence to James Onate, PhD, ATC, School of Allied Medical Professions, The Ohio State University, 228C Atwell Hall, 453 West 10th Avenue, Columbus, OH 43210. Address e-mail to
[email protected].
Journal of Athletic Training
JAT 47·1 04_onate.032·041.indd 41
41