Abstract. The load capacitance of a CMOS gate has been experimentally characterized by two independent methods on the particular wafers fabricated for.
Semicond. Sci. Technol. 13 (1998) 773–775. Printed in the UK
PII: S0268-1242(98)89777-0
Two experimental methods to characterize load capacitance of a CMOS gate Kai Chen†, Chenming Hu†, Peng Fang†‡, Min Ren Lin†‡ and Donald L Wollesen†‡ † Department of Electrical Engineering and Computer Sciences, University of California, Berkeley, CA 94720-1772, USA ‡ Advanced Micro Devices, Sunnyvale, CA 94088-3453, USA Received 4 December 1997, in final form 10 February 1998, accepted for publication 12 March 1998 Abstract. The load capacitance of a CMOS gate has been experimentally characterized by two independent methods on the particular wafers fabricated for this study. Agreement between the two methods is obtained and confirmed using CMOS ring oscillators with gate oxide thicknesses from 2.5 to 5.8 nm and effective channel lengths down to 0.21 µm at voltages from 1.5 to 3.3 V. This study provides the capacitance data for an analytical gate delay model.
1. Introduction To accurately evaluate and predict the impact of gate oxide thickness, Toxe , effective channel length, Leff , and supply voltage, Vdd , scaling and the effect of interconnect capacitance, Cint , on CMOS gate propagation delay, tpd , analytical gate delay models have been developed [1, 2]. The accuracy or effectiveness of these analytical models rely on the accuracy of inverter load capacitance, CL . Although some work has been carried out to understand this important parameter [3], a detailed experimental characterization of CL as a function of all the above variables has been lacking in the literature. This paper presents the results of two independent methods experimentally characterizing CL . The CL model resulting from this study was used to predict tpd [1] and the predictions are compared with measured tpd taken from wafers with gate oxide thicknesses from 2.5 to 5.8 nm at voltages from 1.5 to 3.3 V with Leff down to 0.21 µm. It should be noted that the drawn channel length we used in this study was 0.4 µm, as labelled on the figures of this paper. The effective length is extracted by conventional channel resistance against Ldrawn at Vds = 0.05 V. The series resistance is also determined by this method when Vgs is varied. For the wafers we used in this study, the 1L is between 160 and 190 nm. 2. Methods of characterizing CL In general, the CMOS load capacitance can be expressed as: A + Cint (1) CL = C1 + Toxe c 1998 IOP Publishing Ltd 0268-1242/98/070773+03$19.50
where Cint is interconnect capacitance; A/Toxe represents gate oxide related capacitance such as gate-to-channeloxide and gate-to-source/drain overlap capacitance. Toxe is the oxide thickness determined by the CV technique. C1 represents the remainder of the capacitance, presumably the junction capacitance. It has been shown that tpd can be modelled with the following equation [1]: tpd =
CL Vdd n
�
1 Idsatn
+
1
� (2)
Idsatp
where n ∼ 3.7 is a constant. The first way to characterize CL experimentally is to measure a ring oscillator’s tpd , Idsatn and Idsatp at different bias voltages, Vdd . When the measurement data ntpd /[Vdd (1/Idsatn + 1/Idsatp )] are plotted against Vdd , the slope of such a plot yields CL , according to equation (2). The second experimental method to characterize CL is to measure the current Idd and oscillating frequency f of an ring oscillator at different Vdd . It is well known that [4]: � Idd = kf CL Vdd = kf
A C1 + Toxe
� Vdd
(3)
where k is slightly larger than 1 to account for the shortcircuit (spike) current [4] but will be taken as 1 in this study. Here the interconnect capacitance, Cint , is ignored because we studied only the unloaded ring oscillator case where the interconnect is minimal. CL can be obtained from the slope of the plot Idd /f against Vdd , as will be shown in the next section. 773
Kai Chen et al
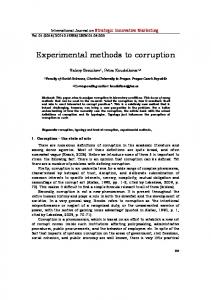
Figure 2. The SPICE simulation with the BSIM3v3 model shows that the a value is 1.3, which is close to what was found in the experiment: a = 1.37 in figure 1(a) and (b).
(a)
(b) Figure 1. (a) The slope of each curve yields CL corresponding to each Toxe . (b) The slope of this CL –1/Toxe plot yields a = 1.37.
(a)
3. Experiment Equation (1) can also be re-written as follows: CL = C1 + a
Weff Leff εox + Cint Toxe
(4)
where W and L are the drawn channel width and length of MOSFET, respectively, and εox is the dielectric constant of the gate oxide; factor a is a constant to be determined. Its value should be larger than unity due to the Miller effect. One goal of this study is to find the value of a. Each slope in figure 1(a) is the CL for a Toxe . CL can be plotted against 1/Toxe as shown in figure 1(b). The slope and Y -intercept of figure 1(b) yield a and C1 + Cint , respectively, according to equation (5). This particular set of measurement data shows that C1 + Cint = 18.3 fF and a = 1.37. Figure 2 shows a simulation result from SPICE with model BSIM3v3 (or level 47 of HSPICE). By varying Toxe , 774
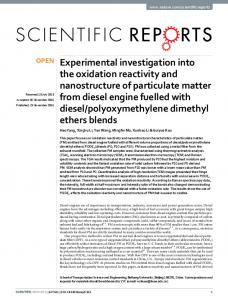
(b) Figure 3. (a) CL characterization from measured dynamic current, Idd , and operating frequency, f , according to equation (4). (b) The slope of this CL –1/Toxe plot yields a = 1.37 (for the drawn widths and lengths).
Load capacitance of CMOS gate
Substituting equation (4) with a = 1.37 and C1 +Cint = 18.3 (fF) for this particular case into equation (2), tpd can be modelled and predicted for various Toxe , Leff , Vth , Rs and Vdd . The model prediction and measurement data of tpd are compared in figure 4. It shows that accurate prediction on CMOS speed can be made at power voltages from 1.5 up to 3.3 V for gate oxide thicknesses from 2.9 to 6.5 nm. It should be noted that to fit the data shown in figure 4 for different Vdd , it is necessary to adjust CL . This is because junction depletion capacitance in C1 depends on Vdd . But the variation was small, less than 10% of the total CL . 4. Conclusions
Figure 4. tpd model based on the new CL expression discussed in the paper fits the measurement data well for gate oxide thicknesses from 2.5 to 5.6 nm at voltages of 1.5, 2, 2.5 and 3.3 V.
Two independent methods of experimentally characterizing load capacitance CL have been presented. a = 1.37 is determined for this particular case. An accurate CMOS gate delay model including the CL equation found in this study is compared with measurement data. Excellent agreement between the tpd model and measurement data has been demonstrated. With this CL model, tpd can be predicted with gate oxide, channel length and voltage scaling. Acknowledgments
CL is extracted from tpd based on equation (2). When CL is plotted against 1/Toxe , the slope gives the value of parameter a, as indicated by equation (4). Figure 2 shows that the a resulting from the SPICE simulation is 1.3, not too far away from 1.37 which was obtained from the experimental characterization. The second method extracting CL is to measure Idd and oscillation frequency, f , and then plot Idd /f against Vdd as shown in figure 3(a). The slope of each curve in figure 3(a) yields CL corresponding to different Toxe . If CL is plotted against 1/Toxe , a linear curve with the Yintercept as C1 and the slope as a can be determined, as shown in figure 3(b). It is found that this method also yields C1 + Cint = 18.3 (fF) and a = 1.37. This second method achieves the same values of C1 and a as obtained from the first method illustrated in figure 1. Two independent methods discussed so far yield the same CL , C1 and a. This experiment proves the correctness of both methods.
This work is supported by the Joint Services Electronics Program, F49620-94-C-0038, and AFOSR F49620-94-10464, SRC contract 96-SJ-417. References [1] Chen Kai, Hu Chenming, Fang Peng and Gupta A 1997 Experimental confirmation of an analytical CMOS gate delay mode for gate oxide and voltage scaling IEEE Trans. Electron Devices ED-18 275–7 [2] Chow H-C and Feng W-S 1992 An analytical CMOS inverter delay model including channel-length modulations IEEE J. Solid-State Circuits 9 1303–6 [3] Vasileska D, Schroder D K and Ferry D K 1997 Scaled silicon MOSFET’s: degradation of the total gate capacitance IEEE Trans. Electron Devices ED-44 [4] Hu Chenming 1995 Device and technology impact on low power electronics Low Power Design Methodologies ed J M Rabaey and M Pedram (Dordrecht: Kluwer) ch 2
775