and IDES systems in both latency data of King and Planetlab. Comparing with NPS, BBS ... content distribution network (CDN) can benefit from network distance ...
Two-layer network coordinate system for Internet distance prediction Chengbo Dong1 , Guodong Wang1, Xuan Zhang2, Beixing Deng1, Jia Liu1 and Xing Li1 Tsinghua National Laboratory for Information Science and Technology 1 Department of Electronic Engineering, Tsinghua University, Beijing 100084, P.R. China 2 Network Research Center, Tsinghua University, Beijing 100084, P.R. China E-mail: {dcb06,wgd08}@mails.tsinghua.edu.cn
Abstract—Network coordinate (NC) system is an efficient and scalable system for Internet distance prediction. In this paper, we propose 3 two-layer NC systems HNPS, HBBS and HIDES derived from NPS, BBS and IDES, respectively. We use hierarchical idea in both Euclidean coordinate systems (NPS and BBS) and matrix factorization model (IDES). And to the best of our knowledge, we first introduce the thought of hierarchy into matrix factorization model. By comparative simulation, we evaluate the performance of HNPS, HBBS, HIDES, NPS, BBS and IDES systems in both latency data of King and Planetlab. Comparing with NPS, BBS and IDES, we find that HNPS, HBBS and HIDES have better distance prediction, respectively. By indepth analysis, we reveal that the essential reason why two-layer NC models outperform the ones of one-layer is that two-layer NC systems reduce prediction errors of short link distance. In addition, we compare the performance of HNPS, HBBS and HIDES with NPS, BBS and IDES, respectively in overlay multicast application. The experimental results show that twolayer NC systems achieve higher accuracy in Internet distance prediction with lower cost of overlay multicast tree construction. Therefore, the thought of hierarchy is not only suitable for Euclidean distance based NC systems, but also suitable for matrix factorization based NC systems, which fully substantiates that two-layer NC system is a general model for accurate estimation of network distance. Index Terms—network coordinate, two-layer, hierarchy, overlay multicast
I. INTRODUCTION Network coordinate is an efficient mechanism to predict the network latency, which is named as network distance in this paper, between any two hosts in the Internet without much measurement. In a NC system, Internet is embedded into a geometric space in which a point is associated with a host in the Internet, and the geometric distance between two points represents the network distance between two hosts in the Internet. Each host in the Internet is given a synthetic coordinate while the network distance between two hosts can be calculated with a distance function and the coordinates of two hosts. NC system is scalable since it reduces much active measurement overhead. Thus large scale p2p system and the content distribution network (CDN) can benefit from network distance prediction of NC system. c Copyright 9781-4244-3941-6/09/ $25.00⃝2009 IEEE
Several NC systems have been proposed in the literature. We categorize these systems into two types by the NC computing algorithm. We call some of them, such as GNP [1], NPS [2], landmark based system in which the NC of a host is computed referring to several landmarks in the network while the rest, such as Vivaldi [3] and BBS [4], are called simulation based system in which the host NC is computed with a fully distributed algorithm. However, there are two limitations in such NC systems whose NCs are based on Euclidean space. First, the distances between any two hosts are inherently symmetric. Second, they also satisfy the triangle inequality. But the real network distance between two hosts do not obey these rules. In [5], a matrix factorization model called Internet Distance Estimation Service (IDES) has been proposed, which is unrestrictive to the drawbacks that Euclidean distance based NC systems suffer from. Recent work have revealed that all the systems mentioned above are short of accuracy which is usually measured with relative error (RE) of network distance prediction. And furthermore, some work shows that the REs of short distance links are much higher than the REs of long distance links in centralized NC system GNP [6] and decentralized NC system Vivaldi [7]. And a hierarchical network coordinates system is proposed for reduce the RE of the short distance link. In this paper, we observe that the REs of short distance links are also much higher in other NC systems including NPS ,BBS, IDES. Based on the observation, we propose our two-layer NC systems in order to reduce the predicted REs of short links. Like in [6] and [7], in our system, all the hosts in the network are clustered into different clusters and make sure that the network distances among hosts in the same cluster are short. And each host has two NCs which are called global NC and local NC respectively. After getting two NCs, we can predict distance between any two hosts. If two hosts are in the same group, we use their local NC to predict distance, otherwise, global NC is used to predicted distance. Our simulations show that two-layer NC systems reduce the REs of the short links and improve the distance prediction accuracy. And we also find overlay multicast can improve the performance by using two-layer NC system to build the multicast tree.
2
3
2
10
2
10
10
NPS Planetlab dataset NPS in King dataset
BBS in Planetlab dataset BBS in King dataset
IDES in Planetlab dataset IDES in King dataset
2
10
1
1
10
0
10
10
Relative Error
1
Relative Error
Relative Error
10
0
10
−1
−1
10
−1
0
10
10
10
−2
10
−2
0
10
1
2
10
10
3
10
10
−2
0
10
1
2
10
Link Distance
10
3
10
10
(a) NPS
1
2
10
10
3
10
Link Distance
(b) BBS Fig. 1.
0
10
Link Distance
(c) IDES
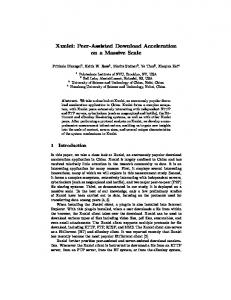
Cumulative Distribution Function of RE in Planetlab dataset
The rest of this paper is organized as follows. In section II, we study the relation between distance prediction RE and the range of distance. Then in section III, we demonstrate the system design of our two-layer NC system. In section IV, we use several experiments to evaluate our system. In the end, we conclude the whole paper in section V. II. RELATION BETWEEN RE AND RANGE OF DISTANCE In this section, firstly we introduce three different NC systems, NPS, BBS and IDES. Then we analyze the relation between prediction accuracy and range of distance in these three systems. A. NPS NPS is a landmark based NC system derived from GNP, the first landmark based NC system. NPS system architecture is hierarchical and the host whose NC is stable and accuracy enough can become a new landmark. In NPS NC system, at first, several hosts are picked up manually as landmarks. Then, landmarks ping each other and measure the network distance, and compute the NCs of other hosts. The host whose NC has been computed can become a new landmaark in this NC system. NPS system aims to make sure that the sum of all the distance prediction errors are minimal. Thus in NPS, host refers to different landmarks to compute its NC. The design of NPS makes sure that each landmark in the system won’t overload, so NPS is quite stable. B. BBS BBS is a decentralized NC system. BBS models nodes of the network as a set of particles in a geometric space. The particles are traveling in that space under the effect of potential force field. The force field reduces the potential energy of the particles related to the total embedding error of all particle pairs. All the nodes in BBS system will finally converge to stable positions in that space, which means the potential energy of all the particles are minimal. And the stable coordinates are the NCs of nodes.
C. IDES IDES is the first NC system based on matrix factorization. This system has an advantage: the NCs in it avoid suffering from the triangle inequality and delay symmetry which are quite problems in Euclidean space based NC systems. And it is efficiency in large-scale network distance prediction with scalability and robustness. In [5], singular value decomposition (SVD) and non-negative matrix factorization (NMF), two matrix factorization algorithms have been proposed. And the researchers claim that the performance of NMF is better, so in our simulation, we choose NMF algorithm. D. the relation between RE and range of distance The accuracy of the NC system is often evaluated with the metric named RE, which is defined as follow. In the NC system, we can calculate RE value for each link. Denote the real measured round trip time (RTT) between two host as 𝑀 𝑒𝑎𝑠𝑢𝑟𝑒𝑑𝐷𝑖𝑠𝑡𝑎𝑛𝑐𝑒, and denote the distance predicted by the NCs of two hosts as 𝑃 𝑟𝑒𝑑𝑖𝑐𝑡𝑒𝑑𝐷𝑖𝑠𝑡𝑎𝑛𝑐𝑒, then the RE of the link between these two hosts is defined as 𝑅𝐸 =
∣𝑀 𝑒𝑎𝑠𝑢𝑟𝑒𝑑𝐷𝑖𝑠𝑡𝑎𝑛𝑐𝑒 − 𝑃 𝑟𝑒𝑑𝑖𝑐𝑡𝑒𝑑𝐷𝑖𝑠𝑡𝑎𝑛𝑐𝑒∣ 𝑚𝑖𝑛(𝑀 𝑒𝑎𝑠𝑢𝑟𝑒𝑑𝐷𝑖𝑠𝑡𝑎𝑛𝑐𝑒, 𝑃 𝑟𝑒𝑑𝑖𝑐𝑡𝑒𝑑𝐷𝑖𝑠𝑡𝑎𝑛𝑐𝑒)
In [6] and [7], researchers found that the range of distance between hosts do effect the distance prediction accuracy in NC systems GNP and Vivaldi. They revealed that the shorter distance between two hosts causes higher relative prediction error. In our simulation, we get the similar results in NPS, BBS and IDES systems. We use two data sets from real Internet measurement to run our simulation. The first data set is planetlab data set which contains round trip latency among 169 nodes on planetlab test bed. The second data set is a subset of King data set which contains round trip latency among 462 hosts. We run three NC algorithms, NPS, BBS and IDES on these two data sets and get the RE of each link for each algorithm. Each of the following results is the average of ten independent simulations. Figure 1 depicts the relative error distributions of three different algorithms over the distance spectrum in two data sets. It is obvious that the link whose latency is smaller
3
join the cluster 𝐶𝑛𝑒𝑎𝑟𝑒𝑠𝑡 where anchor 𝐴𝑛𝑒𝑎𝑟𝑒𝑠𝑡 locates. This procedure makes sure that all the nodes in a cluster have short distances to the same anchor, so the distances among them may not be very far. C. distance prediction strategy in two-layer NC system We also use hierarchical distance prediction strategy to predict distance between any two hosts in the system. Suppose we need to predict distance between node 𝑖 and node 𝑗, their clusters are 𝐶𝑖 and 𝐶𝑗 , if two nodes are in the same cluster, local NCs, denoted as 𝑋𝑙𝑜𝑐𝑎𝑙,𝑖 and 𝑋𝑙𝑜𝑐𝑎𝑙,𝑗 , are used to calculate distance, otherwise global NCs, denoted as 𝑋𝑔𝑙𝑜𝑏𝑎𝑙,𝑖 and 𝑋𝑔𝑙𝑜𝑏𝑎𝑙,𝑗 , are used to calculate distance. So in two-layer NC system, the distance between node 𝑖 and node 𝑗 is defined as follow. 𝑑(𝑖, 𝑗) =
Fig. 2.
two-layer NC system architecture
suffers from higher RE than the longer link. Our simulations demonstrate that in NPS, BBS and IDES systems, RE is related to link distance and the distance is shorter, the RE is higher. III. SYSTEM DESIGN A. Two-layer NC system overview In [7], pharos which is a hierarchical NC system is proposed to improve the prediction accuracy of short links. We propose a general two-layer NC system which can reduce the RE of short links. In this section, we describe the detail system design of the two-layer NC system. Figure 2 shows the system architecture of two-layer NC system. Like pharos, hosts in the network are divided into different clusters. The latency between hosts in the same cluster is smaller than the latency between hosts in different clusters. Each host joins two overlay networks, base overlay network and local overlay network simultaneously. And each host has two NCs, one is global NC and the other is local NC. All the hosts in the network constitute a base overlay network and nodes update their global NCs according to the RTT information in this overlay. At the same time, each cluster is a local overlay network and hosts in this overlay maintain their local NCs. Thus if we have N clusters, we will get N+1 independent NC overlays network including N local overlay networks and one global overlay network. B. Cluster locating procedure in two-layer NC system As in pharos, several anchors which are stable nodes such as DNS servers (say 𝑁 anchors denoted as 𝐴1 , 𝐴2 ... 𝐴𝑁 ) are chosen to cluster hosts. An anchor is associated with a cluster. And N clusters are denoted as 𝐶1 , 𝐶2 ... 𝐶𝑁 . A node finds its cluster by the procedure as follow. Firstly, the node pings all the anchors. Then find out the nearest anchor 𝐴𝑛𝑒𝑎𝑟𝑒𝑠𝑡 and
{
∣∣𝑋𝑙𝑜𝑐𝑎𝑙,𝑖 − 𝑋𝑙𝑜𝑐𝑎𝑙,𝑗 ∣∣ if 𝐶𝑖 = 𝐶𝑗 ∣∣𝑋𝑔𝑙𝑜𝑏𝑎𝑙,𝑖 − 𝑋𝑔𝑙𝑜𝑏𝑎𝑙,𝑗 ∣∣ if 𝐶𝑖 ∕= 𝐶𝑗
The feature of two-layer NC system is that we can use any type of NC algorithms (including GNP, NPS, Vivaldi, BBS and IDES) in the overlay networks to compute the local NC and global NC. So two-layer NC system is a general model for reducing short link REs. The following experiments show that no matter which algorithm (Euclidean or non-Euclidean space based) we use, two-layer NC system can successfully reduce short link REs. IV. PERFORMANCE EVALUATION In this section, we demonstrate several simulation results about the performance of two layer NC systems which use NPS, BBS and IDES algorithms, respectively. And we also use different NC systems to guide the overlay multicast tree building procedure and compare the tree cost of different NC systems. To make the experimental results more convincible, we conduct ten-time simulations for each system, and then get the average results as the final experimental results. All the results show that our two-layer NC systems can reduce the REs of short links and improve the accuracy of distance prediction. Also using two-layer NC system to direct overlay multicast tree building can significantly improve the performance of multicast system. A. Experiment setup In our experiments, we apply NPS, BBS and IDES algorithms in two-layer NC system respectively. Then we get 3 different hierarchical NC systems whose names are HNPS, HBBS and HIDES. We use the datasets which are described in section II. We compare HNPS with NPS in the two datasets. We also compare HBBS, HIDES with BBS, IDES. The coordinates in the NC systems are 8 dimension Euclidean coordinates except IDES and HIDES. In IDES and HIDES, the outgoing and incoming vectors are 8 dimension vectors. In HBBS and BBS, each node has 30 neighbors while there are 10 landmarks in HNPS, NPS and 20 landmarks in HIDES, IDES.
1
1
0.9
0.9
0.8
0.8
0.8
0.7 0.6 0.5 0.4 0.3 0.2
0
0
0.2
0.4 0.6 Relative Error
0.8
0.7 0.6 0.5 0.4 0.3 BBS in Planetlab dataset HBBS in Planetlab dataset
0.2
NPS in Planetlab dataset HNPS in Planetlab dataset
0.1
Cumulative Distribution Fuction
1 0.9
Cumulative Distribution Fuction
Cumulative Distribution Fuction
4
0
0.5 0.4 0.3
0
0.2
0.4 0.6 Relative Error
0.8
0
1
0.8
0.8
0.8
0.7 0.6 0.5 0.4 0.3
0.4 0.6 Relative Error
0.8
0.7 0.6 0.5 0.4 0.3 0.2
NPS in King dataset HNPS in King dataset
0.2
Cumulative Distribution Fuction
1 0.9
Cumulative Distribution Fuction
1 0.9
0
0.4 0.6 Relative Error
0.8
1
Cumulative Distribution Function of RE in Planetlab dataset
1
0
0.2
(c) HIDES&IDES
0.9
0.1
0
(b) HBBS&BBS Fig. 3.
0.2
IDES in Planetlab dataset HIDES in Planetlab dataset
0.1
(a) HNPS&NPS
Cumulative Distribution Fuction
0.6
0.2
0.1
1
0.7
(a) HNPS&NPS
0
0.6 0.5 0.4 0.3 0.2
BBS in King dataset HBBS in King dataset
0.1 1
0.7
0
0.2
0.4 0.6 Relative Error
0.8
1
0
(b) HBBS&BBS Fig. 4.
IDES in King dataset HIDES in King dataset
0.1 0
0.2
0.4 0.6 Relative Error
0.8
1
(c) HIDES&IDES
Cumulative Distribution Function of RE in King dataset
The nodes in planetlab dataset are divided into 4 clusters and King dataset has 7 clusters. Before the simulation, we randomly pick up the anchors and make sure that the distance between any two anchors is larger than 60 ms. Because if two anchors are quite close, they are equivalent to one anchor for clustering hosts.
TABLE I P ERCENTAGE OF NPRE REDUCED BY TWO - LAYER SYSTEMS
Dataset Planetlab King
HNPS&NPS 36.83% 18.84%
HBBS&BBS 19.72% 15.42%
HIDES &IDES 28.16% 16.46%
B. Evaluation of HNPS, HBBS and HIDES Relative Error: Figure 3 and Figure 4 are cumulative distribution of relative error of two-layer system structures and the original ones in both data sets of Planetlab and King. In this simulation, all the figures show that the performances of hierarchical NC systems (HNPS, HBBS and HIDES) are much better. Therefore it fully substantiates that two-layer NC system architecture is a general model of accurate NC system regardless of the type of NC algorithms. Usually ninety-percentile relative error (NPRE) is an important metric to evaluate the accuracy. Table I gives the percentage of NPRE reduced by two-layer NC systems from the original ones in two datasets. It is obvious that in each two-layer NC system architecture, the NPRE is reduced at least 15% from the original one, which fully proves that twolayer NC system is more accuracy. Short link distance RE: Figure 5 shows the relation between link distance and RE in two-layer NC systems and one-
layer systems. By comparison between two-layer NC systems and the original ones, it is evident that all the two-layer system architectures reduce RE of short link distance from the original ones. Thus, two-layer system architectures improve the accuracy of short link distance prediction significantly. Another significant Metric: Nearest Neighbor Loss [8] (NNL) is defined as the difference between the delay to the node predicted to be the nearest neighbor and the delay to the true one. This metric reflects the accuracy for one host node in a network coordinate system to find the closest neighbor host. Figure 6 and Figure 7 show each cumulative distribution of NNL in HNPS, NPS, HBBS, BBS, HIDES and IDES NC systems. By comparison, it is obvious that HNPS, HBBS and HIDES have much better performance than NPS, BBS and IDES. Therefore, it is clearly obvious that two-layer systems are more accuracy in finding their closest neighbor hosts.
5
3
2
10
2
10
10
NPS in Planetlab dataset NPS in Planetlab dataset NPS in King dataset NPS in King dataset
2
10
BBS in Planetlab dataset HBBS in Planetlab dataset BBS in King dataset HBBS in King dataset 1
1
0
10
10
Relative Error
1
Relative Error
Relative Error
10
10
0
10
−1
0
10
−1
10
−1
IDES in Planetlab dataset HIDES in Planetlab dataset IDES in King dataset HIDES in King dataset
10
10
−2
−2
10
0
1
10
2
10
3
10
−2
10
10
0
1
10
3
10
10
10
0
0.8
0.8
0.8
0.4 0.3 NPS in Planetlab dataset HNPS in Planetlab dataset
0.1 0
0
10
20 30 Nearest Neighbor Loss
40
50
Cumulative Distribution Fuction
1 0.9
Cumulative Distribution Fuction
1 0.9
0.5
0.7 0.6 0.5 0.4 0.3 0.2
BBS in Planetlab dataset HBBS in Planetlab dataset
0.1 0
(a) HNPS&NPS
0
10
20 30 Nearest Neighbor Loss
40
50
0.7 0.6 0.5 0.4 0.3 0.2
IDES in Planetlab dataset HIDES in Planetlab dataset
0.1 0
0
(b) HBBS&BBS Fig. 6.
10
Relation between link distance and RE
1
0.6
3
10
(c) HIDES&IDES
0.9
0.7
2
10
Link Distance
(b) HBBS&BBS Fig. 5.
0.2
1
10
Link Distance
(a) HNPS&NPS
Cumulative Distribution Fuction
2
10
Link Distance
10
20 30 Nearest Neighbor Loss
40
50
(c) HIDES&IDES
Cumulative Distribution Function of NNL in Planetlab dataset
C. Performance evaluation in overlay multicast NC system is an effective and scalable tool for overlay multicast application. In this section we evaluate the performance in three overlay multicast algorithms, MST, ESM [9] [10] and LGK [11] using two-layer network coordinate systems. MST is short for minimum spanning tree which uses Prim’s algorithm. It reflects the accuracy for one host node to select its closest neighbor, and for that reason we selected it for our evaluation. ESM (end system multicast) is a system in which a new entering host node first gets a fixed size of host list, and then it selects the closest node as its parent node from the list. Each node joins the system in order with the above-mentioned method to construct the multicast tree. A location-guided k-ary (LGK) tree is constructed in following steps. First, the root host node selects the closest k nodes as its children nodes in the tree. Second, with these k children nodes, divide the rest nodes that haven’t joined the tree into k groups in following rule: each remaining node belongs to the closest group of the k children. After that each of the k children nodes become the root node of the sub-tree containing its close nodes. Last, repeat the above two steps to construct the LGK tree. [12] has already proved that when k = 2, there is a tradeoff between transportation delay of data
and cost of overlay multicast tree construction. Therefore, in our experiment, k is set 2. According to [12], we adopt the following metrics for aforementioned three algorithms: For MST and ESM, we choose tree cost as our evaluation metric. Tree cost is defined as the sum of all the latencies over the overlay multicast tree. Tree cost reflects the cost of network in different overlay multicast structures when transmitting the same data. For LGK, we choose delay stretch as our metric, since LGK tree focuses on minimizing transmission delay instead of the cost of tree construction. To one normal host node, not the root node, delay stretch is defined as the ratio of the transmission latency between the node and the root node through the overlay multicast tree and the delay between them through unicast. Delay stretch reflects the efficiency in transmission delay through overlay multicast tree. Table II and Table III show the evaluation metric of abovementioned three overlay multicast tree construction in following 6 NC system architectures: HNPS, NPS, HBBS, BBS, HIDES and IDES. From these tables, it is clearly obvious that both of the two-layer systems reduce the tree construction cost and delay stretch to a large extent from their original onelayer systems. Two-layer system architectures outperform the original one-layer ones in overlay multicast application.
1
1
0.9
0.9
0.8
0.8
0.8
0.7 0.6 0.5 0.4 0.3 0.2
NPS in King dataset HNPS in King dataset
0.1 0
0
10
20 30 Nearest Neighbor Loss
40
50
Cumulative Distribution Fuction
1 0.9
Cumulative Distribution Fuction
Cumulative Distribution Fuction
6
0.7 0.6 0.5 0.4 0.3 0.2
BBS in King dataset HBBS in King dataset
0.1 0
0
10
20 30 Nearest Neighbor Loss
BBS 2904 3413 1.571
HBBS 2402 2858 1.506
IDES 5683 6141 3.009
HIDES 3829 4157 2.120
TABLE III M ETRIC OF OVERLAY MULTICAST TREE IN K ING DATASET Application MST ESM LGK
NPS 16468 16851 3.227
HNPS 10941 11412 2.772
0.4 0.3 0.2
BBS 11556 12319 2.798
HBBS 9304 9963 2.525
IDES in King dataset HIDES in King dataset
40
50
0
0
10
20 30 Nearest Neighbor Loss
40
50
(c) HIDES&IDES
Cumulative Distribution Function of NNL in King dataset
TABLE II M ETRIC OF OVERLAY MULTICAST TREE IN P LANETLAB DATASET HNPS 3527 3966 1.995
0.5
(b) HBBS&BBS Fig. 7.
NPS 4972 5341 2.210
0.6
0.1
(a) HNPS&NPS
Application MST ESM LGK
0.7
IDES 15650 15853 3.195
HIDES 12918 13176 2.503
V. C ONCLUSIONS In this paper, we have studied the main cause of the network prediction errors in NPS, BBS and IDES systems. As a matter of fact, their relative errors of distance prediction in short distance are quite high. Then we have proposed 3 two-layer NC systems: HNPS, HBBS and HIDES, containing both Euclidean space based and non-Euclidean space based NC systems, to solve this problem. And we first apply hierarchy thought to non-Euclidean based NC system (IDES). By comparative simulations, we find that two-layer systems reduce the REs in short link distance in both Euclidean space NC systems and matrix factorization model. In addition, two-layer NC systems also outperform one-layer ones in another significant metric (NNL). Experiments show two-layer NC system based on nonEuclidean space has better distance estimation than the original one as well. Moreover, in overlay multicast application, two-layer network coordinate systems outperform one-layer systems as well. For MST and ESM, the construction costs of overlay multicast overlay trees in two-layer NC systems are much lower; and for LGK, two-layer systems have much lower delay stretch as well. Therefore, two-layer NC systems achieve more accurate prediction of network latency regardless of the algorithms used in both Euclidean space and non-Euclidean Space. We conclude that two-layer NC systems are general accurate
NC models that would undoubtedly have better performance in real network applications. ACKNOWLEDGMENTS This work is supported by the National Basic Research Program of China (No.2007CB310806) and the National Science Foundation of China (No.60473087, No.60703052, No.60850003). And we would like to thank Ben Y. Zhao, Assistant Professor in University of California, Santa Barbara for reviewing our paper and giving us valuable suggestions. R EFERENCES [1] T. S. E. Ng and H. Zhang. Predicting Internet Network Distance with Coordinates-based Approaches. In Proc. of IEEE INFOCOM, 2002. [2] T. S. E. Ng and H. Zhang. A Network Positioning System for the Internet. In Proc. of USENIX Annual Technical Conf., 2004. [3] F. Dabek, R. Cox, and F. Kaashoek. Vivaldi: A Decentralized Network Coordinate System. In Proc. of ACM SIGCOMM, 2004. [4] Yuval Shavitt and Tomer Tankel. Big-Bang Simulation for embedding network distances in Euclidean space. IEEE/ACM Transactions on Networking, 12(6):993–1006, December 2004. [5] Yun Mao and Lawrence K. Saul. Modeling Distances in Large-Scale Networks by Matrix Factorization. In Proceedings of ACM SIGCOMM/USENIX Internet Measurement Conference (IMC’04), pp 278287, Taormina, Sicily, Italy, Oct 2004. [6] R. Zhang, Y. C. Hu, and X. Lin. A Hierarchical Approach to Internet Distance Prediction. In Proc. of IEEE ICDCS, 2006. [7] Y. Chen, Y. Xiong, X. Shi, J. Zhu, B. Deng, and X. Li. Pharos: accurate and decentralised network coordinate system IET Communications – April 2009 – Volume 3, Issue 4, p. 539-548. [8] Pietzuch P, Ledlie J, Mitzenmacher M, et al. Network-Aware Overlays with Network Coordinates.Proceedings of the 26th IEEE International Conference Workshops on DistributedComputing Systems ICDCSW ’06),Washington, DC, USA: IEEE Computer Society, 2006.12. [9] Chu Y H, Rao S G, Zhang H. A case for end system multicast (keynote address). Proceedings of the 2000 ACM SIGMETRICS international conference on Measurement and modeling of computer systems (SIGMETRICS ’00), New York, NY, USA: ACM, 2000. 1-12. [10] Chu Y H, Ganjam A, Ng T S E, et al. Early experience with an internet broadcast system based on overlay multicast. Proceedings of the annual conference on USENIX Annual Technical Conference (ATEC ’04), Berkeley, CA, USA: USENIX Association, 2004. [11] Chen K, Nahrstedt K. Effective location-guided tree construction algorithms for small group multicast in MANET. Proceedings of Twenty-First Annual Joint Conference of the IEEE Computer and Communications Societies (INFOCOM’02), volume 3, 2002. 1180-1189 vol.3. [12] Zhang R, Tang C, Hu Y, et al. Impact of the Inaccuracy of Distance Prediction Algorithms on Internet Applications - an Analytical and Comparative Study. Proceedings of 25th IEEE International Conference on Computer Communications (INFOCOM’06), 2006. 1-12.