Ultrafast low-energy electron diffraction traces phase-ordering kinetics of charge density waves S. Vogelgesang1, G. Storeck1, S. Schramm1, K. Rossnagel3, S. Schäfer1, C. Ropers1,2,* 2
1 IV. Physical Institute - Solids and Nanostructures, University of Göttingen, Germany International Center for Advanced Studies of Energy Conversion (ICASEC), University of Göttingen, Germany *Email:
[email protected] 3 Institute for Experimental and Applied Physics, University of Kiel, Germany
Abstract: We introduce ultrafast low-energy electron diffraction (ULEED) in backscattering for the study of structural dynamics at surfaces. Using a tip-based source of ultrashort electron pulses, we investigate the optically-driven transition between charge-density wave phases at the surface of 1T-TaS2. Employing spot-profile analysis enabled by the large transfer width of the instrument, we resolve the phase-ordering kinetics in the nascent incommensurate charge-density wave phase. We attribute the observed power-law scaling of the correlation length to the annihilation of topological defects resembling edge-dislocations of the charge-ordered lattice. Our work opens up the study of a wide class of structural transitions at surfaces and in low-dimensional systems.
The reduced dimensionality and broken symmetry of a surface endows it with unique physical and chemical properties that drastically differ from the bulk1,2. Prominent surface-specific features involve the electronic, atomic and spin structure, as manifest in modified band structures3,4, surface reconstructions1 or topological states2,5. Many of these phenomena exhibit highly-complex couplings and correlations, which are difficult to disentangle using steady-state analyses of systems in equilibrium. As a result, ultrafast spectroscopy has become an indispensable means to identify the hierarchy and strengths of interactions in the time-domain, by probing the response of materials and surfaces excited strongly out of equilibrium6. Specifically, time-resolved realizations of optical and photoemission spectroscopy yield comprehensive insights into the transient state of the electron and spin systems3,5,7–11. In contrast, access to the structural degrees of freedom with ultimate surface sensitivity and high temporal resolution remains limited, despite notable achievements in time-resolved reflection highenergy electron diffraction (RHEED)12–16. In order to reach a detailed and quantitative understanding of ultrafast structural dynamics at surfaces, a time-resolved implementation of low-energy electron diffraction (LEED) is highly desirable. Although LEED is the most widely used and broadly applicable diffractive technique for surface characterization, an ultrafast realization has proven very challenging17–21. Recently, using the monolayer sensitivity of low-energy electrons, we introduced ultrafast LEED in transmission, studying the dynamics of a polymer superstructure on freestanding graphene20. However, a backscattering geometry promises a greatly expanded range of accessible systems and phenomena, including the dynamics of surface reconstructions, molecular adsorbates, or structural phase transitions. In this work, we present the development of ultrafast low-energy electron diffraction (ULEED) and demonstrate its applicability for the study of structural phase transitions at surfaces. In particular, we investigate the optically-driven transition between two prominent charge-density wave (CDW) phases at the surface of single crystalline 1T-TaS2. We track the formation and nonequilibrium temporal evolution of the incommensurate CDW phase, and identify a coarsening of the CDW texture by analyzing diffraction intensities and spot profiles. Enabled by a compact electron source based on a nanotip photoemitter, ULEED represents a powerful and complementary addition to the toolbox of ultrafast surface science.
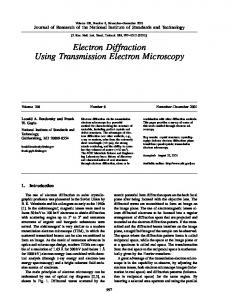
Fig. 1: ULEED setup and high-resolution diffraction pattern from 1T-TaS2. a, Schematic of the experimental setup for ultrafast low-energy electron diffraction (ULEED). Inset: Electron micrograph of the nanometric photocathode made from an electrochemically etched tungsten tip. b, Miniaturized laser-driven electron source. Inset: Tungsten tip, visible through the hole for laser illumination. c, Electron pulse duration at a kinetic energy of 100 eV, measured using a transient electric field-effect. d, LEED pattern of the NC CDW room temperature phase, recorded with pulsed 100-eV electrons from the miniaturized laser-driven source (logarithmic color scale). A retarding voltage of -20 V is applied at the detector front plate. e, Line profile of the (00) diffraction peak, illustrating high transversal coherence of the source. The fitted spot width of 0.03 Å-1 (FWHM) corresponds to a transfer width of 21 nm. f, Close-up of region marked in (a) showing second-order CDW diffraction spots. g, Line profile of CDW diffraction spots shown in (f), fitted with Lorentzian peak profiles.
ULEED is part of a larger family of optical-pump/electron-probe schemes, in which an ultrashort electron pulse samples the momentary state of an optically-excited system by diffraction. In these approaches, the temporal resolution is limited by the electron pulse duration at the specimen position, which is broadened by Coulomb interactions within the electron pulse, velocity dispersion and path length differences upon propagation from the photoelectron source to the sample. In high-energy ultrafast electron diffraction (UED)22–28 and ultrafast transmission electron microscopy (UTEM)29–33, femtosecond temporal resolution is achieved by radio-frequency pulse compression34–36 or reduced propagation distances with tailored gun designs22,32,37. Due to longer electron flight durations, time-resolved experiments with low-energy electron pulses face the challenge of a greatly increased impact of any effect leading to pulse broadening. Moreover, in order to minimize the sample-source distance in the backscattering geometry of LEED, the outer diameter of a pulsed electron gun needs to be reduced accordingly for obtaining diffraction images of sufficient solid angle (cf. Fig. 1a). Addressing these issues, we developed a particularly compact and easily manufactured ultrafast low-energy electron source. It is composed of a sharp tungsten tip (apex radius 734 ps), with CDW diffraction peaks in-line with the reciprocal vectors of the atomic lattice. Due to the weak and harmonic PLD, higher-order CDW diffraction peaks are practically absent in the IC phase51. In Fig. 2c, a difference image illustrates the suppression of the NC phase (blue) and the appearance of the rotated IC spots (red), together with an increase of the diffuse background (see also lineout in Fig. 2d). For all time delays, from the raw data, we evaluate the integrated as well as the maximum intensities of both the lattice and CDW diffraction peaks, including background subtraction in a sufficiently large area of interest. The obtained integrated and maximum intensities of the Bragg, NC- and IC-CDW diffraction peaks as a function of ∆ are plotted in Fig. 2f, for ten incident optical pump fluences. Figure 2e shows normalized diffraction peak intensities at large delays (Δ =1134 ps). For fluences below 2.83 mJ/cm², the NC-CDW phase is transiently suppressed by up to about 25% (see blue time curves in Fig. 2f, middle) due to the pump-induced heating of the surface (Debye-Waller effect), recovering on a timescale of several nanoseconds via thermal diffusion into the bulk, consistent with the out-of-plane thermal conductivity of the material52. At a pump fluence of 3.4 mJ/cm², we observe a sharp threshold behavior, leading to a full suppression of the NC phase. Simultaneously, the IC phase appears, and its diffraction spot intensity saturates for higher fluences (with some indication of a thermal suppression at the highest fluence, cf. Fig. 2e). Interestingly, the time curves of the suppression and emergence of the NC and IC phases, respectively, are markedly different (cf. Fig. 2f): While the NC phase is suppressed within our temporal resolution (see also Refs. 26,28), the IC spot intensity continuously increases over time after an initial fast rise to about half of the signal measured at Δ =1 ns. Notably, the appearing IC signal continuously grows over several hundred picoseconds, an observation which cannot be accounted for by the slower nanosecond thermal relaxation of the newly-created IC phase.
Fig. 2: ULEED of the structural phase transition between CDW phases. a, Diffraction pattern of the NC phase recorded at Δ < 0 ps. b, Diffraction pattern of the sample optically-pumped to the IC phase (Δ > 734 ps). Note the CDW satellite spots, which are rotated by -12° with respect to the NC phase in (a). c, Difference image of the pumped and unpumped diffraction patterns (a, blue) and (b, red). d, Line profile of NC and IC CDW diffraction spots marked in (c). e, Fluence dependence of the NC, IC and Bragg diffraction peak intensities at Δ = 1.1 ns, normalized to the NC and Bragg spot intensities , and , at lowest pump fluence and negative times. f, Integrated diffraction spot intensities of the Bragg (top), NC (center) and IC (bottom) diffraction peaks vs. delay time for ten optical pump fluences, normalized to the signal at negative times. Dashed line (ICP panel): Integrated intensity of IC diffraction peaks for highest pump fluence. g, Ratio of integratedto-maximum diffraction spot intensities (normalized to long delays), showing time-dependent narrowing in the ICP spots.
Compared to the maximum intensities of the IC diffraction spots (Fig. 2f, bottom), the integrated spot intensity (dashed line, highest fluence) exhibits a somewhat faster rise. This is also evident in the ratio of the integrated to the maximum diffraction signals in Fig. 2g (red line), contrasted with the same evaluation for the Bragg peaks (green line). These observations indicate that the diffraction spot profile or width substantially changes within the first 200 ps after the pump pulse, as directly shown in Figs. 3a, b. In order to quantitatively analyze these spot profiles and associate them with structural correlation lengths in the IC phase, the CDW and lattice diffraction spots are fitted with two-dimensional Lorentzians for all delay times (see Fig. 3a). Figure 3c displays the delay-dependent widths of the IC and lattice diffraction spots as circles and triangles, respectively. We find that the IC diffraction spots initially appear as rather broad peaks that significantly sharpen within 400 ps after the excitation from = 0.06 Å-1 at Δ = 20 ps to
< 0.038 Å-1 for ∆ > 400 ps. Here,
is the diffraction spot FWHM, taken as the
geometric mean of both semi-axes. To analyze the evolution of spot profiles in more detail, we determine a time-dependent peak width
that accounts for the finite experimental momentum resolution: =
(
)# − Δ
#
.
A decrease in spot width for selected delay times was very recently observed by UED28 and ultrafast X-ray diffraction53, but was not closely traced over time. In both works, the temporal evolution of the transition was attributed to nucleation and growth of the IC phase. Specifically, Ref. Ref.
53,
28
hypothesized that the growth may be initiated at the NC discommensurations, while in
coarsening of the IC phase was viewed due to the growth of domains enclosed by domain walls. In the present work,
as we detail below, we put forward an alternative mechanism, in which the diffraction peak sharpening is interpreted as coarsening of the nascent IC texture by the annihilation of topological defects. First, we note that the integrated intensity of the IC diffraction peaks rises faster than their maximum. This implies that major portions of IC phase are present already shortly after the transition, and that the continuing growth of the maximum intensity of the IC spot (Fig. 2f, bottom) over the first few hundred picoseconds is largely due to diffraction peak reshaping. In terms of the real space structure, this corresponds to a growth of the correlation length %
=2 /
with time Δ .
Generally, the correlation length or characteristic length scale of a system undergoing phase-ordering kinetics typically follows a universal power-law scaling over time, i.e. % ∝
.
The growth exponent ' depends on the type of order parameter
(conserved/non-conserved)54, the effective dimensionality55
and in-plane anisotropy, and, in the case of defects, their diffusion55
and interaction forces56. Analyzing the correlation length %
of the present system on a double-logarithmic scale, we indeed
find a power-law scaling %
∝Δ
.()± . (
(Fig. 3c, inset). The important question now arises, which structural
inhomogeneities or defects result in the finite correlation lengths observed experimentally, and how the coarsening is manifest in the texture of the order parameter. As part of his seminal work on CDWs, McMillan showed that the hexagonal lattice pattern of charge ordering in the IC phase exhibits elementary excitations corresponding to atomic equivalents of long range “phonon” displacements (also referred to as “phasons” 57) and “edge dislocation” defects58–60. While the “phonon” excitations discussed would lead to a Debye-Waller type diffraction peak suppression, the vortex-like “edge dislocations” limit the correlation length of the structure: They are defects of a topological character, which exhibit phase singularities in two of the three complex order parameters +,,#,( (-.) contributing to the real order parameter, namely the charge density modulation /(-.) = Re(ψ, (-.) + +# (-.) + +( (-.))58. In analogy to atomic lattices, the CDW dislocations are inherently stable entities characterized by a
topological invariant, the Burger’s vector (cf. Fig 3d), pointing in one of the six possible directions given by the CDW. The density of such defects may be reduced by annihilation of dislocations with opposite Burger’s vectors (number of defects reduced by two for every event), or by recombination of two defects with an angle of 120° between the Burger’s vectors into a new defect described by their vector sum.
Fig. 3: Phase-ordering kinetics of IC CDW governed by topological defects. a, ICP diffraction spot profiles at three time delays fitted with Lorentzian lineshapes. b, Corresponding ICP diffraction spot images (color scale normalized to peak height). c, Time-dependent spot profile width (FWHM) of ICP and lattice diffraction peaks for the four highest optical pump fluences. The decreasing peak width is related to an increasing correlation length of the structure. Inset: A double-logarithmic plot of the correlation length corrected for the instrument response function indicates a scaling law for the phase-ordering kinetics. d, Hexagonal IC CDW lattice distorted by an edge dislocation, which is uniquely characterized by its Burger’s vector (red). Inset: Schematic displacement of Ta atoms in the IC phase. e, Edge dislocations in IC phase at three different defect densities and corresponding Fourier-transformations (squared magnitudes) of the charge density. f, IC lattice correlation length % obtained from simulations in (e), plotted as a function of dislocation density 45 , in defects per CDW unit cell. The observed dependence with density % ∝ 456 .)) is close to that expected for the average defect distance 7 ∝ 456 .).
Driving the system from the NC phase into the IC phase in an ultrafast, nonthermal manner, as in our experiments, requires the global transformation into a CDW state exhibiting different symmetries and wavevectors (orientation and magnitude) of the charge-order. As this transformation has stochastic elements and is locally driven in effectively decoupled nanoscale regions, it represents a quench: It necessarily involves the creation of a highly disordered state that locally exhibits IC periodicity and orientation, but which is globally characterized by a considerable density of fluctuation modes and dislocation-type defects and, thus, lacks long-range phase coherence. In this picture, the origin of finite correlation lengths is markedly different from an interpretation in terms of distinct and well-oriented domains separated by domain walls53. We argue against domains separated by walls, as they would not be stabilized by free-energy minimization in the IC phase, as opposed to the case for, e.g., commensurate phases. Instead, conserving the topology of the charge-ordered state, strong phase gradients (composed of phasons) may continuously decay to minimize the free energy59, giving rise to a growth of the integral diffraction spot intensity. The topological defects, on the other hand, will be more persistent. Figure 3e presents simulated nanoscale textures of the CDW/PLD in the IC phase in the presence of a varying number of dislocation-type defects, together with the resulting predicted diffraction spot profiles (the squared Fourier magnitudes of the CDW yield the spot profiles for small displacements). An analysis of the width of the predicted diffraction spots (Fig. 3e) as a function of defect density 45 (% topological defects (7 ∝ 456
.)
∝ 456
.))
) shows that the correlation length essentially scales as the average distance between
), such that the experimentally determined correlation length is a valid measure for the defect
density (cf. inset Fig. 3c, right axis). Combining our experimental analysis with this defect model, we thus interpret the growth in correlation length to be caused by the natural process of defect annihilation. The specific growth law of the charge-ordering kinetics is governed by the glide and/or climb of the defects and the forces acting during their annihilation. At present, it is beyond the scope of this work to relate the growth exponent to physical properties of the material, such as the d-band charge
density and conductivity entering fluid-dynamics modeling59. However, we note that the numerical value of ' = 0.35 ± 0.03 found in our measurements is between the one for diffusion-limited particle-antiparticle annihilation in two dimensions (0.25) and that of pair annihilation for homogeneous defect densities (0.5) 55. We find the growth exponent to be universal for this transition in the sense that it does not depend on the excitation fluence in the range studied. In conclusion, utilizing an ultrafast surface-sensitive structural probe, our work traces the phase-ordering kinetics of a chargedensity wave system effectively quenched by optical excitation. Generally, our findings of kinetics driven by dislocation defects represent a striking counterpart of ultrafast phason dynamics in the absence of topological defects, as recently observed in charge- and spin-ordered nickelates57. In fact, the present system may exhibit both phenomena, and the extent to which the decay of non-topological phase fluctuations contribute to the relaxation will be a subject of further study. Similarly, the initial concentration of topological defects and its dependence on the spatial textures of both phases involved remains an intriguing issue. This study was enabled by the development of a new technique in ultrafast surface science, namely ultrafast low-energy electron diffraction. We believe that ULEED will be widely applicable for the investigation of structural dynamics at surfaces and their reconstructions, as well as in atomic and molecular adsorbates and superstructures.
References:
1.
Lüth, H. Surfaces and Interfaces of Solid Materials. (Springer Science & Business Media, 2013).
2.
Kosterlitz, J. M. & Thouless, D. J. Ordering, metastability and phase transitions in two-dimensional systems. J. Phys. C Solid State Phys. 6, 1181 (1973).
3.
Wolf, M. Femtosecond dynamics of electronic excitations at metal surfaces. Surf. Sci. 377, 343–349 (1997).
4.
Höfer, U. et al. Time-Resolved Coherent Photoelectron Spectroscopy of Quantized Electronic States on Metal Surfaces. Science 277, 1480–1482 (1997).
5.
Mahmood, F. et al. Selective scattering between Floquet-Bloch and Volkov states in a topological insulator. Nat. Phys. 12, 306–310 (2016).
6.
Bovensiepen, U., Petek, H. & Wolf, M. Dynamics at Solid State Surfaces and Interfaces: Volume 1 - Current Developments. (John Wiley & Sons, 2010).
7.
Rohwer, T. et al. Collapse of long-range charge order tracked by time-resolved photoemission at high momenta. Nature 471, 490–493 (2011).
8.
Eich, S. et al. Time- and angle-resolved photoemission spectroscopy with optimized high-harmonic pulses using frequency-doubled Ti:Sapphire lasers. J. Electron Spectrosc. Relat. Phenom. 195, 231–236 (2014).
9.
Sohrt, C., Stange, A., Bauer, M. & Rossnagel, K. How fast can a Peierls–Mott insulator be melted? Faraday Discuss. 171, 243–257 (2014).
10. Petek, H. & Ogawa, S. Femtosecond time-resolved two-photon photoemission studies of electron dynamics in metals. Prog. Surf. Sci. 56, 239–310 (1997). 11. La-O-Vorakiat, C. et al. Ultrafast Demagnetization Measurements Using Extreme Ultraviolet Light: Comparison of Electronic and Magnetic Contributions. Phys. Rev. X 2, 011005 (2012). 12. Elsayed‐Ali, H. E. & Herman, J. W. Picosecond time‐resolved surface‐lattice temperature probe. Appl. Phys. Lett. 57, 1508–1510 (1990). 13. Aeschlimann, M. et al. A picosecond electron gun for surface analysis. Rev. Sci. Instrum. 66, 1000 (1995). 14. Schäfer, S., Liang, W. & Zewail, A. H. Structural dynamics of surfaces by ultrafast electron crystallography: Experimental and multiple scattering theory. J. Chem. Phys. 135, 214201 (2011). 15. Hanisch-Blicharski, A. et al. Ultra-fast electron diffraction at surfaces: From nanoscale heat transport to driven phase transitions. Ultramicroscopy 127, 2–8 (2013). 16. Frigge, T. et al. Optically excited structural transition in atomic wires on surfaces at the quantum limit. Nature advance online publication, (2017). 17. Becker, R. S., Higashi, G. S. & Golovchenko, J. A. Low-Energy Electron Diffraction during Pulsed Laser Annealing: A Time- Resolved Surface Structural Study. Phys. Rev. Lett. 52, 307–310 (1984).
18. Karrer, R., Neff, H. J., Hengsberger, M., Greber, T. & Osterwalder, J. Design of a miniature picosecond low-energy electron gun for time-resolved scattering experiments. Rev. Sci. Instrum. 72, 4404 (2001). 19. Cirelli, C. et al. Direct observation of space charge dynamics by picosecond low-energy electron scattering. EPL Europhys. Lett. 85, 17010 (2009). 20. Gulde, M. et al. Ultrafast low-energy electron diffraction in transmission resolves polymer/graphene superstructure dynamics. Science 345, 200–204 (2014). 21. Müller, M., Paarmann, A. & Ernstorfer, R. Femtosecond electrons probing currents and atomic structure in nanomaterials. Nat. Commun. 5, 5292 (2014). 22. Siwick, B. J., Dwyer, J. R., Jordan, R. E. & Miller, R. J. D. An Atomic-Level View of Melting Using Femtosecond Electron Diffraction. Science 302, 1382–1385 (2003). 23. Baum, P., Yang, D.-S. & Zewail, A. H. 4D Visualization of Transitional Structures in Phase Transformations by Electron Diffraction. Science 318, 788–792 (2007). 24. Carbone, F., Kwon, O.-H. & Zewail, A. H. Dynamics of Chemical Bonding Mapped by Energy-Resolved 4D Electron Microscopy. Science 325, 181–184 (2009). 25. Ernstorfer, R. et al. The Formation of Warm Dense Matter: Experimental Evidence for Electronic Bond Hardening in Gold. Science 323, 1033–1037 (2009). 26. Eichberger, M. et al. Snapshots of cooperative atomic motions in the optical suppression of charge density waves. Nature 468, 799–802 (2010). 27. Mourik, M. W. van, Engelen, W. J., Vredenbregt, E. J. D. & Luiten, O. J. Ultrafast electron diffraction using an ultracold source. Struct. Dyn. 1, 034302 (2014). 28. Haupt, K. et al. Ultrafast Metamorphosis of a Complex Charge-Density Wave. Phys. Rev. Lett. 116, (2016). 29. King, W. E. et al. Ultrafast electron microscopy in materials science, biology, and chemistry. J. Appl. Phys. 97, 111101 (2005). 30. Zewail, A. H. Four-Dimensional Electron Microscopy. Science 328, 187–193 (2010). 31. Piazza, L. et al. Design and implementation of a fs-resolved transmission electron microscope based on thermionic gun technology. Chem. Phys. 423, 79–84 (2013). 32. Feist, A. et al. Quantum coherent optical phase modulation in an ultrafast transmission electron microscope. Nature 521, 200–203 (2015). 33. Plemmons, D. A., Suri, P. K. & Flannigan, D. J. Probing Structural and Electronic Dynamics with Ultrafast Electron Microscopy. Chem. Mater. 27, 3178–3192 (2015). 34. van Oudheusden, T. et al. Compression of Subrelativistic Space-Charge-Dominated Electron Bunches for Single-Shot Femtosecond Electron Diffraction. Phys. Rev. Lett. 105, 264801 (2010). 35. Chatelain, R. P., Morrison, V. R., Godbout, C. & Siwick, B. J. Ultrafast electron diffraction with radio-frequency compressed electron pulses. Appl. Phys. Lett. 101, 081901 (2012).
36. Maxson, J. et al. Direct measurement of sub-10 fs relativistic electron beams with ultralow emittance. ArXiv161101701 Phys. (2016). 37. Gerbig, C., Senftleben, A., Morgenstern, S., Sarpe, C. & Baumert, T. Spatio-temporal resolution studies on a highly compact ultrafast electron diffractometer. New J. Phys. 17, 043050 (2015). 38. Raman, R. K., Tao, Z., Han, T.-R. & Ruan, C.-Y. Ultrafast imaging of photoelectron packets generated from graphite surface. Appl. Phys. Lett. 95, 181108 (2009). 39. Park, H. & Zuo, J. M. Direct measurement of transient electric fields induced by ultrafast pulsed laser irradiation of silicon. Appl. Phys. Lett. 94, 251103 (2009). 40. Mancini, G. F. et al. Design and implementation of a flexible beamline for fs electron diffraction experiments. Nucl. Instrum. Methods Phys. Res. Sect. Accel. Spectrometers Detect. Assoc. Equip. 691, 113–122 (2012). 41. Hommelhoff, P., Sortais, Y., Aghajani-Talesh, A. & Kasevich, M. A. Field Emission Tip as a Nanometer Source of Free Electron Femtosecond Pulses. Phys. Rev. Lett. 96, 077401 (2006). 42. Ropers, C., Solli, D. R., Schulz, C. P., Lienau, C. & Elsaesser, T. Localized Multiphoton Emission of Femtosecond Electron Pulses from Metal Nanotips. Phys. Rev. Lett. 98, 043907 (2007). 43. Ehberger, D. et al. Highly Coherent Electron Beam from a Laser-Triggered Tungsten Needle Tip. Phys. Rev. Lett. 114, 227601 (2015). 44. Wilson, J. A., Salvo, F. J. D. & Mahajan, S. Charge-density waves and superlattices in the metallic layered transition metal dichalcogenides. Adv. Phys. 24, 117–201 (1975). 45. Rossnagel, K. On the origin of charge-density waves in select layered transition-metal dichalcogenides. J. Phys. Condens. Matter 23, 213001 (2011). 46. Stojchevska, L. et al. Ultrafast Switching to a Stable Hidden Quantum State in an Electronic Crystal. Science 344, 177– 180 (2014). 47. Fazekas, P. & Tosatti, E. Electrical, structural and magnetic properties of pure and doped 1T-TaS2. Philos. Mag. Part B 39, 229–244 (1979). 48. Ritschel, T. et al. Orbital textures and charge density waves in transition metal dichalcogenides. Nat. Phys. 11, 328–331 (2015). 49. Spijkerman, A., de Boer, J. L., Meetsma, A., Wiegers, G. A. & van Smaalen, S. X-ray crystal-structure refinement of the nearly commensurate phase of 1T-TaS2 in (3+2)-dimensional superspace. Phys. Rev. B 56, 13757–13767 (1997). 50. Han, T.-R. T. et al. Exploration of metastability and hidden phases in correlated electron crystals visualized by femtosecond optical doping and electron crystallography. Sci. Adv. 1, e1400173 (2015). 51. Nakanishi, K., Takatera, H., Yamada, Y. & Shiba, H. The Nearly Commensurate Phase and Effect of Harmonics on the Successive Phase Transition in 1T-TaS2. J. Phys. Soc. Jpn. 43, 1509–1517 (1977). 52. Hellmann, S. et al. Time-resolved x-ray photoelectron spectroscopy at FLASH. New J. Phys. 14, 013062 (2012).
53. Laulhé, C. et al. Watching the birth of a charge density wave order: diffraction study on nanometer-and picosecondscales. ArXiv170307465 Cond-Mat (2017). 54. Bray, A. J. Theory of phase-ordering kinetics. Adv. Phys. 51, 481–587 (2002). 55. Toussaint, D. & Wilczek, F. Particle–antiparticle annihilation in diffusive motion. J. Chem. Phys. 78, 2642–2647 (1983). 56. Toyoki, H. Pair annihilation of pointlike topological defects in the ordering process of quenched systems. Phys. Rev. A 42, 911–917 (1990). 57. Lee, W. S. et al. Phase fluctuations and the absence of topological defects in a photo-excited charge-ordered nickelate. Nat. Commun. 3, 838 (2012). 58. McMillan, W. L. Landau theory of charge-density waves in transition-metal dichalcogenides. Phys. Rev. B 12, 1187– 1196 (1975). 59. McMillan, W. L. Time-dependent Laudau theory of charge-density waves in transition-metal dichalcogenides. Phys. Rev. B 12, 1197–1199 (1975). 60. McMillan, W. L. Theory of discommensurations and the commensurate-incommensurate charge-density-wave phase transition. Phys. Rev. B 14, 1496–1502 (1976).