Advances in Peritoneal Dialysis, Vol. 24, 2008
Alp Akonur, Clifford J. Holmes, John K. Leypoldt
The ultrafiltration (UF) efficiency of peritoneal dialysis (PD) solutions, defined as the net UF divided by the amount of carbohydrate absorbed per dwell, has been shown to be higher during long dwells with 7.5% icodextrin solution (Extraneal: Baxter Healthcare Corporation, Deerfield, IL, U.S.A.) than during those with glucose-based solution (2.5% and 4.25% Dianeal: Baxter Healthcare Corporation), prompting a better understanding of UF efficiency. We used the three-pore kinetic model of PD transport to investigate UF efficiency for single long dwells and various combinations of multiple short glucosebased dwells during automated PD (APD). To demonstrate a practical consequence of the effect of dwell time, we simulated two hypothetical APD prescriptions (A and B) in which fluid with a high glucose concentration was used during either the long day dwell (A: 4.25%; B: 2.5%) or the short night dwells (A: 3× 1.5% + 1× 2.5%; B: 4 × 2.5%). Computer simulations showed that • •
higher glucose concentrations and shorter dwell times increase the UF efficiency of a single dwell, and UF efficiency depends on patient transport status.
When 24-hour APD therapy was simulated for a low-average transporter, the net UF did not differ considerably (A: 1132 mL; B: 1154 mL), but total carbohydrate absorption was higher when solution with a high glucose concentration was used during the single long dwell (A: 146 g; B: 137 g), resulting in lower UF efficiency (A: 7.8 mL/g; B: 8.4 mL/g).
From: Renal Division, Baxter Healthcare Corporation, McGaw Park, Illinois, U.S.A.
Ultrafiltration Efficiency During Automated Peritoneal Dialysis Using Glucose-Based Solutions We conclude that the UF efficiency of the entire regimen should be considered in prescribing PD therapy. When available, Extraneal provides the best UF efficiency during long dwells. Our simulations suggest that raising the glucose concentration in the short dwells and lowering it in the long dwell is the optimal strategy to maximize UF efficiency during APD when Extraneal is not available. Key words Ultrafiltration, ultrafiltration efficiency, glucose absorption, automated peritoneal dialysis Introduction Continuous ambulatory and automated peritoneal dialysis (PD) patients are dialyzed primarily with solutions that use glucose as the osmotic agent. However, evidence is growing that use of glucose-based PD solutions is accompanied by undesirable amounts of systemic glucose absorption (1) and changes in peritoneal membrane physiology caused by exposure to high concentrations of glucose, glucose degradation products, and advanced glycosylated end-products (2). Several studies have shown that continual exposure to hypertonic solutions (3.86% glucose) results in irreversible changes in peritoneal membrane structure, possibly leading to higher-than-normal smallsolute permeability of the membrane (1,3) and eventually ultrafiltration failure (1–3). Extraneal (Baxter Healthcare Corporation, Deerfield, IL, U.S.A.), a 7.5% icodextrin solution, is advantageous for single long-dwell exchanges of 8 – 16 hours, because it maintains sustained ultrafiltration (UF) for the entire dwell with a lower amount of carbohydrate (CHO) absorption. These combined benefits can be summarized in a single parameter, “UF efficiency,” defined as the net UF divided by the amount of CHO absorbed. When compared with either 2.5% or 4.25% dextrose
70 solutions, Extraneal has a UF efficiency superior to that of either glucose-based solution for long dwells (4). In the present study, we examined the concept of UF efficiency in the treatment of automated PD (APD) patients using only glucose-based solutions using computer simulations of the theoretic three-pore model of PD transport. This work shows that the APD prescription can alter UF efficiency when calculated over a 24-hour interval. Patients and methods Patient data The patient parameters used in this study were obtained from data submitted to the Baxter Healthcare Renal Division in 1999 by centers around the United States and Canada participating in a national adequacy initiative program (TARGET: Baxter Healthcare Corporation). The data were grouped in categories according to peritoneal transport status: high, high average, low average, and low. Relevant kinetic transport parameters such as solute mass transfer area coefficient [MTAC (mL/min)], ultrafiltration coefficient [LPA (mL min–1 mmHg–1)], and transport surface area [A0/dX (cm)] were estimated using PD Adequest 2.0 (5). Four typical patients were then created as representatives of each category. Tables I and II show the typical physiologic characteristics and kinetic parameters for each patient transport category. Computer model and verification In our study, the goal was to use the set of average patient parameters already mentioned to provide a better understanding of the factors influencing the UF efficiency of glucose-based PD solutions. The UF and the dialysate solute concentrations were simulated, based on a modified three-pore membrane model (5– 7). A formal validation for small-solute removal and UF had previously been performed for PD Adequest 2.0 (5), which also constitutes the basis of the three-pore model used here. The Matlab software program (v. 7.5.0.342: The Mathworks, Natick, MA, U.S.A.) was used to solve fluid and solute transport equations by applying numeric integration. Although the fundamental peritoneal transport formalism does not differ from that for PD Adequest 2.0, we made certain changes. It was therefore necessary to compare simulation results with clinical data as a means of informal verification. To do that, we
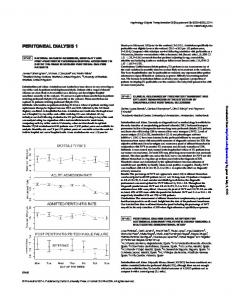
Akonur et al. obtained permission from Dr. P. Freida to reprint recently published UF and Na removal data (8). Figure 1 compares measured (8) net UF and Na removal and model simulations. The patients reported by Dr. Freida were high-transport patients. It is clear that there is large variability in UF and Na measurements alike. To make the comparison, we simulated both high transport and high-average transport patients as noted in the figure. It is evident that the model simulations are in reasonable agreement with the clinical data. Results UF efficiency The UF efficiency, defined as the net UF divided by the amount of total CHO absorbed, UF efficiency = net UF (mL) / total CHO absorbed (g), [1] has previously been suggested as a new metric to guide the design of optimal therapy regimens and new solution development (4). In the clinical setting, UF and total CHO absorption are measured only at the end of a patient’s therapy. As a result, that measurement yields a single UF efficiency value associated with a particular solution and therapy. In the present work, we show that UF efficiency is not solely associated with a solution or therapy regimen, but should be considered dependent on a variety of factors, including dwell time, concentration of the osmotic agent, transport status (as measured by a peritoneal equilibration test). We illustrate these principles by examining the general dependency of UF efficiency on these parameters for Patient characteristics by peritoneal transport category as assessed in a peritoneal equilibration test (PET) TABLE I
PET category H HA LA L
Age (years)
Weight (kg)
Height (cm)
BSA ( m 2)
TBW (L)
49.5 46 43.5 54
73.1 74.5 77.1 74.8
170.2 170 168 168.8
1.85 1.86 1.87 1.85
40.6 41.4 42.3 40.6
BSA = body surface area; TBW = total body water; H = high; HA = high average; LA = low average; L = low.
UF Efficiency During APD with Glucose Solution
71
Patient kinetic parameters by peritoneal transport category as assessed in a peritoneal equilibration test (PET) and three-pore model TABLE II
Kinetic parameter Glucose MTAC (mL/min) Urea MTAC (mL/min) Creatinine MTAC (mL/min) Sodium MTAC (mL/min) β 2 -microglobulin MTAC (mL/min) Albumin MTAC (mL/min) LPA (mL min –1 mmHg –1 ) A0/dX (cm)
H 16.34 27.71 19.15 6.78 1.0093 0.0031 0.0575 40,398
Transport category HA LA 11.71 23.14 11.92 4.93 0.7336 0.0023 0.0560 29,362
8.35 18.40 8.60 3.68 0.5482 0.0017 0.0492 21,942
L 5.96 15.92 5.19 2.75 0.4098 0.0013 0.0554 16,402
H = high; HA = high average; LA = low average; L = low; MTAC = mass transport area coefficient; LPA = ultrafiltration coefficient; A0/dX = transport surface area.
(A)
(B)
FIGURE 1
Simulation results compared with clinical data for (A) ultrafiltration (UF) and (B) sodium removal in patients with high (H) and high-average (HA) transport (dashed lines) and mean clinical data (filled circles). Error bars show 1 standard deviation. Average of predictions for H and HA are also shown (solid lines).
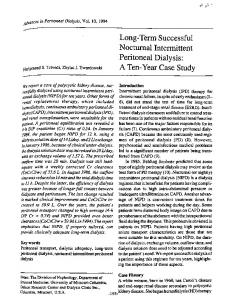
glucose-based solutions. The dependence of UF efficiency on fill volume has also been examined; however, it will be discussed elsewhere. Dependence on dwell time The combined effects of UF and CHO (that is, glucose) absorption directly affect the temporal evolution of UF efficiency from glucose-based solutions. Figure 2 shows a set of time-dependent curves for net UF, total CHO absorbed, and UF efficiency for a patient with high-average transport using 2.5% dextrose solution. Net UF increases up to 300 mL at about 3.5 hours; it then decreases until the end of the therapy because of a loss of the osmotic pressure gradient resulting from absorption of glucose and absorption of fluid from the peritoneal cavity via the lymphatic system and directly into peritoneal tissues. There is no peak in the CHO absorption profile, because the body continuously absorbs glucose throughout the dwell. The UF efficiency profile reaches its maximum point within the first hour of the dwell. After that point, the continuous absorption of glucose and the fluid reabsorption result in a decrease of UF efficiency. Dependence on glucose concentration It is possible to increase UF efficiency by increasing the dextrose concentration in the dialysis solution. However, this change positively affects only the value of the peak UF efficiency, and not the decreasing trend that occurs after approximately the first hour or so. In addition, the incremental gain achieved by adding more dextrose to the solution does not result in equal gain in UF efficiency. For instance, when 1.5% dextrose solution is replaced by 2.5% dextrose solution
72
(A)
Akonur et al. [Figure 3(A)], the peak UF efficiency increases approximately from 6.5 mL/g to 12 mL/g, which is almost a 100% increase. On the other hand, when 2.5% dextrose solution is replaced by 4.25% dextrose solution, the peak UF efficiency of approximately 15 mL/g is achieved, which is an increase of only approximately 25%. Dependence on transport status The ability of low transport patients to generate more UF and absorb less carbohydrate as compared with patients of other transport types greatly affects UF efficiency. In Figure 3(B), it is evident that the peak UF efficiency increases from high to low transport patients. In addition, the time at which UF efficiency reaches its is slightly less with with higher transport status.
(B) (A)
(B) (C)
FIGURE 3
FIGURE 2
Time dependence of (A) net ultrafiltration (UF), (B) total glucose (CHO) absorption, and (C) UF efficiency (UF in milliliters divided by CHO absorption in grams). Results are shown for a patient with high-average transport using 2.5% dextrose solution.
(A) Dependence of ultrafiltration (UF) efficiency on the concentration of the osmotic agent: 4.25% (dotted line), 2.5% (dashed line), and 1.5% (solid line) dextrose (CHO) solution for a high-average patient. (B) Dependence of UF efficiency on patient peritoneal equilibration test (PET) category with 2.5% dextrose solution: high [H (solid line)], high average [HA (dashed line)], low average [LA (dotted line)], and low [L (dotted–dashed line)]. Vertical lines indicate peaks.
UF Efficiency During APD with Glucose Solution
73
Discussion Optimal use of high glucose solutions based on UF efficiency We have demonstrated that UF efficiency is not a property of any solution alone, but a cumulative effect resulting from a combination of factors involved in the daily PD prescription. Specifically, for a given patient and infused solution volume, the UF efficiency is a strong function of dwell time and glucose concentration in the infused solution. Given this relationship, the UF efficiency can be used to design more optimal APD therapies, as previously suggested by Holmes and Mujais (4) and Holmes and Shockley (9). To quantify the practical consequences of using PD solutions with high glucose concentrations during either long day dwells or short night dwells, we considered two hypothetical cases, A and B. Table III shows the relevant parameters for both cases, where the fill volume was taken to be 2.5 L for all patients. Furthermore, an optimal therapy design must focus not on the individual UF efficiencies of day or night dwells, but on all dwells over 24 hours. The therapy regimens shown in Table III were therefore simulated to calculate the net UF, total CHO absorbed, and UF efficiency per day. The results are shown in Table IV. TABLE III
Clearly, the use of higher glucose concentrations during the short night dwells results in an increase of 24-hour UF efficiency for all patients. High transport patients benefit the most and low transport patients benefit the least, gaining an additional 1.0 mL and 0.6 mL net UF per gram of CHO absorbed respectively. However, the reason behind the increase is different for each PET category. For instance, the UF efficiency of a high transport patient increases because of an increase in net UF of 187 mL at the expense of 2.2 g more CHO absorption. On the other hand, the UF efficiency of a low transport patient increases because of a decrease in CHO absorption of 9.5 g and a corresponding decrease in net UF of 69 mL. The high-average and low-average transport patients benefit more positively both from moderate increases of net UF and from decreases of CHO absorption. Finally, it is important to point to the results of a previous clinical study in which the effects of the number of APD cycles on clearances, UF, and glucose absorption were investigated (10). Among other parameters, the authors provided net UF and glucose absorption data for 2.27%/2.5% solution used during 9-hour nightly APD with 5, 7, or 9 cycles and a 2-L fill volume (10). The UF efficiencies calculated based on those data, shown in Table V, agree with
Summary of therapy parameters considered for the two hypothetical cases Total exchange time (hours)
Exchanges (n)
14 10
1 4
Daytime dwell Nighttime dwells
Dextrose concentration (%) Case A Case B
4.25 3 × 1.5 + 2.5
2.5 2.5
Daily net ultrafiltration (UF), total glucose (CHO) absorption, and UF efficiency a values for patients b by peritoneal transport category as assessed in a peritoneal equilibration test (PET) TABLE IV
PET category
H L HA LA a
Daily UF (mL)
Case A CHO (g/day)
UF efficiency
Daily UF (mL)
Case B CHO (g/day)
UF efficiency
469 1770 847 1132
187.4 120.4 167.7 145.7
2.5 14.7 5.1 7.8
656 1701 974 1154
189.6 110.9 162.9 137.2
3.5 15.3 6.0 8.4
Ultrafiltration in milliliters divided by glucose absorption in grams. The ultrasmall pore fraction of 3.5% (7) was assumed. H = high; L = low; HA = high average; LA = low average. b
74
Akonur et al.
Clinical data illustrating the effect of automated peritoneal dialysis short dwells a on ultrafiltration (UF) efficiency (10) TABLE V
Regimen
5×2 L 7×2 L 9×2 L
Net UF (mL)
Glucose absorbed (g)
UF efficiency b
877±480 1220±542 1297±380
116±38 121±35 126±48
7.58 10.06 10.26
a
2.27%/2.5% solution, 9 hours total time, n = 18. Ultrafiltration in milliliters divided by glucose absorption in grams. b
the simulation results provided in the present study; both point to higher UF efficiencies being obtained during short dwells. The higher UF efficiency reported in the present study with the use of high glucose concentrations during short rather than long dwells is relatively small, and the clinical consequences of altering APD prescriptions based on these computer simulations is unclear. Indeed, the increase in UF efficiency when using Extraneal as compared with glucose-based PD solution during the long dwells is substantially greater. Nonetheless, excess glucose load during PD is undesirable, and the current analysis suggests one method of decreasing total CHO absorption. Conclusions We showed that UF efficiency is not a property of the dialysis solution; rather, it depends on dwell time, concentration of the osmotic agent (that is, glucose), and the patient’s transport type. We also showed that the UF efficiency of APD prescriptions can be improved by increasing the glucose concentration during short dwells and, at the same, decreasing it during the long dwell. That approach maximizes UF efficiency in therapies when Extraneal is not available as the preferred long-dwell option.
References 1 Davies SJ, Phillips L, Naish PF, Russell GI. Peritoneal glucose exposure and changes in membrane solute transport with time on peritoneal dialysis. J Am Soc Nephrol 2001;12:1046–51. 2 De Vriese AS. Interesting news in peritoneal dialysis. Nephron 2002;92:763–71. 3 Davies SJ. Mitigating peritoneal membrane characteristics in modern peritoneal dialysis therapy. Kidney Int Suppl 2006;103:S76–83. 4 Holmes C, Mujais S. Glucose sparing in peritoneal dialysis: implications and metrics. Kidney Int Suppl 2006;103:S104–9. 5 Vonesh EF, Story KO, O’Neill WT. A multinational clinical validation study of PD Adequest 2.0. PD Adequest International Study Group. Perit Dial Int 1999;19:556–71. 6 Rippe B, Stelin G, Haraldsson B. Computer simulations of peritoneal fluid transport in CAPD. Kidney Int 1991;40:315–25. 7 Vonesh EF, Rippe B. Net fluid absorption under membrane transport models of peritoneal dialysis. Blood Purif 1992;10:209–26. 8 Freida P, Galach M, Divino Filho JC, Werynski A, Lindholm B. Combination of crystalloid (glucose) and colloid (icodextrin) osmotic agents markedly enhances peritoneal fluid and solute transport during the long PD dwell. Perit Dial Int 2007;27:267–76. 9 Holmes CJ, Shockley T. Strategies to reduce glucose exposure in peritoneal dialysis patients. Perit Dial Int 2000;20(Suppl 2):S37–41. 10 Perez RA, Blake PG, McMurray S, Mupas L, Oreopoulos DG. What is the optimal frequency of cycling in automated peritoneal dialysis? Perit Dial Int 2000;20:548–56. Corresponding author: Alp Akonur, PhD, Baxter Healthcare, 1620 Waukegan Road, William Graham Building, Mail Code MPGR-A2N, McGaw Park, Illinois 60085 U.S.A. E-mail:
[email protected]