IEEE TRANSACTIONS ON INSTRUMENTATION AND MEASUREMENT, VOL. 49, NO. 5, OCTOBER 2000
1101
Uncertainty Characterization in Image-Based Measurements: A Preliminary Discussion Massimo De Santo, Member, IEEE, Consolatina Liguori, Member, IEEE, and Antonio Pietrosanto, Member, IEEE
Abstract—There are a large number of application fields where measurements deriving from digital images can assume a great relevance. Nevertheless, to make a profitable use of such measurements, it is indispensable to achieve a complete and quantitative control on uncertainties that real systems introduce along the chain of steps going from real-world objects to the results of the measurement process. This paper deals with this nontrivial task and, in particular, with the analytical expression of uncertainty characterizing the results of image processing software. At first, a simplified model of uncertainty of digital images is derived and experimentally tested; then the Canny edge detector output uncertainty is analytically expressed and verified both in artificial and real-world images. Index Terms—Algorithms, image edge analysis, image processing, measurement errors, uncertainty.
I. INTRODUCTION
D
IGITAL images play a role of ever growing interest in a number of engineering fields [1]. From the one side, their continuous success can be ascribed to human-related psychological motivations: human beings positively prefer to use images for exchanging information. From the other side, today’s computer systems make it easier and easier to utilize images because of the noticeable improvements in hardware and software technologies for managing them introduced in the last few years. In some fields, e.g., in human-computer interface design, managing images is in a certain sense a qualitative matter, even when they have to be used as input for the elaboration system. In other fields, e.g., in morphological analysis of products, digital images are used for quantitative purposes which are in turn functional to some final goals (e.g., individuation and elimination of defective industrial products). It is easy to understand that, for a quantitative use of digital images (or, even better, for a quantitative use of the measures coming from digital images), a clear comprehension of the way uncertainty propagates throughout the measurement system is needed, and an extensive control on both the hardware and software influences on the quoted propagation. Each image-based measurement system (IBMS) can be thought of as constituted by a digitalization interface (e.g., a digital video camera with appropriate computer interface) and
Manuscript received May 26, 1999; revised June 13, 2000. M. De Santo and A. Pietrosanto are with the Department of Information Engineering and Electric Engineering, University of Salerno, Fisciano, SA, 84084, Italy (e-mail:
[email protected];
[email protected]). C. Liguori is with the Department of Automation, Electromagnetic, Information Engineering and Industrial Mathematics, University of Cassino, Cassino 03043, Italy (e-mail:
[email protected]). Publisher Item Identifier S 0018-9456(00)07577-X.
a computer-based station which is built with some specialized hardware (e.g., a personal computer hosting a DSP-based board) and software modules, often “hand-made” by the designer of the system. It is easy to understand that characterization of uncertainty in such a system can be decomposed in the following steps: Step 1) modeling the uncertainty of the intensity function that reaches the digitalization device (the camera); Step 2) modeling the digitalization process (frame grabbing); Step 3) determining the uncertainty characterizing results of image processing algorithms. Referring to the above-defined steps, some work has been done in the past years. Let now us present some results previously achieved in the literature. Dorst and Smeulders [2] analyzed the loss of accuracy in digitized straight lines coming from quantization. Their results give a quantitative idea of damages coming from one of the steps implied from digitalization but are of limited usefulness when leaving the straight line world. A milestone in the study of the effects of digitalization was posed by Havelock [3], [4], with the introduction of the idea of locales, which are broadly applicable to the estimation of the position and shape of objects, although their use is shown only for binary images. A further step toward a correct characterization of digitalization error was made by Kamgar-Parsi [5], who introduced a mathematical tool for the estimation of the average error due to quantization. Nevertheless, their analytical analysis does not take into account a sufficiently detailed number of factors to be useful for a practical application in evaluating the uncertainty of images. Ho [6] highlighted the importance of introducing analytical models to describe the system behavior and enumerated a number of error causes that affect image precision, while a very interesting and recent work by Sarkar et al. [7] introduced the use of modulo-grid diagrams to determine the probability density function associated with a pattern once specific sensor parameters are given. In any case, an exhaustive analysis of all the influence parameters still has to be carried out. A significant contribution is provided by Nalwa and Binford [8], who studied the effect of the characteristic of point spread function of the sensor in detecting edges and showed the limitation implied from it. A good and detailed analysis of error sources in inspection systems has been done by Griffin and Villalobos [9], by Kakarala and Hero [10], and more recently by Yang and Marefat [11]. However, general approaches to the analytical treatment of uncertainty characterizing image- processing algorithms are difficult to be deduced. Close to this aim
0018–9456/00$10.00 © 2000 IEEE
Authorized licensed use limited to: IEEE Xplore. Downloaded on October 9, 2008 at 13:43 from IEEE Xplore. Restrictions apply.
1102
IEEE TRANSACTIONS ON INSTRUMENTATION AND MEASUREMENT, VOL. 49, NO. 5, OCTOBER 2000
are Haralick et al. [12], [13], who proposed a method to evaluate performance of edge detectors, and investigate the way in which the errors related with such algorithms propagate in measurements of distances between edge points on straight lines and circles. In their works, no contributions are given about the application of the method to different measurements and no analytical expressions of the uncertainty of edge points are provided. To the best of our knowledge, it appears that the main results were obtained in modeling the digitalization process while a deep comprehension about the real-world description (Step a) and about the intra-system propagation (Step c) seems yet to be achieved. Concerning the last step, let us outline that the uncertainty of the results computed by a given image processing software has to be characterized in an analytical way, in order to avoid the need for complex experimental procedures often introducing unaffordable costs. Moreover, the experimental characterization of uncertainty can be unobtainable in practice, when the measurement system has an highly variable software part. Starting from the previous considerations and on the basis of their experiences in the field of the uncertainty analysis [14]–[16], in the present paper the authors analyze the problem of defining the uncertainty of pixels which belong to a digital image, and they face the problem of determining an analytical relation between uncertainty and the parameters which influence the digitalization process. Then, a general method is presented to analytically define the uncertainty propagation in a software module, once the uncertainty of the pixels of the input image is given. Finally, the proposed method is applied to a very common edge detector such as the Canny operator, and validated by means of experimental tests.
1) the image quantization from the real-continuous-world to the computer-discrete-world; 2) the presence of vibrations; and 3) the intrinsic variability of the light source (unstableness, flickering, etc.). Let us briefly discuss the above-mentioned causes. • Both spatial and intensity quantizations have to be considered. The former gives a contribution to uncertainty which is proportional for each pixel to the gradient of intensity and depends on the sensor spatial resolution (pixel width and pixel height). The latter gives a contribution which is constant for each pixel like the floor in spectral analysis and depends on the number of bits used by the A/D converter (number of levels in the gray scale). • Vibrations should concur with intensity quantization to determine the “floor” amplitude. • The higher is the pixel intensity, the more significant are the effects of light intrinsic variability. This implies the presence of a term which is proportional to in the analytical expression of the uncertainty. Starting from the above considerations and taking into account the ISO GUM indications concerning the combination of uncertainty, the authors formulated the following analytical exin real inpression of a model of the pixel uncertainty dustrial conditions
(1) where
II. ANALYTICAL EXPRESSION OF THE IMAGE DIGITALIZATION UNCERTAINTY Many contributions are available in literature concerning the definition of the parameters which influence the whole process leading to the digital representation of images [7], [17]. Since it is beyond the scope of the present work to present a general and accurate model of the image digitalization process, the following discussion will be constrained in the field of the morphological characterization of objects in an industrial process related with opaque matters (e.g., gaskets). In this framework, the validity of the following hypotheses can be assumed: • The characterization is based on measurements which are independent from the position of the measured object in the space (i.e., it will be possible to use an intrinsic coordinate system located on the measured object). • The object surface shows no specularity. These hypotheses allow defining the uncertainty of an image as the parameter which quantifies the random pixel of the pixel itself. Uncertainty changes of the intensity of a set of can be measured as the standard deviation samples , obtained by consecutive acquisitions of the image in stationary conditions of all the controllable parameters of influence. Given those assumptions, three major causes still influence the above-defined uncertainty:
; , with and standard deviations of triangular (pixel distributions defined in (pixel height), respecwidth), and tively; correlation factor, which ; ; constant for a given image and in particular where is the standard deviation due to vibrations and is the number of grey levels. , , and are constant weights depending on the image characteristics. To explore this dependence, many experimental tests have been carried out in real industrial conditions. Several images were acquired with significant differences in terms of direction and intensity of light, contrast, background, shape, and roughness of the surfaces of measured objects. For each condition, acquisitions were carried out, and the was measured for each pixel as the stanuncertainty dard deviation of intensity . Then, the best fitting values of the constant weights in (1) were calculated by minimizing the quantity shown at the bottom of the next page. For example, Figs. 1(a) and 2(a) show two images characterized by different shape, contrast, background, surface characteristics, and kind of edges. The measured uncertainty [
Authorized licensed use limited to: IEEE Xplore. Downloaded on October 9, 2008 at 13:43 from IEEE Xplore. Restrictions apply.
DE SANTO et al.: UNCERTAINTY CHARACTERIZATION IN IMAGE-BASED MEASUREMENTS
Fig. 1. (a) Acquired image and (b) image pixel uncertainty U for a given row, measured (solid) expected (dashed), with K = 1:7 10 , C = 4 10 , K = 1:3 10 , U = 0:8.
0 1
1
01
solid line] and the best fitting calculated uncertainty [ line] dashed of th row pixels are reported in Fig. 1(b) for the image of Fig. 1(a) and in Fig. 2(b) for the image of Fig. 2(a). The quoted figures show how the above-described quantities are in good agreement. The same agreement has been observed in all the other rows which have not been reported for the sake of brevity. , , and , which realize By analyzing the values of the same best fitting in all the other experimented images and measurement conditions, the following conclusions have been drawn. It can be kept constant to the value of ; only in the case of low-contrast images, it has to be reduced to a 50% value. It depends on the image shape but it is usually con. strained within It assumes very low values in high-contrast images, . otherwise it does not exceed Using an 8-b ADC and in absence of significant vibrations its best fitting value is about 0.5. but it increases in low-contrast images (i.e., in case of the rough surranging from 127 to faces) until 3.0; this means 750.
1103
Fig. 2. (a) Acquired image and (b) image pixel uncertainty U for a given row, measured (solid) expected (dashed), with K = 1:6e , C = 3e , K = 0 :4 e , U = 0 :7 .
0
However, the sensitivity of these weights is not high; consequently, once typical values have been found they may be kept invariant with images, without substantially reducing the validity of the model. The presented analytical model allows the uncertainty of to be estimated and the single contriimage pixels bution of each influence parameter to be extracted without the need of multiple acquisitions and statistical elaboration which would otherwise be indispensable for the experimental evaluation. III. METHOD FOR THE UNCERTAINTY ANALYSIS IN IMAGE PROCESSING ALGORITHS Two different approaches can be followed when testing the output of Image Processing Software (IPS): either “black box” or “white box.” In the former approach the output uncertainty is directly measured without either the necessity or the possibility of enumerating analytical relationships with influence parameters. The latter approach guarantees the higher level of quantitative control and consists of the study of uncertainty propagation through the analytical relationships implemented by the algorithms. Obviously, it can be followed only in the case of systems where algorithms and source code are available; this assumption
Authorized licensed use limited to: IEEE Xplore. Downloaded on October 9, 2008 at 13:43 from IEEE Xplore. Restrictions apply.
1104
IEEE TRANSACTIONS ON INSTRUMENTATION AND MEASUREMENT, VOL. 49, NO. 5, OCTOBER 2000
cannot be considered a limiting constraint when one takes into account the large number of custom IPS, ad hoc realized for this kind of application. From authors’ point of view, it is very important to define a general method for analytically modeling the causes and the effects of uncertainty in IBMS [16], and consequently, the following three-step approach is proposed: 1) Theoretical analysis: Once a given and known uncertainty on the input image is assumed, an analytical expression of the output uncertainty is obtained by applying the uncertainty propagation law suggested by the ISO GUM [18] to the numerical relationships implemented by the algorithm. Then, if an analytical model of the image digitalization process is also available, the obtained analytical expressions allow the uncertainty to be analytically estimated for different hardware configurations (i.e., camera resolution and number of gray levels), influence parameter (i.e., lighting and vibration), and software operating conditions. 2) Numerical verification: This phase of the method allows the theoretical approach to be verified as far as the application of the propagation law and the considered correlation among quantities is concerned. Numerical verification is carried out by running the ISP algorithm on the data sets obtained by the analytical model of the image digitalization system affected by all the sources of uncertainty taken into account in the theoretical analysis. The standard deviation of the simulated outputs gives an estimation of the uncertainty, which can be compared with the results of step a) to verify the theoretical assumptions. Obviously, this verification will be carried out only on a selected number rather than on all the possible configurations (as a typical black-box approach would require). 3) Experimental validation: This phase has the only aim to validate the image digitalization system model previously adopted; its results are strictly dependent on the hardware used. It is carried out by running the ISP algorithm on suitable sets of images; the IPS output uncertainty is evaluated as the standard deviation of the IPS output obtained in successive image acquisitions. The experimental plan does not need to be exhaustive, but can be reduced only to the verification of some values and trends.
can be identified: 1) calculation of the norm of the gradient, and 2) search of the local maxima. Consequently, the uncertainty propagation has to be evaluated in both phases. 1) The gradient of the image is calculated through the of a convolution between the derivative along and the image itself. Gaussian filter Given and we obtain (2) In practice, each element of matrices lated as
is calcu-
(3)
(4) and represent the number of columns and where rows of the matrix , respectively; and matrices and depend on the standard deviation of the Gaussian filter and on its dimension. Applying to (2)–(4) the statistical method for the combined uncertainty evaluation proposed by ISO GUM [18], and considering independent one from each other (no correlation is supposed) the uncertainties on all pixels, we obtain the final combined uncertainty of matrix elements as follows:
(5) where
(6)
IV. CANNY EDGE OPERATOR: THEORETICAL ANALYSIS OF UNCERTAINTY PROPAGATION Edge detection has been chosen to illustrate the proposed approach since it is perhaps the most ubiquitous step in lowlevel image processing. Among the different proposed methods, Canny’s algorithm has been chosen for three main reasons: it is a good example of an algorithm based on a rigorous mathematical approach, it is often used in the scientific community and, finally, it has been largely analyzed from the point of view of performances [19]. Leaving to specific literature [20] the accurate description of the algorithm, some details have to be reported. The Canny operof ator finds edges by looking for local maxima of the norm the gradient of the image ; as a consequence two main phases
and
(7)
(8) 2) Local maxima (related to nine pixel zones) are isolated by a no-maximum suppression algorithm. For each in , the algorithm investigates the gradient compoand in each of the four quadrant nents directions, in order to find a maximum (Fig. 3). The algowhere all the no-maximum rithm provides a matrix
Authorized licensed use limited to: IEEE Xplore. Downloaded on October 9, 2008 at 13:43 from IEEE Xplore. Restrictions apply.
DE SANTO et al.: UNCERTAINTY CHARACTERIZATION IN IMAGE-BASED MEASUREMENTS
1105
Fig. 3. Schematic diagram of the no-maximum suppression algorithm.
pixels are zeroed. The algorithm decides if a pixel must be suppressed or not by means of a sequence of logic tests which are based on comparisons among the components of the gradients of contiguous pixels. Of course, the final result of this sequence of comparisons is not determinand matrix eleistic due to the uncertainty of , , , and ments. As a consequence, once are known, for each element the probof being an edge can be evaluated as the ability probability that the algorithm follows one of the four independent paths which are present in its flux diagram. Each path is in turn made of three steps, each one consisting of the result of a logic test carried out on a condition such . The probability as the following: of truth of such a condition is evaluated by considering [and in other cases] as normal random variables having a mean equal to the measured value and a standard deviation equal to the uncertainty. Finally, the probability associated at each path is given as the product of the probabilities of all the three steps. So, the is an edge point probability that a pixel of coordinates can be obtained as the sum of the probability values associated at each path driving to the detection.
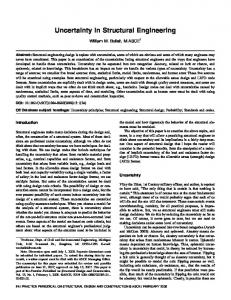
Fig. 4. (a) Hexagon, for the 12th row; (b) the percentage relative uncertainty u %; and (c) P versus the column index, measured (solid) expected (dashed).
V. NUMERICAL VERIFICATION AND EXPERIMENTAL VALIDATION As previously discussed, numerical verification consists of comparing the results of theoretical analysis with results of a numerical simulation. To this aim a set of images is generated starting from a reference noiseless image . Each is obtained by means of a random pixel of the th image , and standard devifunction with mean value equal to [ is the pixel uncertainty proation equal to vided by the aforementioned analytical model]. Then, the and matrices are obtained for each th image of the set and matrices are obby the Canny operator. Finally, the is equal to the standard deviation of the eletained: , and is equal to the ratio ments that are not zero and . between the number of
Fig. 5. (a) Circle, for the 12th row; (b) the percentage relative uncertainty u %; and (c) P versus the column index, measured (solid) expected (dashed).
and can now be compared with their equivalent obtained by the theoretical analysis. The above-mentioned verification has been carried out on two reference images, an hexagon and a circle [see Figs. 4(a) spatial resoluand 5(a)] which are both characterized by: tion, 8 b intensity resolution, two color images ( for the back-
Authorized licensed use limited to: IEEE Xplore. Downloaded on October 9, 2008 at 13:43 from IEEE Xplore. Restrictions apply.
1106
IEEE TRANSACTIONS ON INSTRUMENTATION AND MEASUREMENT, VOL. 49, NO. 5, OCTOBER 2000
cerning one row are characterized by the same degree of agreement of the other rows. VI. CONCLUSIONS A method for the application of the white box approach to the metrological characterization of image processing algorithms has been presented and applied to the Canny edge detector. Namely, an analytical expression of Canny operator output uncertainty is given that avoids the need for burdensome exhaustive sets of experimental tests. This theoretical analysis of the edge detector, extended to the no-maximum suppression algorithm, has led to a statistical treatment of the uncertainty of the edge detection process. Both numerical verification and experimental validation fully agree with the theoretical results, showing the significant influence of the digitalization uncertainty on the repeatability of the edge detection process. Further efforts will be driven to enumerate the analytical relationship and the uncertainty of the morbetween the probability phological measurements made using edge points. ACKNOWLEDGMENT The authors wish to thank Dr. T. Ferrarese and Dr. S. Amico for the help given in the experimental work. Fig. 6. (a) Canny algorithm output for image 2; for the 200th row; (b) the percentage relative uncertainty u %; and (c) P , versus the column index, measured (solid) expected (dashed).
ground, and for the object). Tests have been conducted for and and with using Matlab. different values of Figs. 4(b) and 5(b) report the percentage relative uncertainty , while Figs. 4(c) and 5(c) evaluated in tests with show the probability and for Fig. 4, and and for Fig. 5. Percentage relative % rather than absolute uncertainty is reported because and are not constrained in the 8-b gray scale. In each case an excellent agreement between theoretical (dashed) and simulation (solid) results is shown, thus confirming the correctness of the analytical formulation. Moreover, it can be noted that for the chosen image characteristics (shape, contrast, and noise) the always inachieved results highlight that the uncertainty on fluences the no-maximum suppression algorithm only in relation to the few pixels where the step edge is consistent. After the numerical verification, an experimental validation of the theoretical analysis was carried out to confirm the accuracy of the adopted uncertainty model. The same steps of the numerical verification were followed except the image generation. is obtained In this case, in fact, the set of images through camera acquisitions of the same image, all performed in the same external conditions. For the sake of brevity, only results concerning the object of Fig. 2(a) are reported. Fig. 6(a) of the no-maximum suppression algoshows the output rithm. Both the calculated values (dashed) and the measured % and of prove to be values (solid) of in good agreement in Fig. 6(b) and (c), respectively, thus confirming the consideration made on the numerical verification results. Finally, both numerical and experimental results con-
REFERENCES [1] R. Chelappa et al., “The past, present, and future of image and multidimensional signal processing,” IEEE Signal Processing Mag., vol. 15, no. 2, pp. 21–58, Mar. 1998. [2] L. Dorst and A. W. M. Smeulders, “Discrete representation of straight lines,” IEEE Trans. Pattern Anal. Machine Intell., vol. PAMI-6, pp. 450–462, July 1984. [3] D. I. Havelock, “Geometric precision in noise-free digital images,” IEEE Trans. Pattern Anal. Machine Intell., vol. 11, pp. 1065–1075, Oct. 1989. [4] , “The topology of locales and its effects on position uncertainty,” IEEE Trans. Pattern Anal. Machine Intell., vol. 13, pp. 380–386, April 1991. [5] B. Kamgar-Parsi and B. Kamgar-Parsi, “Evaluation of quantization error in computer vision,” IEEE Trans. Pattern Anal. Machine Intell., vol. 11, pp. 929–939, Sept. 1989. [6] C. Ho, “Precision of digital vision systems,” IEEE Trans. Pattern Anal. Machine Intell., vol. PAMI-5, pp. 593–601, Nov. 1983. [7] P. Sarkar, G. Nagy, J. Zhou, and D. Lopresti, “Spatial sampling of printed patterns,” IEEE Trans. Pattern Anal. Machine Intell., vol. 20, pp. 344–351, Mar. 1998. [8] V. S. Nalwa and T. O. Binford, “On detecting edges,” IEEE Trans. Pattern Anal. Machine Intell., vol. PAMI-8, pp. 699–714, Nov. 1986. [9] P. M. Griffin and J. R. Villalobos, “Process capability of automated visual inspection systems,” IEEE Trans. Syst., Man, Cybern., vol. 22, pp. 441–448, May 1992. [10] R. Kakarala and A. Hero, “On achievable accuracy in edge localization,” IEEE Trans. Pattern Anal. Machine Intell., vol. 14, pp. 777–781, July 1992. [11] C. C. Yang and M. M. Marefat, “Spatial quantization errors in active vision inspection,” in Proc. IEEE Int. Conf. Syst., Man, Cybern.,, vol. 1, San Antonio, TX, 1994, pp. 67–72. [12] S. Yi, R. M. Haralick, and L. G. Shapiro, “Error propagation in machine vision, machine vision and applications,” Mach. Vis. Applicat., vol. 7, pp. 93–114, 1994. [13] T. Kanungo, M. Y. Jaishima, J. Palmer, and R. M. Haralick, “A methodology for quantitative performance evaluation of detection algorithms,” IEEE Trans. Image Processing, vol. 4, pp. 1667–1673, Dec. 1995. [14] G. Betta, C. Liguori, and A. Pietrosanto, “Uncertainty analysis in digital signal processing algorithms,” in Proc. XIV IMEKO World Congress, vol. IV, Tampere, Finland, Giugno 1997, pp. 267–273. [15] , “Uncertainty analysis in fast Fourier transform algorithms,” in Atti del X IMEKO TC-4 ISDDMI’98, Napoli, Italy, Settembre 1998, pp. 747–752.
Authorized licensed use limited to: IEEE Xplore. Downloaded on October 9, 2008 at 13:43 from IEEE Xplore. Restrictions apply.
DE SANTO et al.: UNCERTAINTY CHARACTERIZATION IN IMAGE-BASED MEASUREMENTS
[16]
1107
, “A structured approach to estimate the measurement uncertainty in digital signal processing algorithms,” in IEE Proc. Sci. Meas. Technol., vol. 146, Jan. 1999, pp. 21–26. G. J. Klinker, S. A. Shafer, and T. Kanade, “A physical approach to color image understanding,” Int. J. Comput. Vis., vol. 4, pp. 7–38, 1990. “ISO guide to the expression of uncertainty in measurement (GUM),”, 1993. H. D. Tagare and R. J. P. deFigueiredo, “On the localization performances measure and optimal edge detection,” IEEE Trans. Pattern Anal. Machine Intell., vol. PAMI-12, pp. 1186–1190, Dec. 1986. J. Canny, “A computational approach to edge detection,” IEEE Trans. Pattern Anal. Machine Intell., vol. PAMI-8, pp. 679–698, Nov. 1986.
Consolatina Liguori (M’99) was born in Solofra (AV), Italy, in 1969. She received the M.S. degree in electronic engineering from the University of Salerno, Fisciano, Italy, in 1993, and the Ph.D. degree in industrial engineering from the University of Cassino, Cassino, Italy, in 1997. Since 1997, she has been Assistant Professor of electrical and electronic measurements at the University of Cassino. Her current research interests are concerned with digital signal processing, software characterization, measurements based on image processing, and measurement systems for fault detection and diagnosis.
Massimo De Santo (M’96) graduated in electronic engineering and received the Ph.D. degree in computer science from the University of Napoli, Napoli, Italy. Since 1993, he has been a Senior Researcher and Assistant Professor in the Department of Information Technology and Electric Engineering of the University of Salerno, Fisciano, Italy, where he is member of the Artificial Vision Research Group. Since 1985, he has been active in the field of computer networks, image processing, and pattern recognition. He is author of more then 60 research works. He is Scientific Coordinator of several research projects funded by the Italian Ministry of University and by European Community. His main present research interests concern distributed multimedia application for education and image compression for multimedia. Dr. De Santo is a Member of the ACM.
Antonio Pietrosanto (M’99) was born in Napoli, Italy, in 1961. He received the M.S. and Ph.D. degrees in electrical engineering from the University of Napoli in 1986 and 1990, respectively. In 1991, he became Assistant Professor of electrical and electronic measurements at the University of Salerno, Fisciano, Italy, where he has been Associate Professor of electrical and electronic measurements since 1999. He is principally concerned with research into instrument fault detection and isolation, digital signal processing software characterization, sensor realization and characterization, and VXI-based instruments.
[17] [18] [19] [20]
Authorized licensed use limited to: IEEE Xplore. Downloaded on October 9, 2008 at 13:43 from IEEE Xplore. Restrictions apply.