11th International Conference on Urban Drainage, Edinburgh, Scotland, UK, 2008
Uncertainty in deterministic predictions of flow quality modelling and receiving water impact A.N.A. Schellart1*, S.J. Tait2, R.M. Ashley1, D. Farrar3, D. Hanson3 1
Pennine Water Group, Department of Civil & Structural Engineering, University of Sheffield, Mappin Street, Sheffield, S1 3JD, UK.
[email protected],
[email protected] 2 Pennine Water Group, School of Engineering Design and Technology, University of Bradford, Bradford, BD7 1DP, UK. 3 Yorkshire Water Services, Western House, Halifax Road, Bradford, BD6 2LZ, UK *Corresponding author, e-mail
[email protected]
ABSTRACT If a river in the UK is suspected by the Environment Agency (EA) to fail water quality standards, water companies have to prove compliance with these standards to the EA. This is currently done through deterministic Integrated Catchment Modelling (ICM) studies. A common aspect of many hydrological and water quality relationships incorporated within these integrated catchment model components is that they were empirically calibrated, often using limited data from a very small number of catchments. There can thus be a significant level of uncertainty associated with model calibration parameters, or the default values used as input data in the modelling software. This paper describes a case study where the levels of uncertainty in the prediction of the number of failures of water quality standards have been quantified, based on a systematic study of the levels of uncertainties associated with the model input and model parameters in models used in an ICM study. This method determined the range in the number of predicted failures caused by uncertainties in the numerical tools currently used in ICM studies in the UK.
KEYWORDS Uncertainty, flow quality modelling, response database, sewer emissions, receiving water impact
INTRODUCTION Increasingly complex environmental regulations, such as the Freshwater Fish Directive and the EC Water Framework Directive, have created a legal requirement for sewer operators in Europe to predict the flow quality as well as quantity of sewer system releases. In the UK, sewer systems are managed and maintained by water companies, which themselves are regulated by the Office for Water Regulation (OFWAT) and the Environment Agency (EA). Hydrodynamic sewer flow quality and quantity modelling studies are currently accepted by the EA as ‘evidence’ of whether or not the sewer system is the cause of a receiving water body not meeting environmental standards. These models are furthermore accepted as tools that can be used to design measures to improve the quality of receiving water bodies and model predictions can therefore have significant financial impacts. In the UK, the Urban Pollution Management (UPM) Manual (FWR, 1998) procedure is considered best practice. In the Manual, UPM is defined as: ‘the management of wastewater discharges from sewerage and sewerage treatment systems under wet weather conditions such that the requirements of
Schellart et al.
1
11th International Conference on Urban Drainage, Edinburgh, Scotland, UK, 2008 the receiving water are met in a cost-effective way’. A key aspect of a UPM study is the application of simulation modelling tools, the types of models that may be employed are: rainfall models, sewer flow quantity and quality models, sewerage treatment models, receiving water impact models and integrated urban pollution models. In the UK, water companies and their consultants mainly use Infoworks CS as sewer flow quantity and quality modelling tool. A common aspect of the hydrological and water quality relationships incorporated in Infoworks CS is that they were empirically calibrated, often using limited data from a small number of catchments (Bujon and Herremans, 1990; Packman 1990), or using data from non-sewer environments (i.e. Ackers, 1984). Previous use of some of these relationships has resulted in poor model predictive performance De Sutter (2003), Ashley et al., (2004). The aim of this study was to quantify levels of uncertainty within Infoworks CS relationships, based on their original calibration and input parameter boundaries, and then to use this information to estimate the overall level of uncertainty of the number of water quality failures A case study has been carried out for a UK water company, predicting levels of uncertainty in the modelled number of failures of the Fundamental Intermittent Discharges (FIS), (FWR, 1998). An existing Integrated Catchment Model (ICM), consisting of an upstream river flow quantity simulation model, a sewer flow quantity and quality simulation model and a river impact analysis model has been used for this case study. The levels of uncertainty in the prediction of the number of failures of water quality standards have been quantified, based on a study of the uncertainty associated with the model input and model parameters used in the modelling procedure. The uncertainty analysis was carried out by Monte Carlo simulations over a response database. The statistical techniques that were used can clearly quantify uncertainty boundaries for this case study but also for other ICM studies.
INTRODUCTION TO CASE STUDY The case study area consists of a combined sewer system (draining 294 ha and serving approx. 11,000 inhabitants), with one Waste water Treatment Works (WwTW) and 5 combined sewer overflows (CSO’s), all entering the same river. An ICM study had been carried out in order to check compliance with the Fundamental Intermittent Standards (FIS, described in the UPM manual; FWR, 1998). The FIS comprise of sets of DO and un-ionised ammonia concentrations for cyprinid or salmonid fishery waters, for 1, 6, and 24 hour periods, that should not be exceeded for return periods of 1 month, 3 months and 12 months respectively. In the original case study, the number of failures of the 1-hour and 6-hour cyprinid standards was calculated for the summer months of a 10-year period of future rainfall. The following models had been used during this ICM study: for the upstream river boundary flow quantity the MIKE NAM component was used, for quantity and quality of combined sewer overflow emissions and quantity of WwTW effluent Infoworks CS was used, and for the assessment of the impact on the receiving water downstream of the WwTW and CSO’s a river impact assessment tool was used River Impact and Optimisation Tool, (an MWH UK Ltd. in-house software tool, based on UPM2 standards and methodology, FWR, 1998). A 10-year future rainfall series had been derived using STORMPAC, and upstream river boundary quality data were supplied by the Environment Agency (EA). WwTW effluent quality was not modelled separately, but a series of effluent quality samples had been taken in order to estimate the WwTW effluent quality for the ICM study.
2
Uncertainty in deterministic flow quality modelling and receiving water impact
11th International Conference on Urban Drainage, Edinburgh, Scotland, UK, 2008
METHOD A literature study has been carried out in order to find out what potential uncertainties can be associated with the equations incorporated in Infoworks CS. Based on this information, the sub-models expected to have most uncertainty associated with them have been short listed and uncertainty bands have been derived for the model parameters and model inputs involved. A sensitivity study was then undertaken, by varying these uncertain model parameters and inputs systematically, and checking their effect on the amount of pollutants spilled from the case study network. Based on the most sensitivity model parameters and inputs overall levels of uncertainty in the predicted number of FIS failures have been calculated by using Monte Carlo simulations over a ‘response database’.
LITERATURE REVIEW The development and original calibration of the surface sediment potency factor equations, the New UK surface runoff model and the sediment transport model incorporated in Infoworks CS are briefly described in this paper. The hydraulic roughness, the surface sediment build-up equation, the gully pot equation and the domestic waste water flow pollutant profile were also studied, but happened to be less sensitivity for this particular case study and pollutants, they are therefore not described here. Surface sediment potency factors. Infoworks CS assumes that pollutants such as BOD, COD and TKN can be attached to catchment surface sediment and can enter the sewer system via surface sediment wash-off. The ratio between the pollutant and the amount of solids washed off the surface is defined by potency factors, which are assumed to be dependent on the rainfall intensity. Information on the development of the potency factor equations used in Infoworks CS has been described by Bujon and Herremans (1990). The potency factor equations were originally derived for the model FLUPOL from data collected in two French catchments. These equations were incorporated in Hydroworks and are still used in Infoworks CS (v 6.5), the general potency factor equation is:
K pn = C1 (IMKP − C2 ) 3 +C 4 C
Equation 1
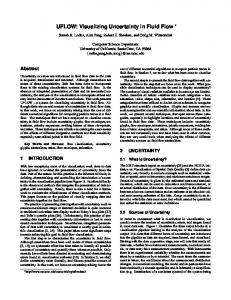
Where: IMKP = maximum rainfall intensity over a 5-min period in mm/hr, and C1, C2, C3 and C4 are coefficients. Figure 1 shows an example of the original data of measured potency factors for BOD5 attached to TSS, together with both functions derived for the potency factors as used in Infoworks (‘bod_std’ and ‘bod_mix’, depending on the type of catchment area, Infoworks CS help, Wallingford Software). BOD5 is shown here only, as COD and TKN are not taken into account when following the UPM analysis procedure. It is clear that there is significant uncertainty, particularly at low values of rainfall intensity. The potency factor equations for BOD5 are: K pn BODstd = 0.28(IMKP )
−0.572
Equation 2
K pn BODmixe = 0.17 (IMKP − 0.9 )
−0.572
Schellart et al.
+ 0.05
Equation 3
3
11th International Conference on Urban Drainage, Edinburgh, Scotland, UK, 2008
0.3 Potency factor BOD (Kpn)
Kpn BOD5 std 0.25
Kpn BOD5 mixe Maurepas measured data
0.2
Fresnes Choisy measured data 0.15 0.1 0.05 0 0
10
20
30
40
50
60
70
IMKP (or Imax5, maximum rainfall intensity over 5 minutes) (mm/hr)
Figure 1. Surface sediment potency factor equations for BOD, after Bujon and Herremans (1990). New UK surface runoff volume model. Packman (1990) describes the original calibration of the New UK percentage runoff equation (Eqn. 4), which is currently incorporated in Infoworks CS (v. 6.5), as part of the Wallingford Procedure for calculating rainfall runoff (Osborne, 2002).
PR = IF * PIMP + (100 − IF * PIMP) *
NAPI PF
Equation 4
Where: PR = Percentage Runoff, IF = Effective impervious area factor (derived from the fixed runoff coefficients), PIMP = Percentage of impermeability (derived from the amount of impermeable surface area), PF = moisture depth parameter (mm). The moisture depth parameter (PF) had been used for calibrating the equation, leading to PF = 200 mm still being used as the Infoworks CS default value. When studying the original calibration described in Packman (1990), the nine different catchments used in the study indicated that the PF optimised for each individual catchment could be between 96 mm and 541 mm. Concerns were expressed by Packman (1990) about the transferability of the results, as all nine catchments used were relatively small (between 0.6 ha and 11 ha, 1 catchment of 142 ha), and one catchment was a paved yard of a government training centre, subject to random building activity. Sediment transport model. By default, Infoworks CS uses the Ackers-White sediment transport equation as described by Ackers et al. (1996). The bulk of the data used to derive the equations described in Ackers et al. (1996) are published in White (1972). The uncertainty in the original calibration of the Ackers-White equation is illustrated by Figure 2, White (1972). Figure 2 shows the percentage errors between 60 observed datasets used to calibrate the Ackers-White model, versus the sediment transport rates modelled with the calibrated Ackers-White equations. For some of the datasets, the difference between observed and modelled sediment transport rates can be over +1000% or under -100%.
4
Uncertainty in deterministic flow quality modelling and receiving water impact
11th International Conference on Urban Drainage, Edinburgh, Scotland, UK, 2008 As described in Bouteligier et al. (2002a and 2002b), the default values for representative suspended particle size and density (SF1) given by Infoworks are d50 = 0.04mm and s = 1.7, resulting in Dgr = 0.7 (Dgr is the dimensionless grain size). However, as described in AckersWhite (1973) and White (1972), the equations are only valid for 1