IEEE TRANSACTIONS ON POWER SYSTEMS, VOL. 30, NO. 6, NOVEMBER 2015
3053
Uncertainty Tracing of Distributed Generations via Complex Affine Arithmetic Based Unbalanced Three-Phase Power Flow Shouxiang Wang, Senior Member, IEEE, Liang Han, Student Member, IEEE, and Lei Wu, Senior Member, IEEE
Abstract—Variations of load demands and generations bring multiple uncertainties to power system operation. Under this situation, power flows become increasingly uncertain, especially when significant distributed generations (DGs), such as wind and solar, are integrated into power systems. In this paper, a Complex Affine arithmetic based unbalanced Three-phase Forward-Backward Sweep power flow model (CATFBS) is proposed to study the impacts of uncertainties in unbalanced three-phase distribution systems. An index of Relative Influence of Uncertain Variables on Outcomes (RIUVO) is proposed for quantifying the impacts of individual uncertain factors on power flows and bus voltages. The CATFBS method is tested on the modified IEEE 13-bus system and a modified 292-bus system. Numerical results show that the proposed method outperforms the Monte Carlo method for exploring the impacts of uncertainties on the operation of distribution systems. The proposed CATFBS method can be used by power system operators and planners to effectively monitor and control unbalanced distribution systems under various uncertainties.
Affine form current of phase ( , B, or C) on branch (A). Affine form power injection of phase ( , B, or C) at bus (kW). Affine form voltage of phase ( , B, or C) at bus (kV). Wind speed (m/s). Crisp scalar, or a degenerate interval Interval scalar.
.
Affine scalar. Central value of an affine variable. Partial deviation of an affine variable. Parameters and Functions: Weight coefficient of bus .
Set of buses that are directly connected to bus .
Cross-section through which the air mass is streaming ( ). Total array area ( ). Coefficient for modeling the operation temperature of solar panels, which usually takes the value around 0.03. Power coefficient.
Bus.
Tolerance error.
Line.
Solar radiation outside the atmosphere (
Set of real numbers.
Solar radiation on panels ( Cloud cover interval index.
Index Terms—Affine arithmetic, forward-backward sweep, unbalance power flow, uncertainty.
NOMENCLATURE Indices and Sets:
Variables: Noisy symbol that lies in the interval Affine form current injection of phase ( or C) at bus (A).
).
Air density ( ). Photoelectric conversion efficiency of a PV array (%). Ambient air temperature ( ).
. , B,
Operation temperature of solar panels ( Manuscript received March 25, 2014; revised July 30, 2014 and October 07, 2014; accepted November 19, 2014. Date of publication December 18, 2014; date of current version August 03, 2015. This work was supported in part by National Natural Science Foundation of China (NSFC 51361135704, 51377115) and National Basic Research Program of China (2013CB228203) and Program for New Century Excellent Talents in University (NCET-07-0602). Paper no. TPWRS-00317-2014. S. Wang and L. Han are with the Key Laboratory of Smart Grid of Ministry of Education, Tianjin University, Tianjin 300072, China (e-mail: sxwang@tju. edu.cn). L. Wu is with the Electrical and Computer Engineering Department, Clarkson University, Potsdam, NY 13699 USA (e-mail:
[email protected]). Color versions of one or more of the figures in this paper are available online at http://ieeexplore.ieee.org. Digital Object Identifier 10.1109/TPWRS.2014.2377042
).
).
I. INTRODUCTION
T
HE needs for more flexible, efficient, and environmental friendly electric power systems have been pushing the research and development on smart grid. As an important part of smart grid, distributed generations (DGs) have been widely deployed in power systems. DGs have advantages of low investment costs, low power losses, environment friendly, and flexible operation [1], [2]. However, variability and intermittency of DGs, such as wind turbine generators and photovoltaic panels,
0885-8950 © 2014 IEEE. Translations and content mining are permitted for academic research only. Personal use is also permitted, but republication/ redistribution requires IEEE permission. See http://www.ieee.org/publications_standards/publications/rights/index.html for more information.
3054
have profound impacts on the security of power grid planning and operation [3]–[5]. Power flow analysis is a commonly used tool for investigating power distribution system planning and operation decisions. As uncertainties will be more significant with the increasing penetration of DGs, it is important to consider their impacts in power flow analysis. Various methodologies have been explored in literature for solving power flows with uncertainties. These methodologies fall into three main categories: probabilistic load flow (PLF), fuzzy power flow, and interval power flow. PLF [6], [7], first proposed in the early 1970s [8], is a well-received approach for dealing with uncertainties in power flow calculations. The accuracy of the PLF method depends on the preciseness of the presumed probabilistic distribution functions (PDFs) [9]. However, it is usually difficult for planners and operators to obtain precise PDF parameters for describing various uncertainties. Alternatively, fuzzy power flow [10] has been proposed to quantify the impacts of uncertainties on power flow solutions, which models uncertain data via fuzzy numbers and needs limited statistical information [11]. The interval arithmetic (IA) [12], [13] is another method for power flow calculation when statistical information is unavailable or insufficient. Various literatures have reported the interval power flow studies for power flow calculations for transmission [14] and distribution networks [15]–[18]. However, IA presents drawbacks including “dependency problem” and “wrapping effect”, which make bounds of power flow results much wider and unpractical. The conservative property in IA is one of the main issues when applied for the interval power flow calculation. In comparison, affine arithmetic (AA) could keep track on the dependencies of variables throughout the calculation procedure and limit the overestimation on the bounds of power flow results [19]. In [20], a new methodology was proposed for analyzing the reliable power flows based on AA, where uncertain variables were presented in affine forms. However, these methods [20], [21] transform the interval power flow problem into optimization problems. This transformation process would lose information regarding the interdependency of parameters. As a result, methods in [20] and [21] cannot trace the impacts of individual input uncertainties on outputs. Reference [22] demonstrated that the AA-based power flow method returns tighter bounds on power flow results than those obtained via IA and has a better computational performance. Reference [23] proposed an AA method to solve the optimal power flow (OPF) problem with uncertain generation sources. Reference [24] presented an algorithm based on AA for balanced three-phase radial distribution system power flow in the presence of uncertainties. However, when multiple DGs are connected to a distribution system, the above methods can only illustrate the overall effect of all DGs on power flow results, but not the impacts of individual DGs. Uncertainty analysis has a significant effect on many fields [25], including DG planning as well as optimal operation and control. Thus, studying the impacts of individual DGs is important, which could help determine the best locations for installing DGs. In addition, the above methods do not work for unbalanced power flow calculations, which is usually the case when multiple DGs are connected in distribution systems. The main contributions of this paper are twofold.
IEEE TRANSACTIONS ON POWER SYSTEMS, VOL. 30, NO. 6, NOVEMBER 2015
1) A Complex Affine arithmetic based unbalanced Three-phase Forward-Backward Sweep power flow method (CATFBS) is discussed for analyzing the impacts of uncertainties on distribution systems. 2) An index of RIUVO is proposed to quantitatively analyze the impacts of individual DGs on distribution power flow results. The rest of the paper is organized as follows. Section II describes the interval and affine arithmetic. In Section III, an affine form of DG output is proposed. Section IV presents the CATFBS method and RIUVO. The modified IEEE 13-bus case study and a modified 292-bus case study are discussed in Section V to test the proposed CATFBS algorithm and compare with the results from the Monte Carlo simulation based power flow. Finally, Section V summarizes the main conclusions. II. INTRODUCTION OF INTERVAL AND AFFINE ARITHMETIC A. Interval and Affine Arithmetic An interval number is defined as a compact set . IA is a general term for numerical methods that are used to produce intervals for bounding all possible outputs, when parameters in a system are not known exactly but expressed as interval numbers within certain ranges. and , Considering two interval numbers the elementary IA operations are given as (1)–(4) [13]: (1) (2) (3)
(4) One disadvantage of IA is that the solution may be too conservative. That is, the boundary results calculated by IA are often much larger than their actual ranges, especially after a long computational process. As compared to IA, AA keeps track on the correlations between input and output quantities, which could help reduce the likelihood of error explosion in a long IA computational process. In AA, a quantity is represented as an affine form (5). Considering two affine form quantities and , addition, subtraction, and multiplication of the two affine forms are given as (6)–(9) [26]: (5) (6) (7) (8)
(9)
WANG et al.: UNCERTAINTY TRACING OF DISTRIBUTED GENERATIONS
3055
If and are complex numbers, the real affine arithmetic can be extended to the complex space. Considering two complex affine quantities and , addition and subtraction operations of and follow the same rules in (6), and the multiplication is defined as (10), where and are the real and the imaginary approximation error partial deviations. More details on the complex affine arithmetic operators can be found in [27]:
(10) The affine form and the interval form of a quantity can be repconverted from one to the other. Given an interval resenting the quantity in IA, the corresponding affine form can be expressed as (10), where and . Given an affine form in (5), the corresponding in. It is noticed terval form is given as (11), where that although the conversion from the affine form to the interval form (11) is straightforward, all information regarding the correlations between input and output quantities are lost during the conversion, and the boundary results calculated by the IA are often much larger than those of the AA. For instance, considand ering (dependency exists between and due to ), AA derives the results and . However, in the IA, the results are [ , 4] and [ , 8]. Apparently, the results of the AA are much more compact and accurate than those of the IA: (11) (12) B. Impacts of Uncertain Variables on Outcome AA can keep track on the correlations between input and output variables, thereby is capable of recording the impacts of individual input uncertainties on the outputs along with the calculation procedure. For a system with independent uncertain , the output can be calculated in input variables (12), where is the extra error approximation term incurred during the AA calculation procedure:
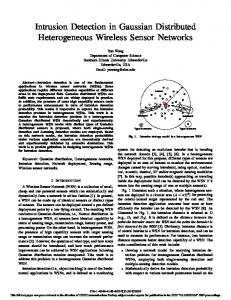
(13) Coefficients of individual input uncertainties represent their magnitude, which reflect their individual contributions to the output uncertainties. The index of Relative Influence of Uncertain Variables on Outcome (RIUVO) is defined in (13) for evaluating the impact of each input uncertainty to the uncertainty of : output , where (14)
Fig. 1. Relative influence of uncertain variables on output.
RIUVOs of the three input uncertainties and the error approximation term are 28% (i.e., 16/57), 42% (i.e., 24/57), 21% (i.e., 12/57), and 9% (i.e., 5/57), respectively. Fig. 1 visually shows the RIUVO of the three input uncertainties and the error approxhas the highest impact on imation term, which indicates that the uncertainty of output . III. AFFINE MODELING FOR DISTRIBUTED GENERATIONS A. Affine Model for PV Output Photovoltaic (PV) arrays can convert solar radiation into DC power and then into AC power via PV inverters. For a PV array, its maximum DC power output can be calculated via (15). In (15), the area of the PV array is fixed for a specific photovoltaic power generation system. In addition, PV inverters are usually operated in the maximum power point tracking (MPPT) mode with relatively constant power conversion efficiency . On the other hand, the operation temperature of solar panels and the solar radiation on panels are variant. Several factors, such as the ambient air temperature, the atmospheric pressure, and the wind speed, may impact the operation temperature of solar panels. The operation temperature of solar panels can be calculated via the ambient temperature in (16). Substituting (16) into (15), the output power of a PV array can be calculated in (17). Equation (17) shows that the power output of a photovoltaic cell is mainly determined by the solar radiation and the ambient temperature. The ambient temperatures may not change dramatically in a very short time period. Thus, the cloud cover is considered as the dominant uncertain factor that affects the PV output: (15) (16) (17) An interval cloud model is introduced to describe uncertainties of the cloud cover. The solar radiation effect on the panels can be calculated by the solar radiation outside the atmosphere and the corresponding cloud cover index as shown in (18) and Table I: (18)
The following example is used to illustrate the RIUVO. Con, where sidering the function , , and . Thus, based on . (6)–(9),
Given the interval cloud cover model in (17), the affine PV output model can be formulated via the following three steps: 1) Predict the next-day solar radiation outside the atmosphere at the photovoltaic location. Based on the weather forecast
3056
IEEE TRANSACTIONS ON POWER SYSTEMS, VOL. 30, NO. 6, NOVEMBER 2015
TABLE I CLOUD COVER INDEX
Fig. 3. Typical series components model of a distribution network.
IV. PROPOSED CATFBS POWER FLOW METHOD A. Distribution Power Flow Based on Affine Arithmetic
Fig. 2. Wind speed variety during one day.
and the solar radiation forecast, the solar radiation interval is calculated as via (18). 2) Evaluate the interval of the PV output using the photovoltaic power output function (17). 3) The affine form of the PV output is determined as (19) B. Affine Model for WTG Output Wind turbine generators (WTGs) can convert kinetic energy from wind into electricity. The mechanical power generated by the wind turbine can be calculated via (20):
Unlike transmission systems, distribution systems typically have radial topologies with high resistance/reactance ( ) ratio of lines, which makes the commonly used power flow methods, such as the fast decoupled Newton method, unsuitable for most distribution power flow problems. The Newton-Raphson method sometimes also fails to converge when used in distribution power flow calculation. Therefore, the forward-backward sweep method which could better handle the radial structure has been widely used in distribution power flow calculation. Fig. 3 shows a typical model of series components in a distribution network. Equation (22) describes the mathematical model of distribution transformers, and (23)–(24) describe the model of lines used in the paper, where , , , , , and are 3 3 matrices, which are determined by the connection topology of three-phase transformers and lines. Models for other system components can be found in [29]: (22)
(20) The real power injected into electric power systems by a WTG is mostly affected by wind speed. Fig. 2 shows a one-day wind speed profile of a wind farm located in Qingdao, China. It illustrates that wind speed varies drastically in a single day as shown in the black line. Because accurate forecast on instantaneous wind speed is difficult, average wind speeds for each 30 min are usually used to approximate wind power outputs as shown in the red curve. As the wind power is proportional to the cubic of wind speed, the wind speed forecast error will lead to considerable errors. To accurately quantify uncertainties of wind speed, an affine WTG output model is formulated as follows: 1) Predict the wind speed interval for the next day [28]. 2) The wind power output interval is calculated as via (20). 3) The affine form of the wind turbine output is represented as (21)
(23)
(24) In a power distribution system, net power injections, which are calculated as power supplies minus load demands, have uncertainties related to DGs. In this paper, net power injections are modeled by complex affine numbers as shown in (25): (25) The procedure of the proposed CATFBS method is similar to the traditional unbalanced three-phase forward-backward sweep power flow method [30], [31], which includes the following three steps. The flowchart of the proposed CATFBS method is shown in Fig. 4. 1) Nodal Current Calculation: First, we set initial threephase voltages at each bus, which usually can be set as nominal voltage values. Starting from the end bus, the complex affine
WANG et al.: UNCERTAINTY TRACING OF DISTRIBUTED GENERATIONS
3057
3) Forward Sweep: This step aims at updating nodal voltages. Starting from the root bus and moving towards the end bus, the downstream voltage can be calculated via (29), where and are 3 3 matrix, which are determined by the connection topology of three-phase transformers or lines [29]:
(29) The iterative procedure between the forward sweep 2 and the backward sweep 3 continues until voltage values in two successive iterations are close enough as determined via (30), where is the upper bound of , is the lower bound of , and is the iteration index, . is the node number of the distribution system, :
Fig. 4. Flowchart of the proposed CATFBS algorithm.
form of current injections in each phase at each bus can be calculated via (26):
(26) 2) Backward Sweep: This step aims at updating current values towards the root bus. Starting from the end bus and using the Kirchhoff's current law, the branch current can be calculated via (27). For each branch, the current injection can be calculated by (28), where and are 3 3 matrix, which are determined by the connection topology of three-phase transformers or lines [29]:
(27)
(30) In order to illustrate the effectiveness of the proposed method, a Monte Carlo method based stochastic three-phase power flow is used for comparison. Procedures of the Monte Carlo simulation based stochastic three-phase power flow are summarized as follows. 1) Generate random numbers using Mersenne twister [32] that follow the uniform distribution [0, 1], and use the inverse transform algorithm [33] to generate random DG power outputs following the uniform distribution, which yield a reliable solution intervals [20]. 2) Run the deterministic unbalanced three-phase forward-backward sweep power flow calculation using the DG power output samples obtained in Step 1. 3) Repeat Steps 1–2 for runs, and calculate the power flow statistics. is the total number of Monte Carlo samples, which is usually in the order of or higher for achieving an acceptable simulation accuracy. B. Impacts of DGs on Bus Voltages Weather conditions are volatile and uncertain in nature, which consequently induce power generation uncertainties from wind turbines and photovoltaic panels. Considering DGs connected to a -bus distribution power system, power outputs are expressed in affine forms ( ). Power injections in other buses are deterministic and are expressed as ( ). Bus voltages of each phase can be calculated via the CATFBS method. ( ) ( ) in (31): is a function of
(28) (31)
3058
IEEE TRANSACTIONS ON POWER SYSTEMS, VOL. 30, NO. 6, NOVEMBER 2015
Fig. 6. Wind speed profile. Fig. 5. One-line diagram of the modified IEEE 13-bus system.
According to (14), the RIUVO of DG at bus is calculated as (32). RIUVO can be used to evaluate the impacts of each DG on uncertainties of voltages on each phase at individual buses:
(32) When multiple DGs are connected to a distribution system, the total relative influence of uncertain variables on outcome (TRIUVO) can be used to quantify the impacts of individual DGs on the entire system as (33), where represents the slack bus, and is the real non-negative coefficient in the range of [0, 1], which is used to identify the importance of individual buses. For instance, indicates that bus is a key bus: (33)
V. SIMULATION RESULTS The proposed method is implemented using C++ on an Intel Core Q8400 CPU 2.66-GHz personal computer and is evaluated via the modified IEEE 13-bus system and a modified 292-bus system. A. IEEE 13-Bus System In this section, the modified IEEE 13-bus system is used to illustrate the effectiveness of the proposed CATFBS method. Since the original IEEE 13-bus system does not have renewable energy, the system is modified by adding one three-phase wind farm (DG2) with the installed capacity of 300 kW at bus 675, one three-phase photovoltaic panel (DG3) with the installed capacity of 400 kW at bus 684, and one photovoltaic panel (DG1) with the installed capacity of 200 kW to phase A at bus 634. The total load demands are kW kvar in phase A, kW kvar in phase B, and kW kvar in phase C. The one-line diagram of the modified IEEE 13-bus system is shown in Fig. 5.
Fig. 7. Solar radiation profile.
In order to illustrate the effectiveness of the proposed CATFBS method, the following three cases are studied. In all three cases, bus voltages obtained by the proposed CATFBS method, including real and imaginary part, are compared with those calculated via the Monte Carlo simulation. 1) Case 1: Assuming that bus 634 and bus 684 have the same weather condition. Thus, the output of DG1 and DG3 show the same uncertainty patterns. Wind speed at bus 675 and solar radiation follows the profiles shown in Figs. 6 and 7. Based on data in Figs. 6 and 7, at 11:00 am, the wind speed interval is [11.001, 11.567] m/s, and the solar radiation interval is [252, 308] kW . Thus, the corresponding power output intervals are [99, 121] kW at bus 634, [202.5, 245.5] kW at bus 675, and [210.6, 244.9] kW at bus 684. Thus, the affine forms of power outputs are , , and , respectively. 2) Case 2: The output of DG1 and DG2 are the same as those in Case 1, while the output of DG3 is , which represents more uncertainties than in Case 1. 3) Case 3: DG1 and DG3 are connected to the same buses as those in Case 1, while DG2 is connected to bus 680 instead of bus 675. The output of DG2 is the same as that in Case 1, i.e., . Fig. 8 shows the real component values of voltages obtained from the proposed CATFBS method and the Monte Carlo
WANG et al.: UNCERTAINTY TRACING OF DISTRIBUTED GENERATIONS
3059
TABLE II CPU TIMES FOR DIFFERENT METHODS IN CASE 1
Fig. 8. Voltage results by the proposed CATFBS method and the Monte Carlo (Case1). method with the sample size of
simulation for Case 1. As shown in Fig. 8, results from the Monte Carlo simulation are all within the uncertain intervals obtained from the CATFBS method. The upper and the lower bounds of Monte Carlo simulation are set as the minimum and the maximum values obtained in Monte Carlo simulation iterations. Thus, the intervals obtained from the proposed CATFBS method can fully reflect the impacts of DG uncertainties on power flow results. Affine arithmetic is able to keep track of dependency between operands and sub-formulae. As a result, the affine arithmetic derives more accurate results, i.e., tighter bounds on computed quantities, than those obtained via the interval arithmetic. Table II summarizes the CPU times for the CATFBS solution, the conventional deterministic power flow solution, and the Monte Carlo simulation. It shows that the CATFBS method is about 16 times faster (i.e., 0.43 s vs 7.22 s) than the Monte Carlo method with the sample size of . As the number of Monte Carlo samples increase, the CPU time for the Monte Carlo simulation would further increase. As shown in the last row of Table II, when the sample size is increased to , the CPU time is about 10 times higher than that of the sample size of . In comparison, the Monte Carlo method simulates uncertainties via multiple scenarios. However, it suffers from computational burdens because the accuracy of the Monte Carlo simulation relies on large sample sizes. On the other hand, the proposed CATFBS method has the advantage in terms of better computational performance for handling uncertainties. Moreover, the Monte Carlo method does not work well when probability distributions of uncertainties are unavailable or inaccurate due to inadequate statistical information, which is often the case in power industrial applications. In these situations, the CATFBS turns out to be a powerful and efficient method. The last row of Table II shows the iteration number of the conventional deterministic method and the proposed method. The CATFBS has shown good convergence characteristics, the iterations of which is even less than the deterministic one in some cases. For real-time operation of distribution systems, the interval results (bus voltage intervals) with the consideration of input uncertainties are useful but may be inadequate. Besides bus voltage uncertainties, system operators may also want to figure
Fig. 9. The A phase voltage RIUVOs of individual DGs (Case1).
out the contributions of individual DGs to the output uncertainty. By using CATFBS and the RIUVO, system operators can evaluate the impacts of individual DGs on uncertainties of bus voltages and, in turn, are able to determine proper regulation priorities. Figs. 9 and 10 show the voltage magnitude RIUVOs of phases A and B for individual DGs in Case 1, respectively. The RIUVO values are expressed in percentages. The buses where the DGs are connected to are mostly affected by DG uncertainties. As shown in Fig. 9, for phase A, the RIUVO of DG1 at bus 634 is 53.8%, DG2 at bus 675 is 54.9%, and DG3 at 684 is 37.4%. On the other hand, single-phase DGs mainly impact the phases where they are connected to. For instance, DG1 is connected to phase A, and the phase A RIUVOs of DG1 are all larger than those of phases B and C. RIUVO values derived from the proposed method can thus be used to compare the impacts of uncertainties of individual DGs. For instance, as shown in Fig. 9, voltage uncertainty of bus 671 is mainly induced by DG2, while DG3 has less impact and DG1 has the least impact. The value of RIUVO would reflect the relative influence of uncertain variables on output. From Fig. 9, it can be drawn that the uncertainty of DG1 has the largest impact on bus 634, the uncertainty of DG2 has the largest impact on bus 675, and the uncertainty of DG3 has the largest impact on buses 652, 611, and 684. Uncertainty levels of DGs and their locations will impact RIUVO values. As shown in Fig. 11, when the uncertainty of DG3 is increased in Case 2 while those for DG1 and DG2 are kept the same as in Case 1, the RIUVO value of DG3 becomes the largest. Thus, in Case 2, DG3 has the most impact on uncertainty among the three DGs. In Case 3, when DG2 is moved to bus 680 while all other inputs are kept the same as Case 1, the RIUVO value of DG3 becomes the largest. Thus, in Case 3, DG3 has the most impact on uncertainty among the three DGs,
3060
IEEE TRANSACTIONS ON POWER SYSTEMS, VOL. 30, NO. 6, NOVEMBER 2015
TABLE III TRIUVOS IN DIFFERENT CASES
Fig. 10. The B phase voltage RIUVOs of individual DGs (Case1).
Fig. 11. The A phase voltage RIUVOs of individual DGs (Case2).
Fig. 13. One-line diagram of the modified 292-bus system.
Fig. 12. The A phase voltage RIUVOs of individual DGs (Case3).
as shown in Fig. 12. Bus 680 is a better location for DG2 in the case that the system planer wants to shrink the impact of DG2 on uncertainty. Therefore, RIUVO can be used to evaluate the impacts of DGs uncertainties and determine the best locations for installing DGs. Table III reports the TRIUVO in all three cases with . In all three cases, TRIUVO of DG1 is the least in all three phases, which indicates that DG1 has the least impact on the entire system. In Case1, the uncertainty of the system is mainly caused by DG2 who has the largest TRIUVO; while in Case 2 and Case 3, DG3 has the greatest impact. Using TRIUVO values, system planners could explore the impacts of DG uncertainties on the entire system, and thereby select the optimal
planning scheme with the consideration of DG uncertainties. Furthermore, TRIUVO values can quantify the impacts of uncertainties and help system operators optimally control and effectively utilize DGs. In addition, TRIUVO values may be also valuable for the electricity market. The electricity market has the principle of “the one who uses the electricity must pay for it” [34]. With the development of smart grid, a similar principle, “the one who generate the uncertainty must pay for it”, could be considered which is quantified by TRIUVO. B. Modified 292-Bus System In this section, a modified 292-bus test system as part of NYSEG's distribution system in Elmira, NY is used to illustrate the effectiveness of the proposed CATFBS method. The one-line diagram of the modified 292-bus system is shown in Fig. 13. The 292-bus system is modified by adding 9 additional distributed generations with the capacity of 600 kW each. Locations of distributed generations are lists in Table IV. A 20% uncertainty on distributed generations is assumed.
WANG et al.: UNCERTAINTY TRACING OF DISTRIBUTED GENERATIONS
TABLE IV CPU TIMES FOR DIFFERENT METHODS IN CASE 1
3061
monitoring. As shown in Fig. 15, the RIUVO value of DG4 on Bus-90 is the largest. As a result, Bus-90 is most affected by DG4. Based on the same principles, Bus-125 is most affected by DG5, Bus-187 is most affected by DG6, and Bus-180 is most affected by DG9. VI. CONCLUSIONS
Fig. 14. Voltage results by the proposed CATFBS method and the Monte Carlo (buses ). method with the sample size of
TABLE V CPU TIMES OF DIFFERENT METHODS
Fig. 15. The A phase voltage RIUVOs of individual DGs (modified 292-bus system).
Fig. 14 shows the real component values of voltages obtained from the proposed CATFBS method and the Monte Carlo simulation. As shown in Fig. 14, results from the Monte Carlo simulation are all within the uncertain intervals obtained from the CATFBS method. Table V summarizes the CPU times of different methods. It shows that the CATFBS method is much faster than the Monte Carlo method with the sample size of . Similarly, RIUVO can also evaluate the effect of each DG uncertainty on node voltage. Taking buses 90, 125, 197, and 280 as an example, assuming that these are key buses that need
This paper proposes a complex affine arithmetic based unbalanced three-phase power flow solution to explore the impacts of DG uncertainties on distribution systems. Based on the proposed method, the power flow solution bounds, i.e., the bounds of bus voltages, can be effectively obtained. The index of RIUVO is used to analyze the impacts of individual DG uncertainties on nodal voltages. The index of TRIUVO provides system decision makers an efficient way to analyze the impacts of individual DG uncertainties on the entire system. The proposed method is tested on the modified IEEE 13-bus system and a modified 292-bus system. Numerical results show that the proposed CATFBS method is well positioned for efficiently handling uncertainties as compared to the Monte Carlo simulation method. The CATFBS is useful in both planning and real-time operations of distribution systems when such decisions are subject to DG uncertainties. REFERENCES [1] W. El-Khattam and M. Salama, “Distributed generation technologies, definitions and benefits,” Elect. Power Syst. Res., vol. 71, pp. 119–128, 2004. [2] L. Mariam, M. Basu, and M. F. Conlon, “A review of existing micro grid architectures,” J. Eng., vol. 2013, pp. 1–8, 2013. [3] A. Losi and M. Russo, “Dispersed generation modeling for object oriented distribution load flow,” IEEE Trans. Power Del., vol. 20, no. 2, pp. 1532–1540, Apr. 2005. [4] Y. Zhu and K. Tomsovie, “Adaptive power flow method for distribution systems with dispersed generation,” IEEE Trans. Power Del., vol. 17, no. 3, pp. 822–827, Jul. 2002. [5] J. Huang, C. Jiang, and R. Xu, “A review on distributed energy resources and microGrid,” Renew. Sustain. Energy Rev., vol. 12, no. 9, pp. 2472–2483, Dec. 2008. [6] D. Villanueva, J. E. L. Pazos, and A. Feijoo, “Probabilistic load flow including wind power generation,” IEEE Trans. Power Syst., vol. 26, no. 3, pp. 1659–1667, Aug. 2011. [7] M. Aien, M. Fotuhi-Firuzabad, and F. Aminifar, “Probabilistic load flow in correlated uncertain environment using unscented transformation,” IEEE Trans. Power Syst., vol. 27, no. 4, pp. 2233–2241, Nov. 2012. [8] B. Borkowska, “Probabilistic load flow,” IEEE Trans. Power App. Syst., vol. PAS-93, no. 3, pp. 752–759, May 1974. [9] P. Chen, Z. B. Chen, and Cak-Jensen, “Probabilistic load flow: A review,” in Proc. 3rd Int. Conf. Electric utility Deregulation and Restructuring and Power Technologies (DRPT 2008), 2008. [10] V. Miranda and J. T. Saraiva, “Fuzzy modeling of power system optimal power flow,” IEEE Trans. Power Syst., vol. 7, no. 2, pp. 843–849, May 1992. [11] M. A. Matos and E. M. Gouveia, “The fuzzy power flow revisited,” IEEE Trans. Power Syst., vol. 23, no. 1, pp. 213–218, Feb. 2008. [12] G. Hargreaves, “Interval Analysis in MATLAB,” Master's thesis, Univ. Manchester, Manchester, U.K., 2002. [13] R. E. Moore, Methods and Applications of Interval Analysis. Philadelphia, PA, USA: SIAM, 1979. [14] Z. Wang and F. L. Alvarado, “Interval arithmetic in power flow analysis,” IEEE Trans. Power Syst., vol. 7, no. 3, pp. 1341–1349, Aug. 1992. [15] S. Wang, “Interval Methods for Distribution System Analysis,” Ph.D. dissertation, Tianjin Univ., Tianjin, China, 2001. [16] S. Wang, M. Chen, and C. Wang, “Interval power flow analysis with complex-fan representation for distribution networks,” in Proc. CICED 2006, Sep. 2006, pp. 116–122.
3062
[17] B. Das, “Radial distribution system power flow using interval arithmetic,” Int. J. Elect. Power Energy Syst., vol. 24, no. 10, pp. 827–836, Dec. 2002. [18] A. Dimitrovski and K. Tomsovic, “Uncertainty in load flow modeling: Application of the boundary load flow,” Autom. Elect. Power Syst., vol. 29, no. 16, pp. 6–15, Aug. 2005. [19] A. Piccolo, A. Vaccaro, and D. Villacci, “Thermal rating assessment of overhead lines by Affine Arithmetic,” Elect. Power Syst. Res., vol. 71, pp. 275–283, 2004. [20] A. Vaccaro, C. A. Canizares, and D. Villacci, “An affine arithmeticbased methodology for reliable power flow analysis in the presence of data uncertainty,” IEEE Trans. Power Syst., vol. 25, no. 2, pp. 624–632, May 2010. [21] J. Munoz, C. Canizares, K. Bhattacharya, and A. Vaccaro, “An affine arithmetic-based method for voltage stability assessment of power systems with intermittent generation sources,” IEEE Trans. Power Syst., vol. 28, no. 4, pp. 4475–4487, Nov. 2013. [22] M. Pirnia, C. A. Ca, N. Izares, and K. Bhattacharya, “An affine arithmetic method to solve the stochastic power flow problem based on a mixed complementarity formulation,” in Proc. PES 2012, 2012, pp. 1–7. [23] M. Pirnia, C. Canizares, K. Bhattacharya, and A. Vaccaro, “A novel affine arithmetic method to solve optimal power flow problems with uncertainties,” IEEE Trans. Power Syst., vol. 29, no. 4, pp. 2775–2783, Jul. 2014. [24] W. Gu, L. Luo, T. Ding, X. Meng, and W. Sheng, “An affine arithmetic-based algorithm for radial distribution system power flow with uncertainties,” Int. J. Elect. Power Energy Syst., vol. 58, pp. 242–245, 2014. [25] A. Zangeneh and S. Jadid, “Fuzzy multi-objective model for distributed generation expansion planning in uncertain environment,” Eur. Trans. Elect. Power, vol. 21, pp. 129–141, 2011. [26] J. L. D. Comba and J. Stolfi, “Affine arithmetic and its applications to computer graphics,” in Proc. VI SIBGRAPI (Brazilian Symp. Computer Graphics and Image Processing), Brazil, 1993, pp. 9–18. [27] G. Manson, “Calculating frequency response functions for uncertain systems using complex affine analysis,” J. Sound Vib., vol. 288, pp. 487–521, 2005. [28] P. Pinson and G. Kariniotakis, “Conditional prediction intervals of wind power generation,” IEEE Trans. Power Syst., vol. 25, no. 4, pp. 1845–1856, Nov. 2010. [29] W. H. Kersting, Distribution System Modeling and Analysis. Boca Raton, FL, USA: CRC, 2012, ch. 10, pp. 343–370.
IEEE TRANSACTIONS ON POWER SYSTEMS, VOL. 30, NO. 6, NOVEMBER 2015
[30] C. S. Cheng and D. Shirmohammadi, “A three-phase power flow method for real-time distribution system analysis,” IEEE Trans. Power Syst., vol. 10, no. 2, pp. 671–679, May 1995. [31] G. W. Chang, S. Y. Chu, and H. L. Wang, “An improved backward/ forward sweep load flow algorithm for radial distribution systems,” IEEE Trans. Power Syst., vol. 22, no. 2, pp. 882–884, May 2007. [32] M. Matsumoto and T. Nishimura, “Mersenne twister: A 623-dimensionally equidistributed uniform pseudorandom number generator,” ACM Trans. Model. Comput. Simulat., vol. 8, no. 1, pp. 3–30, Jan. 1998. [33] W. Li, Risk Assessment of Power Systems: Models, Methods, and Applications. New York, NY, USA: IEEE Press and Wiley, 2005. [34] R. D. Tabors, “Transmission system management and pricing: New paradigms and international comparisons,” IEEE Trans. Power Syst., vol. 9, no. 1, pp. 206–215, Feb. 1994.
Shouxiang Wang (M’10–SM’12) received the B.S. and M.S. degrees from Shandong University of Technology, Jinan, China, in 1995 and 1998, respectively, and the Ph.D. degree from Tianjin University, Tianjn, China, in 2001, all in electrical engineering He is currently a Professor in the School of Electrical Engineering and Automation at Tianjin University, China. His main research interests are distributed generation, microgrid, and smart distribution system.
Liang Han (S’09) received the B.S. degree in electrical engineering from Jilin University, Changchun, China, in 2009. He is currently pursuing the Ph.D. degree in the School of Electrical Engineering and Automation at Tianjin University, China. His research field is distributed generation and smart grid.
Lei Wu (SM’13) received the B.S. degree in electrical engineering and the M.S. degree in systems engineering from Xi'an Jiaotong University, Xi'an, China, in 2001 and 2004, respectively, and the Ph.D. degree in electrical engineering from Illinois Institute of Technology, Chicago, IL, USA, in 2008. Presently, he is an Assistant Professor in the Electrical and Computer Engineering Department at Clarkson University, Potsdam, NY, USA. His research interests include power systems optimization and economics.