Author Proof
Chapter 10
Optimization of In-House Energy Demand
OO F
Stephan Spiegel
14
Sustainable Energy: The Early Adopter Scenario
8 9 10 11 12
15 16 17 18 19 20 21 22 23
Steven and his wife Suzanne love to relax in their garden behind the house on warm summer evenings. Usually, they enjoy dinner with a glass of wine on their garden terrace, talking about the kids, Clara and Carl, or listing to the latest news from the local radio station. Yesterday evening there was a radio broadcast about the advance of smart meters and their potential to reduce the energy consumption in residential homes. Suzanne was excited about the idea of saving energy by themselves, especially since the power market has continuously raised prices over the last couple of years. Steven has always been fond of Suzanne’s commitment to sustainable living and suggested to contact Ralph, an old schoolmate of him, who runs his own little business in the IT sector and also is a trained electrician.
UN
24
ED
6 7
CT
5
RE
3 4
CO R
2
PR
13
Abstract Heating control is of particular importance, since heating accounts for the biggest amount of total residential energy consumption. Smart heating strategies allow to reduce such energy consumption by automatically turning off the heating when the occupants are sleeping or away from home. The present context or occupancy state of a household can be deduced from the appliances that are currently in use. In this chapter, we investigate energy disaggregation techniques to infer appliance states from an aggregated energy signal measured by a smart meter. Since most household devices have predictable energy consumption, we propose to use the changes in aggregated energy consumption as features for the appliance/occupancy state classification task. We evaluate our approach on real-life energy consumption data from several households, compare the classification accuracy of various machine learning techniques, and explain how to use the inferred appliance states to optimize heating schedules.
1
S. Spiegel (B) Technische Universität Berlin, Berlin, Germany e-mail:
[email protected] © Springer International Publishing Switzerland 2015 F. Hopfgartner (ed.), Smart Information Systems, Advances in Computer Vision and Pattern Recognition, DOI 10.1007/978-3-319-14178-7_10 320439_1_En_10_Chapter ! TYPESET
DISK
LE ! CP Disp.:6/12/2014 Pages: 20 Layout: T1-Standard
1
S. Spiegel
ED
PR
OO F
Author Proof
2
25
29 30 31 32 33 34 35 36 37 38 39 40 41 42 43 44
UN
45
CT
28
On the next day Steven called Ralph and was surprised to learn that heating accounts for the biggest amount of total residential energy consumption. Ralph told him that some households save up to 30 % energy by installing an advanced heating control, which allows to setup heating schedules. But Steven argued that it would be difficult to set up a heating schedule for his family, since the timetable of his kids is irregular, his wife’s company allows her to telecommute up to four times per month, and he sometimes has to do shift work. Ralph contemplated Steven’s arguments for a while and eventually suggested to install a presence sensing infrastructure, which can detect movements and forwards presence states to the heating control. However, after weighing the cost for such a sensor infrastructure against the potential energy savings, they both abandoned this course of action. Having discussed the advantages and limitations of available solutions, Steven told Ralph about the radio broadcast which had advertised smart metering technology and came up with the idea of using energy consumption measurements for the detection of presence states. Ralph thought it was a brilliant idea and said that he would do some research on smart metering technology. A week had passed when Ralph finally called back and told Steven that he had come up with an advantageous solution for automatically detecting presence states from smart meter measurements. Although Steven had never before heard of something like energy disaggregation, he could understand that Ralph planned to implement an algorithm that utilizes energy consumption readings to infer appliance use, which in turn could be used to deduce presence states. Ralph explained that the use of an individual electronic device causes a specific energy consumption profile, which can be used to deduce certain activities in a household. According to Ralph,
RE
27
CO R
26
46 47
48 49
320439_1_En_10_Chapter ! TYPESET
DISK
LE ! CP Disp.:6/12/2014 Pages: 20 Layout: T1-Standard
3
67
10.1 Introduction
56 57 58 59 60 61 62 63 64 65
68 69 70 71 72 73 74 75 76 77 78 79 80 81 82 83 84 85
PR
55
ED
54
The main goal of our study is to provide a framework for heating control and scheduling which considers the occupancy states of residential homes. Since most solutions for occupancy state identification involve complex sensor infrastructure and costly hardware which cause high usage barrier [3, 9, 14, 17], we aim to use given information from available electricity smart meters. We propose to employ energy disaggregation to infer appliance usage which is, as we will show, beneficial to occupancy state identification. In the following, we briefly introduce the value of appliance usage information, before we explain how we use this information for the purpose of heating control. In the context of domestic environments, consumers vastly underestimate the energy used for heating and overestimate the energy used for appliances that replace manual labor tasks [4]. Numerous studies have identified that consumers get a better understanding of their energy use by clear, concise, and direct feedback about appliance-specific consumption information [13, 19, 23]. In regard to power grid operators and power suppliers, knowledge about the energy consumption on appliance level is critical to the development of power system planning, load forecasting, billing procedures, and pricing models [4, 19]. In addition, the identification of electric appliances in domestic environments is important, because the increasing number of renewable energy sources in the power grid requires electric utilities to be able to quickly react to changes in supply and demand [18]. The growing need for accurate and specific information about domestic energy consumption on device level has led to numerous studies on appliance load monitoring [1, 4, 10, 22, 23]. Existing solutions for appliance load monitoring can
CT
53
RE
52
CO R
51
OO F
66
the task of the energy disaggregation algorithm would be to recognize and classify the individual appliances consumption profiles within the aggregated energy signal coming from the smart meter. Ralph assured Steven that this solution does not require additional sensor infrastructure and enables recommendations for optimized heating schedules based on automatically deduced presence states. Steven was very pleased with Ralph’s proposal and informed his wife Suzanne about the good news. In about three months they would have a new energy-aware heating control system, which will help them to cut future energy bills without any effort. Suzanne was relieved by the idea that she will never again have to worry about the kids going out of the house without turning the heating off or her coming home early in winter finding the living room in a state of severe cold. Steven told her that it would even be possible to access and monitor the heating control from remote via her smart phone, which may be convenient when they are on longer vacation with their kids. As usual both Steven and Suzanne were enjoying dinner together on their garden terrace, talking about new family projects and listening to the local radio station, which this time was broadcasting a debate about environmentally friendly vehicles and new ways of transportation.
50
UN
Author Proof
10 Optimization of In-House Energy Demand
86 87
88 89 90
320439_1_En_10_Chapter ! TYPESET
DISK
LE ! CP Disp.:6/12/2014 Pages: 20 Layout: T1-Standard
99 100 101 102 103 104 105 106 107 108 109 110 111 112 113 114 115 116 117 118 119 120 121 122 123 124 125 126 127 128 129 130
OO F
98
PR
96 97
ED
95
CT
93 94
RE
92
be classified into two primary techniques [4, 21]: distributed direct sensing and single-point sensing. Distributed direct sensing typically requires a current sensor to be installed in-line with every device and is therefore often referred to as intrusive load monitoring. Although intrusive load monitoring easily achieves a consumption breakdown, deploying a large number of sensors in the residential environment quickly leads to high cost and discouraging high usage barrier [21]. Single-point sensor systems are easier to deploy and are typically subsumed under the concept of nonintrusive load monitoring (NILM) [21]. Energy disaggregation is the task of using an aggregated energy signal, such as that coming from a single-point sensor or rather whole-home power monitor, to make inferences about the different loads of individual appliances [10]. However, single-point sensor systems require knowledge about the household devices and their electrical characteristics [21]. The challenges in energy disaggregation are mainly due to appliances with similar energy consumption, appliances with multiple settings, parallel appliance activity, and environmental noise [19]. Recent studies [8, 10–13, 20] have shown that machine learning techniques represent a suitable solution to recognize appliances in such dynamic and unpredictable environments. In this work, we consider energy disaggregation techniques to derive occupancy states from appliance usage data in order to use this information in smart heating control strategies [9]. Heating control is of particular importance, since heating accounts for the biggest amount of total residential energy consumption and recent studies have shown that up to 30 % of the total energy can be saved by turning the heating off when the occupants are asleep or away [14]. Existing work on the inference of occupancy states in residential environments includes statistical classification of aggregated energy data [9], hot water usage [3] as well as human motion and activity [17]. Our own approach to infer occupancy states differs in that we consider appliance usage, which gives more detailed information about the present context in a household and the devices which suggest user activity. Furthermore, our proposed framework does not require any additional infrastructure, and, therefore, is more likely to be accepted by residents. For the evaluation of our approach, we consider the REDD dataset [10], which consists of whole-home and device-specific electricity consumption for a number of real houses over the period of several month. In our experiments, we compare the performance of different models for the appliance/occupancy state classification task. We use cross-validation (training on all houses and leave-one-out for testing) to evaluate how well the different models generalize. Our results suggest that the Naive Bayes classifier is suitable for the prediction of occupancy/appliance states and fits the problem of real-time heating control. The rest of the chapter is structured as follows. In Sect. 10.2, we give some background on recent advances in energy disaggregation. Section 10.3 introduces the formal notation of our appliance state classification task. Our proposed framework for heating control and scheduling by means of energy disaggregation techniques is described in Sect. 10.4. The experimental design and results on our approach are presented in Sect. 10.5. A practical application for our approach, named SOE, is
CO R
91
S. Spiegel
UN
Author Proof
4
131
132 133 134 135
320439_1_En_10_Chapter ! TYPESET
DISK
LE ! CP Disp.:6/12/2014 Pages: 20 Layout: T1-Standard
5
138
10.2 Background
146 147 148 149 150 151 152 153 154 155 156 157 158 159 160 161 162 163 164 165 166 167 168 169 170 171
PR
145
ED
144
CT
142 143
RE
140 141
Energy disaggregation, also referred to as nonintrusive load monitoring, is the task of using an aggregated energy signal, such as that coming from a whole-home power monitor, to make inferences about the different individual loads of the system [10]. This approach is seen as an intermediate between existing electricity meters (which merely record whole-home power usage) and fully energy-aware home appliance networks, where each individual device reports its own consumption [18]. For a thorough evaluation of various energy disaggregation mechanisms under real-world conditions, a comprehensive collection of power consumption data is needed [18]. Most approaches to energy disaggregation have been supervised, in that the model is trained on individual device power signals [23]. The vast majority of supervised disaggregation approaches have evaluated the trained models on the same devices but in new conditions [1]. Research on energy disaggregation has been encouraged by publicly available datasets such as REDD [10], which contains information about the power consumption of several different homes on device level, and, therefore, allows cross-validation for individual appliances. Experiments on the REDD dataset have shown that the Factorial Hidden Markov Model (FHMM) is able to disaggregate the power data reasonably well [10]. In that case, the disaggregation task is framed as an inference problem and the performance of energy disaggregation is evaluated considering the percentage of energy correctly classified. Although FHMMs have shown to be a powerful tool [5] for learning probabilistic models of multivariate time series, the combinatorial nature of distributed state representation makes an exact algorithm for inferring the posterior probabilities of the hidden state variables intractable. Approximate inference can be carried out using Gibbs sampling or variational methods [5]. Recent work [8] on energy disaggregation presents different FHMM variants which incorporate additional features and better fit the probability distribution of the state occupancy durations of the appliances. Another work [19] proposes Artificial Neural Networks (ANNs) for appliance recognition, because they (i) do not require prior understanding of appliance behavior, (ii) are capable of handling multiple states, and (iii) are able to learn while running. The results show that after training the ANN with generated appliance signatures, the proposed system is able to recognize the previously learned appliances with relatively high accuracy, even in demanding scenarios. To tune the ANN, the authors suggest to use the generated signatures to create a training dataset with all possible combinations of appliance activity. Comparing the disaggregation performance for different ANN algorithms, additional work [11] suggests to employ back-propagation rather than the radial-base-function.
CO R
139
OO F
137
demonstrated in Sect. 10.6. Eventually, we conclude our study and give an outlook on future work in Sect. 10.7.
136
UN
Author Proof
10 Optimization of In-House Energy Demand
172
173 174 175
320439_1_En_10_Chapter ! TYPESET
DISK
LE ! CP Disp.:6/12/2014 Pages: 20 Layout: T1-Standard
182 183 184 185 186 187 188 189 190 191 192 193 194 195 196 197 198 199 200 201 202 203 204 205 206 207 208 209 210 211 212 213 214 215
OO F
181
PR
180
ED
179
CT
178
RE
177
In another study [21], the authors propose a disaggregation algorithm that consists of several consecutive steps including normalization, edge detection via thresholding and smoothing techniques, extraction of power-level and delta-level consumption, matching of known appliances from a signature database with extracted delta vectors, and labeling of recognized devices. The proposed system does not require setup or training, because the user is able to label appliance signatures via her smart phone. In that case, the appliance signatures are based on apparent, reactive, real, and distortion power measured by the smart meter. The classification of household items based on their electricity usage profile over a fixed time interval is discussed in yet another study [13]. The authors consider the time series classification problem of identifying device types through daily or weekly demand profiles. The proposed approach concentrates on bespoken features such as mean, variance, kurtosis, skewness, slope, and run measures. The experiments show that classification using the bespoken features performs better than classification using the raw data. However, the nature of similarity captured strongly depends on the features extracted. In a similar work [18], the authors present an appliance identification approach based on characteristic features of traces collected during the 24 h of a day. The extracted features include temporal appliance behavior, power consumption levels, shape of the consumption, active phase statistics, and noise level characteristics. Each resulting feature vector is annotated by the actual device class and used to train the underlying model of the selected classifier. Among various tested classifiers, the Random Committee algorithm performs best in categorizing new and yet unseen feature vectors into one of the previously trained device types. Additional work [11] demonstrates that the solution from any single-feature, single-algorithm disaggregation approach could be combined under a committee decision mechanism to render the best solution. Yet another work [20] presents a nonintrusive appliance load monitoring technique based on integer programming. Since the overall load current is expressed as a superposition of each current of the operating appliance, the monitoring problem can be formulated as an integer quadratic programming problem by expressing the operating conditions as integer variables. Besides that the proposed method does not require relearning when a new appliance is installed in the house, it is furthermore able to distinguish between different device modes and some-type appliances that operate simultaneously. To monitor the states of multiple appliances via electricity consumption measurements, another work [12] introduces the Bayes filter approach, which computes the posterior distribution over the current state given all observations to date. Since the state transition of an appliance is a continuous process, the authors employ a sliding window to take the temporal factor into consideration and extract the past records of data to be features. The estimated states are represented as binary strings, where each bit denotes the on/off state of one individual appliance. According to the results, the Bayes filter outperforms the KNN, Naive Bayes, and SVM classifier. Leveraging recent advances in device and appliance power supplies, another series of studies [4, 6] extends the energy disaggregation approach by using high-frequency
CO R
176
S. Spiegel
UN
Author Proof
6
216 217 218
219 220
320439_1_En_10_Chapter ! TYPESET
DISK
LE ! CP Disp.:6/12/2014 Pages: 20 Layout: T1-Standard
7
227
10.3 Notation
222 223 224 225
OO F
226
sampling of voltage noise, which provides an additional feature vector that can be used to distinguish more accurately between energy usage signatures. Appliances conduct a variety of noise voltage back onto the home’s power wiring, yielding measurable noise signatures that are easily detectable using appropriate hardware. An important advantage of voltage noise signatures is that any electrical outlet inside the home can be used as a single installation point.
221
251
10.4 Framework and Algorithms
233 234 235 236 237 238 239 240 241 242 243 244 245 246 247 248 249
252
ED
232
CT
231
RE
230
CO R
229
PR
250
Since different devices tend to draw different amounts of power, which are consistent over time, total power is a reasonable feature to use for classification [4]. Most devices have predictable current consumption and can be categorized according to the magnitude of real/reactive power. Given a household with N devices, the power consumption of an individual appliance i ∈ {1, . . . , N } over a period of T time (i) (i) (i) points can be expressed as: y (i) = {y1 , y2 , . . . , yT }. Usually, we only observe !n the sum of all power outputs at each time: y¯t = i=1 yt(i) , with t = 1, . . . , T . Given the aggregated power signal, most research on energy disaggregation [1, 22, 23] aims at inferring the individual device consumption. Since we aim to infer the context or rather occupancy states in residential environments in order to optimize heating control, we are mainly interested in the on/off states of individual appliances st(i) , where st(i) = 1 if device i is turned “on” at time point t, and (i) st = 0 otherwise. The appliance state identification task can be framed as an inference problem. Given an aggregated power signal y¯1 , . . . , y¯T , we intend to compute (i) (i) the posterior probability p(st | y¯t ) of individual appliance states st for each device i = 1, . . . , N and each time point t = 1, . . . , T . Due to the fact that the aggregated power signal is super-imposed and unnormalized, and, therefore, unsuitable for the appliance state identification, we consider the changes in power consumption as features, which can be derived by the first-order (i) (i) (i) difference of the power signal ∆yt = yt −yt−1 for t = 2, . . . , T . Thus the appliance state identification task could also be formulated as a classification problem, where a certain change in power consumption categorizes a device into either “on” or “off” state.
228
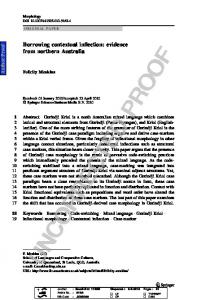
Figure 10.1 shows a flowchart of our proposed framework for heating control and scheduling by means of energy disaggregation. The input for our heating control framework is an aggregated energy signal, such as that coming from a smart meter in a residential home. In the first step (i) we extract features from the energy signal, i.e. changes in consumption, which can be used to categorize the individual electrical
UN
Author Proof
10 Optimization of In-House Energy Demand
253
254 255 256
320439_1_En_10_Chapter ! TYPESET
DISK
LE ! CP Disp.:6/12/2014 Pages: 20 Layout: T1-Standard
S. Spiegel
OO F
Author Proof
8
Fig. 10.1 Framework for heating control and scheduling by means of energy disaggregation techniques
265
10.4.1 Feature Extraction
262 263
266 267 268 269 270 271 272 273 274 275 276 277 278 279 280
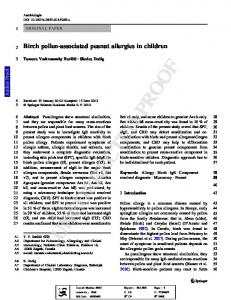
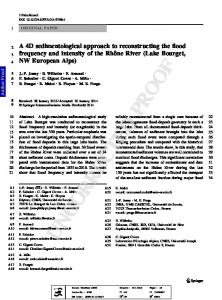
Given the overall energy consumption of a household and the energy consumption of the individual appliances in this household, we aim to build a model for each appliance in order to estimate its on/off states in a previously unknown environment or household. Since an appliance can be either turned on or off, the device state identification can be formalized as a two class problem. For the training of an individual appliance model, we consider the changes in power consumption that classify the respective device states. In our approach, the input for the classification model are two distributions of power changes, which represent the features that characterize one or the other class. Figure 10.2 illustrates the feature extraction process on the basis of real-life measurements from the REDD data set, in particular the energy consumption of (a) House 1 and (b) its refrigerator for a sample time frame of 8 h. We can see that (a) the overall energy consumption is the sum of (b) the Refrigerator’s energy consumption and the energy consumption of other appliances. Given this information, we can derive the changes in energy consumption by the first-order difference of the power signals. This step is often referred to as edge detection, since the stable periods in the signal are filtered out. The edges or changes in power consumption of the overall energy signal and the Refrigerator signal are shown in Fig. 10.2c, d, respectively. Knowing which edges specify (d) the activity of the Refrigerator, we can easily separate the changes in energy consumption that categorize other devices by considering all the
UN
281
ED
261
CT
260
RE
259
CO R
258
PR
264
devices. Subsequently, (ii) we use the extracted features as input for the appliance state classification. For the sake of simplicity, Fig. 10.1 assumes that the individual appliance models were trained on other households prior to the classification task. Given the classified on/off states for each appliance, we can eventually (iii) infer the occupancy state of the respective household and recommend optimized heating schedules. In the following subsections, we describe the (i) feature extraction, (ii) appliance state classification, and (iii) inference of occupancy in more detail.
257
282 283
284
285
320439_1_En_10_Chapter ! TYPESET
DISK
LE ! CP Disp.:6/12/2014 Pages: 20 Layout: T1-Standard
9
Watt
2000
(a)
1500 1000 500 08:00
10:00
12:00
14:00
16:00
(b)
1500 1000
OO F
Watt
2000
500 08:00
10:00
12:00
14:00
Watt
1500 1000 500 08:00
10:00
12:00
500 12:00
16:00
(d)
PR
Watt
1000
10:00
(c)
14:00
1500
08:00
16:00
14:00
16:00
104
(e)
102 100 0
200
400
600
800
1000
1200
1400
100 0
1600
(f)
102
200
400
600
800
1000
1200
1400
1600
Watt
ED
Watt
104
#Elements
#Elements
Time of Day
Fig. 10.2 Energy consumption of a House 1 and b its Refrigerator over an interval of 8 h. Plot c and d show the changes in power consumption for House 1 and its Refrigerator. The distribution of power changes that classify the Refrigerator’s on/off states are illustrated in Plot e and f
290
10.4.2 Appliance State Classification
291 292 293 294 295 296
In this study, we aim at evaluating the appliance state classification task by means of various machine learning techniques, including Naive Bayes (NB) classifier, Factorial Hidden Markov Model (FHMM), Classification Tree (CT), and OneNearest-Neighbor (1NN) classifier. We selected these models based on their complementary characteristics and degree of popularity regarding the energy disaggregation task. Table 10.1 shows typical characteristics of the considered machine learning techniques [16], although the Table 10.1 Characteristics of algorithms
UN
297
RE
288
CO R
287
CT
289
edges in (c) the overall energy signal which do not belong to the Refrigerator. The distribution of the edges that classify the Refrigerator’s on/off states are illustrated in Fig. 10.2e, f. These distributions can serve as training input for most probabilistic models.
286
Fitting speed Prediction speed Memory usage Easy to interpret
320439_1_En_10_Chapter ! TYPESET
DISK
NB
FHMM
CT
1NN
Fast Fast Low Yes
Fast Fast Low No
Fast Fast Low Yes
Fast Medium High No
LE ! CP Disp.:6/12/2014 Pages: 20 Layout: T1-Standard
B&W IN PRINT
Author Proof
10 Optimization of In-House Energy Demand
S. Spiegel
318
10.4.3 Inference of Occupancy
305 306 307 308 309 310 311 312 313 314 315 316
319 320 321 322 323 324 325 326 327 328 329 330 331 332 333
PR
303 304
ED
302
CT
301
We assume that there exists a direct relationship between appliance usage and occupancy states in residential homes. For instance, if the lighting is turned on, we usually know that the residents are at home, unless someone forgot to turn off the lighting. Hence, lighting may be a straightforward indicator for occupancy states, enabling us to verify manually adjusted heating schemes and recommend optimized heating schedules. However, heating control is much more complex, because the usage of certain appliance actually requires to decrease the temperature. For example, when residents turn on the oven or stove, the temperature in the kitchen rises automatically, and we can reduce heating to save energy, instead of just opening the window. In case the heating control system would have knowledge about the installation points of all devices, one could even use the appliance states to control the temperature in individual rooms. The knowledge of individual appliance states furthermore allows us to infer devices that are unrelated to occupancy. For instance, the refrigerator automatically switches between on and off state every few minutes, no matter if the residents are at home or not. The same is true for devices in standby mode or appliances such as the smoke alarm or electronic panels which are constantly drawing power. Therefore, by just looking at the overall energy consumption of a household it is impossible to distinguish between occupancy states.
RE
300
CO R
299
OO F
317
characteristics strongly depend on the underlying algorithm and the problem. Therefore, Table 10.1 should be considered as a guide for an initial choice of models. The NB classifier is a simple probabilistic model based on applying Bayes’ theorem with strong independence assumptions, which has been applied for appliance and occupancy recognition in various studies [9, 12, 13, 18]. Speed and memory usage of the NB classifier are good for simple distributions, but can be poor for large datasets [16]. The FHMM is a statistical model in which the system under study is assumed to be a Markov process with unobserved or hidden states. FHMMs have been successfully applied to the energy disaggregation problem [8, 10, 23]; however, their complexity increases with the number of states and the length of the Markov chain [5, 8]. CTs map observations about an item to conclusions about the item’s target value, meaning the predicted outcome is the class to which the data belongs. Decision tree learning has been proven to be applicable to appliance identification on metering data in a couple of recent studies [1, 18]. The 1NN classifier is often regarded as the simplest straw man or baseline approach [7], and has been considered for the energy disaggregation task in several studies [12, 13, 23]. 1NN usually has good performance in low dimensions, but can have poor predictions in high dimensions. For linear search, 1NN does not perform any fitting [16].
298
UN
Author Proof
10
334 335
336 337 338
320439_1_En_10_Chapter ! TYPESET
DISK
LE ! CP Disp.:6/12/2014 Pages: 20 Layout: T1-Standard
11
341
10.5 Empirical Evaluation
OO F
340
The accuracy of the appliance state classification and the implications for heating control will be scrutinized in the following section.
339
346
10.5.1 Energy Data
343 344
PR
345
The goal of our evaluation is twofold: (i) we investigate which of the considered machine learning models is most accurate for the the appliance state classification task; and (ii) we assess the use of the identified appliance or rather occupancy states for heating control.
342
356
10.5.2 Experimental Design
351 352 353 354
CT
350
RE
348 349
ED
355
We consider the REDD dataset [10], which comprises electricity consumption measurements from six household at the granularity level of individual devices, and represents to date one of the largest and richest publicly available collections of power consumption data [2]. There are approximately 20 consecutive days of measurements available for each house, providing data from the two main phases and each individual circuit at 1 Hz frequency rate. Measured appliances include main consumers such as Air Conditioning, Dishwasher, Disposal, Electrical Heating, Microwave, Oven, Refrigerator, Stove, Washer/Dryer as well as other miscellaneous electronics and outlets (see Table 10.2).
347
366
10.5.3 Classification Accuracy
358 359 360 361 362 363 364
CO R
365
In our empirical evaluation, we compare the classification accuracy of the introduced machine learning models (see Table 10.1) on the REDD data set. Strictly speaking, we assess the appliance state classification accuracy for all considered models on a granularity level of individual devices. The training of the respective models is done on appliance-specific consumption measurements of one particular device for all households but one. The aggregated electricity consumption signal of the leftout household is then used for testing the performance of the trained models for each individual device. This evaluation principle is also commonly known as crossvalidation with leave-one-out.
357
UN
Author Proof
10 Optimization of In-House Energy Demand
367
368
369
Table 10.2 illustrates the classification accuracy per (a) household and (b) appliance for all examined models, including Naive Bayes (NB), Factorial Hidden Markov Model (FHMM), Classification Trees (CT), and One-Nearest-Neighbor 320439_1_En_10_Chapter ! TYPESET
DISK
LE ! CP Disp.:6/12/2014 Pages: 20 Layout: T1-Standard
Author Proof
12
S. Spiegel
Table 10.2 Cross-validation of trained models NB FHMM CT 1NN (a) Classification accuracy of device states per household averaged over all appliances
370 371 372 373 374
RE
CT
0.9300 0.9324 0.9551 0.9970 0.8620 0.7404 0.7294 0.7070 0.8006 0.9526 0.9296 0.9997 0.9815 0.7952 0.9738 0.9363 0.9815 0.9555 0.9297 0.8994
PR
ED
0.9248 0.9275 0.9493 0.9818 0.8856 0.7970 0.8211 0.7915 0.7737 0.9473 0.9295 0.9995 0.9804 0.7872 0.9629 0.9288 0.9807 0.9558 0.9256 0.9079
0.9138 0.9134 0.9134 0.9918 0.8895 0.0991 0.5216 0.1775 0.7611 0.9279 0.7237 0.9996 0.9811 0.7898 0.6234 0.8330 0.9811 0.3432 0.8763 0.7505
(1NN) classifier. The classification results present the performance of the trained models in an unknown environment or rather before unseen household. The results in Table 10.2a show the classification accuracy of device states per household averaged over all appliances. For instance, the NB model achieved an accuracy of 0.8429 for House 1, meaning that the model was trained on House 2–6 and tested on the previously unknown House 1, where 84.29 % of all device states were classified correctly. However, as illustrated in Table 10.2a the classification accuracy of each model varies with the household, which is due to the fact that the examined households use appliances of different manufacturers with dissimilar energy profiles.
UN
375
0.9315 0.9328 0.9541 0.9955 0.8863 0.8875 0.8216 0.7902 0.7751 0.9516 0.9242 0.9982 0.9754 0.7834 0.9729 0.9346 0.9808 0.9578 0.9287 0.9148
CO R
Air conditioning Bathroom GFI Dishwasher Disposal Electrical heating Electronics Furnace Kitchen outlets Lighting Microwave Miscellaneous Outdoor outlets Oven Refrigerator Smoke alarm Stove Subpanel Unknown outlets Washer/Dryer MEAN
OO F
House 1 0.8429 0.8414 0.8319 0.7615 House 2 0.9310 0.9300 0.9224 0.8062 House 3 0.9275 0.9200 0.8908 0.7213 House 4 0.8645 0.8616 0.8746 0.7038 House 5 0.9864 0.9854 0.9839 0.7638 House 6 0.8131 0.7873 0.7752 0.6050 MEAN 0.8942 0.8876 0.8798 0.7269 (b) Classification accuracy of device states per appliance averaged over all households
376
377
378 379
320439_1_En_10_Chapter ! TYPESET
DISK
LE ! CP Disp.:6/12/2014 Pages: 20 Layout: T1-Standard
13
395
10.5.4 Heating Control
387 388 389 390 391 392 393
396 397 398 399 400 401 402 403 404 405 406 407 408 409 410 411 412 413 414 415 416
PR
386
ED
385
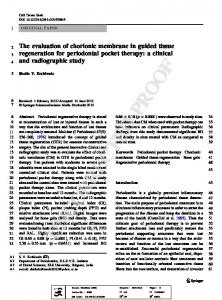
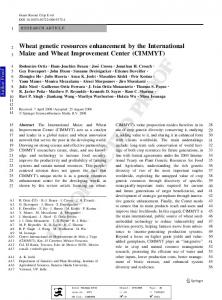
In this subsection, we discuss how the classified on/off device states can be used for heating control and scheduling. Since the Naive Bayes (NB) model achieved the highest average accuracy on classifying device states of appliances in an unknown household (see Table 10.2), we will consider the NB approach in our following exemplification. Figure 10.3 shows the (a) observed and (b) estimated on/off states for the Washer/Dryer in House 1 over a period of 4 weeks, where every quarter of an hour aggregates the device activities that occurred during the same weekday and time of day. By illustrating the (a) observed activity of the Washer/Dryer, which constitutes our ground truth, we see that this appliance is mostly used on Fridays and weekends. The (b) estimated activity of the Washer/Dryer, inferred from the overall energy consumption of House 1 by the trained NB model, shows similar behavior patterns for weekends, but predicts false on states for Mondays. By taking a closer look at the confusion matrix of observed and estimated on/off device states for the Washer/Dryer in House 1, shown in Table 10.3, we are able to gain a better understanding of the estimated appliance activity. Table 10.3 reveals the percentage of true positives (TP) or true on states, true negatives (TN) or true off states, false positives (FP) or false on states, and false negatives (FN) or false off states. Although the NB model achieves a high classification accuracy [(TP + TN)/(TP + TN + FP + FN) = 96.83 %], the percentage of falsely classified states [FP+FN = 3.17 %] in not negligible, explaining the mistaken Washer/Dryer activity estimated for Mondays (see Fig. 10.3b). The FP and FN estimates imply heating during absence and cooling during occupancy, respectively. The cause of falsely classified states can also be explained with help of Fig. 10.2. By examining the distribution of on and off states of the refrigerator in House 1,
CT
384
RE
382 383
CO R
381
OO F
394
Table 10.2b presents the classification accuracy of device states per appliance averaged over all households. For example, the results show that the NB model is able to classify the device states of the Air-Conditioning with an average accuracy of 93.15 %, taking the mean of House 1–6. In general, all models achieved a relatively high classification accuracy for appliances with distinctive energy profiles, such as the Dishwasher or Oven, but performed less well on appliances with changes in consumption that can easily be confused with other devices, like the Refrigerator or Lighting. By taking the mean over all results for (a) each household and (b) each appliance per model, shown in the bottom row of Table 10.2a, b respectively, we can easily see that on average the NB model achieved the highest classification accuracy, closely followed by FHMM and CT. Although the 1NN classifier shows relatively high classification accuracy for several individual appliances, it is unable to correctly classify the device states of others, and, therefore, achieve the lowest average classification performance.
380
UN
Author Proof
10 Optimization of In-House Energy Demand
417
418 419
420
320439_1_En_10_Chapter ! TYPESET
DISK
LE ! CP Disp.:6/12/2014 Pages: 20 Layout: T1-Standard
Author Proof
14
S. Spiegel Monday Tuesday
(a)
Wednesday Thursday Friday Saturday Sunday
4
6
8
10
12
14
16
Time of Day
18
20
22
24
OO F
2
Monday
(b)
Tuesday Wednesday Thursday Friday Saturday Sunday
4
6
8
10
12
14
16
18
20
PR
2
22
24
Time of Day
ED
Fig. 10.3 Observed and estimated on/off states for the Washer/Dryer in House 1 over the period of 4 weeks, illustrating the actual and predicted device activities in the time from April 25 to May 15 2011, where every quarter of an hour aggregates the activities that occurred during the same weekday and time of day. The transition from blue, to yellow, to red colored areas illustrates low, moderate, and high device activity. a Observed on/off states of Washer/Dryer. b Estimated on/off states of Washer/Dryer
422 423 424 425 426 427 428 429 430
shown in Fig. 10.2e, f respectively, we can see there is a significant overlap of changes in power consumption that are caused by both the Refrigerator and other devices. According to Fig. 10.2e, f, changes in power consumption that range from around 1–50 W occur at times when the refrigerator is turned on as well as when its is turned off, leading to an inaccurate appliance model. In order to decrease the number of FP and FN device states one could orchestrate the trained appliance models or consider additional features that distinguish the appliances more accurate. However, this goes beyond the scope of this study, but could be part of future work. A more thorough evaluation of the heating schedules would require datasets that comprise information about actual occupancy states in the residential homes and preferences of the residents in regard of temperature settings.
UN
431
False positive (FP) = 1.14 % True negative (TN) = 96.24 %
CO R
421
True positive (TP) = 0.59 % False negative (FN) = 2.03 %
RE
Estimated on Estimated off
CT
Table 10.3 Confusion matrix of observed and estimated on/off device states for the Washer/Dryer in House 1, where Accuracy = TP + TN = 96.83 %. Observed on Observed off
432
320439_1_En_10_Chapter ! TYPESET
DISK
LE ! CP Disp.:6/12/2014 Pages: 20 Layout: T1-Standard
437 438 439 440 441 442 443 444 445 446
Residents adjust Thermostat
B&W IN PRINT
436
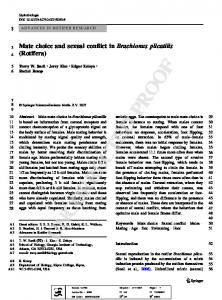
Having explained our approach, we are now in the position to present SOE, a single-agent heating control system, that proposes optimized heating schedules that aim to reduce the residential energy consumption. SOE computes the optimized heating schedules based on manual adjustments of the residents and automatically determined occupancy states. In addition, SOE enables the residents to monitor and control their heating from remote using mobile devices. In order to build a practical application we embedded the implementation of our trained appliance model in our SOE agent using the Matlab to Java compiler.1 The SOE agent [15] is responsible for the heating control in a home and has access to the aggregated energy signal using Smart Message Language (SML)2 and the Multi Utility Communication (MUC)(see footnote 2) interface. Figure 10.4 illustrates the overall architecture of a SOE agent [15]. The residents are enabled to adjust the thermostat and create heating schedules for each
OO F
435
PR
434
10.6 Application
ED
433
15
SOE Algorithms
optimize Heating Schedule
create Heating Schedule
Estimation of Presence
CT
Inferred Appliance Use
Mo
Tue
Wed Thu Fri
RE
Sat
Sun
CO R
0 am
6 am
12 am
6 pm
Disaggregation of Energy Aggregated Power Consumption
Sleep
Breakfast
[present]
[present]
Work
Evening
[away]
[present]
2 kW
1 kW
Power 0 am
6 am
12 am
6 pm
Fig. 10.4 Overall architecture of SOE heating control system. The aggregated energy signal is disaggregated using a Naive Bayes classifier to infer appliance usages. From such usage the occupants presence is estimated and used to optimize the heating schedule. The whole system can be controlled by the residents using tablets and smartphones
UN
Author Proof
10 Optimization of In-House Energy Demand
1 2
www.mathworks.de/products/javabuilder/. www.vde.com/en/fnn/extras/sym2/Infomaterial/Pages/default.aspx. 320439_1_En_10_Chapter ! TYPESET
DISK
LE ! CP Disp.:6/12/2014 Pages: 20 Layout: T1-Standard
S. Spiegel
CO R
RE
CT
ED
PR
OO F
Author Proof
B&W IN PRINT
16
UN
Fig. 10.5 Graphical user interface (GUI) of SOE heating control system, showing the temperature settings for a all rooms at current time, b one individual room for a specific weekday, c a single room for all workdays, and d one individual room for the entire week. The manually created heating schedules are compared against the automatically optimized scheme in order to give recommendations for possible energy savings at idle time intervals
447
448
449 450
individual room (refer to Fig. 10.5). Given the aggregated power consumption of the household, our implemented energy disaggregation component is able to classify individual appliance states. The inferred appliance use is subsequently employed to infer presence and to propose optimized heating schedules to the residents.
320439_1_En_10_Chapter ! TYPESET
DISK
LE ! CP Disp.:6/12/2014 Pages: 20 Layout: T1-Standard
17
469
10.7 Conclusion and Future Work
457 458 459 460 461 462 463 464 465 466 467
470 471 472 473 474 475 476 477 478 479 480 481 482 483 484 485 486
PR
456
ED
455
CT
454
In this work, we reviewed recent advances in energy disaggregation and adopted established appliance identification strategies to infer occupancy states for smart heating control and scheduling. Our proposed approach to appliances state identification considers the changes in power consumption as characteristic to classify the individual devices. In our evaluation, we have shown that the Naive Bayes classifier is able to achieve relatively high accuracy on the appliance state identification task, even in unknown environments or households. Furthermore, we explained how to use the information about identified appliances to infer occupancy states in residential homes. We exemplified the idea of occupancy-based heating schedules and discussed the problem of falsely identified appliance states. The main advantage of our proposed framework for heating control and scheduling is its simplicity in that we refrain from implementing new infrastructure in residential homes, but use given information from available electricity smart meters. This approach will eventually lead to higher acceptance rates among residents and provides alternative avenues for novel heating control strategies. In addition, we demonstrated SOE, a smart heating control system, which integrates the discussed energy disaggregation algorithms to infer appliances states that indicate presence. Our implementation of the SOE provides insights into practicality and usability, which are valuable for the intended deployment in real estates. Since our appliance state identification strategy can replace sensing infrastructure that is used to identify occupancy states in residential homes, it would also be interesting to compare the energy savings provided by our approach with the performance of
RE
453
CO R
452
OO F
468
The SOE heating control system aims at integrating the user as an essential part of the heating control process. At this point, we want to address questions concerning various aspects of human computer interaction. This includes the usability and acceptance of the developed system with regard to different user groups and/or environments. Users are able to access the system using mobile devices and control the heating process in a fine-grained manner (refer to Fig. 10.5). In case that the manually created and automatically optimized heating schedules differ from each other, the SOE agent will provide recommendations for possible adaptations. These suggestions are shown as notifications, whereas the user can either accept the recommended adaptations or reject the automatically generated heating schedule to manually conduct changes. This is of utter importance, because the number of falsely classified appliance states is not negligible. False estimates imply heating during absence or cooling during presence, and are, therefore, undesired. In our future work, we intend to reduce the number of false estimates and in consequence to improve the appliance classification by using acceptance/rejection as reward/punishment signal for reinforcement learning strategies. In order to demonstrate the system outside of our showroom, we use a common notebook to simulate the smart home and an iPad to show the SOE application.
451
UN
Author Proof
10 Optimization of In-House Energy Demand
487 488
489
490 491
320439_1_En_10_Chapter ! TYPESET
DISK
LE ! CP Disp.:6/12/2014 Pages: 20 Layout: T1-Standard
493 494 495 496 497 498 499 500 501
existing frameworks, such as the smart thermostat [14]. However, this would require datasets that comprise information about actual occupancy states in the residential homes and preferred temperature settings. Our proposed approach to appliance state identification can furthermore be beneficial for other applications. Recent studies [2] have shown that the availability of smart meter data alone is often not sufficient to achieve high load disaggregation accuracies. Future work could combine the knowledge of total energy consumption with additional information about sequences of events, such as on/off states for each individual appliance, to improve the accuracy of certain disaggregation algorithms [2] that use such events along with smart meter data.
OO F
492
S. Spiegel
505
References
509 510 511 512 513 514 515 516 517 518 519 520 521 522 523 524 525 526 527 528 529 530 531
ED
508
1. K.C. Armel, A. Gupta, G. Shrimali, A. Albert, Is disaggregation the holy grail of energy efficiency? The case of electricity. Energy Policy 52(C), 213–234 (2013) 2. C. Beckel, W. Kleiminger, T. Staake, S. Santini, Improving device-level electricity consumption breakdowns in private households using on/off events. SIGBED Rev. 9(3), 32–38 (2012) 3. P.J. Boait, R.M. Rylatt, A method for fully automatic operation of domestic heating. Energy Build. 42(1), 11–16 (2010) 4. J. Froehlich, E. Larson, S. Gupta, G. Cohn, M. Reynolds, S. Patel, Disaggregated end-use energy sensing for the smart grid. IEEE Pervasive Comput. 10(1), 28–39 (2011) 5. Z. Ghahramani, M.I. Jordan, Factorial hidden Markov models. Mach. Learn. 29(2–3), 245–273 (1997) 6. S. Gupta, M.S. Reynolds, S.N. Patel, Electrisense: single-point sensing using EMI for electrical event detection and classification in the home, in Proceedings of the 12th ACM International Conference on Ubiquitous Computing, pp. 139–148 (2010) 7. E.J. Keogh, S. Kasetty, On the need for time series data mining benchmarks: a survey and empirical demonstration. Data Min. Knowl. Discov. 7(4), 349–371 (2003) 8. H. Kim, M. Marwah, M.F. Arlitt, G. Lyon, J. Han, Unsupervised disaggregation of low frequency power measurements, in SDM, pp. 747–758 (2011) 9. W. Kleiminger, C. Beckel, S. Santini, Opportunistic sensing for efficient energy usage in private households, in Proceedings of the Smart Energy Strategies Conference 2011 (2011) 10. J.Z. Kolter, M.J. Johnson, REDD: a public data set for energy disaggregation research, in Proceedings of SustKDD Workshop on Data Mining Applications in Sustainability (2011) 11. S.J. Lian, S. Ng, G. Kendell, J. Cheng, Load signature study—part i: basic concept, structure, and methodology. IEEE Trans. Power Deliv. 25(2), 551–560 (2010) 12. G.-Y. Lin, S.-C. Lee, J.Y.-J. Hsu, Sensing from the panel: applying the power meters for appliance recognition, in Proceedings of the 14th Conference on Artificial Intelligence and Applications (2009) 13. J. Lines, A. Bagnall, P. Caiger-Smith, S. Anderson, Classification of household devices by electricity usage profiles, in IDEAL, pp. 403–412 (2011) 14. J. Lu, T. Sookoor, V. Srinivasan, G. Gao, B. Holben, J. Stankovic, E. Field, K. Whitehouse, The smart thermostat: using occupancy sensors to save energy in homes, in Proceedings of the 8th ACM Conference on Embedded Networked Sensor Systems, pp. 211–224 (2010)
CT
507
RE
506
CO R
503
PR
504
Acknowledgments This work was funded by the Federal Ministry of Economic Affairs and Energy (BMWi) under funding reference number KF2392312-KM2. The presented SOE application was developed by Veit Schwartze, Stephen Prochnow, and Marie Schacht.
502
UN
Author Proof
18
532
533 534 535
536
320439_1_En_10_Chapter ! TYPESET
DISK
LE ! CP Disp.:6/12/2014 Pages: 20 Layout: T1-Standard
540 541 542 543 544 545 546 547 548 549 550 551 552 553 554 555 556 557 558 559 560 561
CO R
RE
CT
562
OO F
539
15. M. Luetzenberger, T. Kuester, T. Konnerth, A. Thiele, N. Masuch, A. Hessler, J. Keiser, M. Burkhardt, S. Kaiser, S. Albayrak, JIAC V—a MAS framework for industrial applications (extended abstract), in Proceedings of the 12th International Conference on Autonomous Agents and Multiagent Systems, ed. by T. Ito, C. Jonker, M. Gini, O. Shehory, pp. 1189–1190 (2013) 16. MathWorks (TM), Statistics Toolbox: Supervised Learning Workflow and Algorithms (R2013a) 17. V. Pallotta, P. Bruegger, B. Hirsbrunner, Smart heating systems: optimizing heating systems by kinetic-awareness, in Proceedings of 3rd International Conference on Digital Information Management (2008) 18. A. Reinhardt, P. Baumann, D. Burgstahler, M. Hollick, H. Chonov, M. Werner, R. Steinmetz, On the accuracy of appliance identification based on distributed load metering data, in Proceedings of 2nd IFIP Conference on Sustainable Internet and ICT for Sustainability (2012) 19. A.G. Ruzzelli, C. Nicolas, A. Schoofs, G.M.P. O’Hare, Real-time recognition and profiling of appliances through a single electricity sensor, in Proceedings of the 7th Annual IEEE Communications Society Conference on Sensor, Mesh and Ad Hoc Communications and Networks, pp. 279–287 (2010) 20. K. Suzuki, S. Inagaki, T. Suzuki, H. Nakamura, K. Ito, Nonintrusive appliance load monitoring based on integer programming, in Proceedings on SICE Annual Conference (2008) 21. M. Weiss, A. Helfenstein, F. Mattern, T. Staake, Leveraging smart meter data to recognize home appliances, in Proceedings of IEEE International Conference on Pervasive Computing and Communications, pp. 190–197 (2012) 22. M. Zeifman, K. Roth, Nonintrusive appliance load monitoring: review and outlook. IEEE Trans. Consum. Electron. 57(1), 76–84 (2011) 23. A. Zoha, A. Gluhak, M. Ali Imran, S. Rajasegarar, Non-intrusive load monitoring approaches for disaggregated energy sensing: a survey. Sensors 12(12), 16838–16866 (2012)
PR
538
ED
537
19
UN
Author Proof
10 Optimization of In-House Energy Demand
320439_1_En_10_Chapter ! TYPESET
DISK
LE ! CP Disp.:6/12/2014 Pages: 20 Layout: T1-Standard