Author Proof
Chapter 12
Discovery of Driving Behavior Patterns
OO F
Stephan Spiegel
19
Reduced Emissions: The Drive Green Scenario
6 7 8 9 10 11 12 13 14 15 16 17
20 21 22 23 24
Since Steven entered preliminary school at the early age of five, he always loved to spend the Sunday afternoons in solitary reading books about theoretical and applied mathematics. None of this has changed in the last 30 years and nobody in his family was surprised about his recent decision to work as an associate researcher at one of the leading car manufacturers. Although Steven is passionate about modern technology, his father thought him to respect and preserve nature. When Steven was a teenager, he and his dad often went hiking to watch birds at one of the small lakes in the forest
UN
25
ED
5
CT
4
RE
3
CO R
2
PR
18
Abstract Given a set of time series, our goal is to identify prototypes that cover the maximum possible amount of occurring subsequences regardless of their order. This scenario appears in the context of the automotive industry, where the objective is to determine operational profiles that comprise frequently recurring driving behavior patterns. This problem can be solved by clustering, however, standard distance measures such as the dynamic time warping distance might not be suitable for this task, because they aim at capturing the cost of aligning two time series rather than rewarding pairwise occurring patterns. In this work, we propose a novel time series distance measure, based on the theoretical foundation of recurrence plots, which enables us to determine the (dis)similarity of multivariate time series that contain segments of similar trajectories at arbitrary positions. We use recurrence quantification analysis to measure the structures observed in recurrence plots and to investigate dynamical properties, such as determinism, which reflect the pairwise (dis)similarity of time series. In experiments on real-life test drives from Volkswagen, we demonstrate that clustering multivariate time series using the proposed recurrence plot-based distance measure results in prototypical test drives that cover significantly more recurring patterns than using the same clustering algorithm with dynamic time warping distance.
1
26
S. Spiegel (B) Technische Universität Berlin, Berlin, Germany e-mail:
[email protected] © Springer International Publishing Switzerland 2015 F. Hopfgartner (ed.), Smart Information Systems, Advances in Computer Vision and Pattern Recognition, DOI 10.1007/978-3-319-14178-7_12 320439_1_En_12_Chapter ! TYPESET
DISK
LE ! CP Disp.:6/12/2014 Pages: 30 Layout: T1-Standard
1
28 29 30 31 32 33
CT
ED
PR
34
of the nearby mountains. On their hikes, Steven was told a lot about the local wildlife and everything his father had learned from the scouts when he was a boy. At that time, Steven decided that he would dedicate his adult life to preserve that untouched nature for his own children and the generations after. He soon realized that he could use his natural talent for mathematics to solve environmental problems and to contribute to society. His current position in a research and development department for internal combustion engines allows Steven to take an active part in reducing the emission of greenhouse gases, which have long been known to cause global warming.
OO F
27
S. Spiegel
35
39 40 41 42 43 44 45 46 47 48 49 50
RE
37 38
Recent political debates about climate change have led to profound environmental regulations that limit the maximum permissible emission for vehicles on European roads. To avoid severe sanctions, the automotive industry has to ensure that their newly developed engines go below the allowed limit of exhaust fumes. However, automobile manufacturer face the problem that a nationwide survey of their car fleet would result in exorbitant cost and effort. Instead of that, Steven proposed to draw samples from test drives which characterize specific combinations of driver, vehicle, and route. In further investigations, the derived operational profiles could be used to simulate typical driving behavior and to spot-check against the newly introduced emission regulations. Although the top management is not fully convinced, Steven has strong support from his own rows and was invited to present his detailed proposal to the decision-making department. Steven explains that he aims at deriving characteristic operational profiles of their new vehicle fleet by means of several controlled test drives. His idea is to record multiple engine parameters during test drives to discover driving behavior patterns which typically occur under certain circumstances. The main challenge is to develop an algorithm that is able to efficiently and effectively compare the high-dimensional measurements with regard to co-occurring temporal patterns. Test drives with a high number of typical driving behavior patterns may than be used for engine simulations
CO R
36
UN
Author Proof
2
51 52 53 54
320439_1_En_12_Chapter ! TYPESET
DISK
LE ! CP Disp.:6/12/2014 Pages: 30 Layout: T1-Standard
3
66
12.1 Introduction
62 63 64
67 68 69 70 71 72 73 74 75 76 77 78 79 80 81 82 83 84 85 86 87 88 89 90
PR
60 61
Clustering of times series data is of pivotal importance in various applications [9] such as, for example, seasonality patterns in retail [13], electricity usage profiles [17], DNA microarrays [26], and fMRI brain activity mappings [39]. A crucial design decision of any clustering algorithm is the choice of (dis)similarity function [1, 14]. In many clustering applications, the underlying (dis)similarity function measures the cost of aligning time series to one another. Typical examples of such functions include the DTW and the Euclidean distance [4, 10, 27]. Alignment-based (dis)similarity functions, however, seem not to be justified for applications, where two time series are considered to be similar, if they share common or similar subsequences of variable length at arbitrary positions [2, 16, 28, 40]. A real-life example for such an application comes from the automotive industry, where test drives of vehicles are considered to be similar, if they share similar driving behavior patterns, i.e., engine behavior or drive maneuvers, which are described by the progression of multiple vehicle parameters over a certain period of time [33, 35]. In this scenario, the order of the driving behavior patterns does not matter [32], but the frequency with which the patterns occur in the contrasted time series. Recent work [5] on time series distance measures suggests to neglect irrelevant and redundant time series segments, and to retrieve subsequences that best characterize the real-life data. Although subsequence clustering is a tricky endeavor [12], several studies [2, 7, 16, 28, 40] have demonstrated that in certain circumstances ignoring sections of extraneous data and keeping intervals with high discriminative power contributes to cluster centers that preserve the characteristics of the data sequences. Related concepts that have been shown to improve clustering results include time series motifs [2, 16], shapelets [28, 40], and discords [7]. In this contribution, we propose to adopt recurrence plots (RPs) [18, 21, 22] and related recurrence quantification analysis (RQA) [19, 20, 23] to measure the similarity between multivariate time series that contain segments of similar trajectories at arbitrary positions in time [32]. We introduce the concept of joint cross recurrence plots (JCRPs), an extension of traditional RPs, to visualize and investigate
ED
59
CT
58
RE
57
CO R
56
OO F
65
and emission evaluations. Due to the fact that Steven’s approach is less expensive and time consuming than a nationwide survey, the decision committee felt positive about his idea and assigned him to lead the research project. Leading a team of researchers in developing more efficient and environmentfriendly combustion engines does not only mean a real breakthrough in Steven’s career, but also a huge success on a personal level. Since his childhood, he always dreamed of finding a way to use own skills to do something for the benefit of the nature his father taught him to love. This is a unique opportunity for Steven to make a positive impact on the environment of future generations. He wants his children and grandchildren to enjoy and experience nature in the same was as he did as a kid. With this in mind, Steven accepts the challenge of his lifetime.
55
UN
Author Proof
12 Discovery of Driving Behavior Patterns
91
92
93 94
95
320439_1_En_12_Chapter ! TYPESET
DISK
LE ! CP Disp.:6/12/2014 Pages: 30 Layout: T1-Standard
S. Spiegel
118
12.2 Problem Statement
104 105 106 107 108 109 110 111 112 113 114 115 116
119 120 121 122 123 124 125 126 127 128 129 130 131
PR
103
ED
101 102
CT
100
Car manufacturers aim to optimize the performance of newly developed engines according to operational profiles that characterize recurring driving behavior. To obtain real-life operational profiles for exhaust simulations, Volkswagen (VW) collects data from test drives for various combinations of driver, vehicle, and route. Given a set X = {X 1 , X 2 , . . . , X t } of t test drives, the challenge is to find a subset of k prototypical time series Y = {Y1 , . . . , Yk } ∈ X that best comprehend the recurring (driving behavior) patterns found in set X . Test drives are represented as multivariate time series X = (x1 , . . . , xn ) of varying length n, where xi ∈ Rd is a d-dimensional feature vector summarizing the observed measurements at time i. A pattern S = (xs , . . . , xs+l−1 ) of X = (x1 , . . . , xn ) is a subsequence of l consecutive time points from X , where l ≤ n and 1 ≤ s < s + l − 1 ≤ n. Assuming two time series X = (x1 , . . . , xn ) and Y = (y1 , . . . , ym ) with patterns S = (xs , . . . , xs+l−1 ) and P = (y p , . . . , y p+l−1 ) of length l, we say that S and P are recurring patterns of X and Y if d(S, P) ≤ ϵ, where and d : X × X → R+ is a (dis)similarity function and ϵ is a certain similarity threshold. Note that recurring patterns of X and Y may occur at arbitrary positions and in different order. Since we aim to identify k prototypical time series that (i) best represent the set X and (ii) are members of the set X , one can employ the k-medoid clustering algorithm.
RE
98 99
CO R
97
OO F
117
multivariate patterns that (re)occur in pairwise compared time series. In dependence on JCRPs and known RQA measures, such as determinism, we define a RecuRRence plot-based (RRR) distance measure, which reflects the proportion of time series segments with similar trajectories or recurring patterns, respectively. In order to demonstrate the practicability of our proposed recurrence plot-based distance measure, we conduct experiments on both synthetic time series and reallife vehicular sensor data [32, 33, 35]. The results show that, unlike commonly used (dis)similarity functions, our proposed distance measure is able to (i) determine cluster centers that preserve the characteristics of the data sequences and, furthermore, (ii) identify prototypical time series that cover a high amount of recurring patterns. The rest of the chapter is organized as follows. In Sect. 12.2, we state the general problem being investigated. Related work is discussed in Sect. 12.3. Subsequently, we introduce traditional recurrence plots as well as various extensions in Sect. 12.4. Recurrence quantification analysis and corresponding measures are discussed in Sect. 12.5. Our proposed recurrence plot-based distance measure and respective evaluation criteria are introduced in Sect. 12.6. Possible ways to reduce the computational complexity of our introduced distance measure are offered in Sects. 12.7 and 12.8. Our experimental results are presented and discussed in Sect. 12.9. In addition, Sect. 12.10 presents BestTime, a platform-independent Matlab application with graphical user interface, which enables us to find representative that best comprehend the recurring temporal patterns contained in a certain time series dataset. Finally, we conclude with future work in Sect. 12.11.
96
UN
Author Proof
4
132
133 134
135
136
320439_1_En_12_Chapter ! TYPESET
DISK
LE ! CP Disp.:6/12/2014 Pages: 30 Layout: T1-Standard
144 145 146 147 148 149 150 151 152 153 154 155 156 157 158 159 160 161 162 163 164 165 166 167 168 169 170 171 172 173
OO F
143
Time Series Clustering. Unlike static data, temporal data evolves over time and therefore requires special handling. One could either modify the existing clustering algorithms to handle time series data or convert the time series into a form that can be directly clustered. The former approach works with the raw time series, and the major modification lies in replacing the distance/similarity measure. The latter approach converts the raw time series either into feature vectors or model parameters, and then applies conventional clustering algorithms. Thus, time series clustering approaches can be categorized into raw-data-based, feature-based, and model-based methods [14].
PR
141 142
ED
140
The main goal of clustering is to organize unlabeled data into homogeneous groups that are clearly separated from each other. In general, clustering involves the clustering algorithm, the similarity or rather distance measure, and the evaluation criterion. Clustering algorithms are categorized into partitioning, hierarchical, density-based, grid-based, and model-based methods. All of these clustering algorithms can be applied for static and temporal data [14]. In the following, we discuss important considerations, common pitfalls, successful applications, and recent developments in time series clustering.
Time Series Representation. In this study, we mainly focus on clustering methods that work with raw data, in particular multivariate time series with same sample rate. Clustering time series only differs from conventional clustering in how to compute the similarity between data objects [14]. Therefore, the key is to understand the unique characteristics of the time series and then to design an appropriate similarity measure accordingly. For instance, Meesrikamolkul et al. [25] have proposed a novel method which combines the widely used k-means clustering algorithm with the Dynamic Time Warping distance measure, instead of the traditional Euclidean distance, to study sequences with time shifts. Unlike before, the new method determines cluster centers that preserve the characteristics of the data sequences.
CT
139
RE
138
12.3 Related Work
Distance/Similarity Measures. Besides Euclidean distance and Dynamic Time Warping distance, commonly used similarity measures include Minkowski distance, Levenshtein distance, Short Time Series distance, Pearson correlation coefficient, cross-correlation-based distances, probability-based distance functions, and many others. The choice of similarity measure depends on whether the time series is discrete-valued or real-valued, uniform or nonuniform sampled, univariate or multivariate, and whether the data sequences are of equal or unequal length [14].
CO R
137
5
Distortions and Invariance. Furthermore, the choice of the time series distance measure depends on the invariance required by the domain. The literature [1] has introduced techniques designed to efficiently measure similarity between time series with invariance to (various combinations of) the distortions of warping, uniform scaling, offset, amplitude scaling, phase, occlusions, uncertainty, and wandering baseline. Recent work [32] has proposed an order-invariant distance which is able to determine the (dis)similarity of time series that exhibit similar subsequences at arbitrary
UN
Author Proof
12 Discovery of Driving Behavior Patterns
174 175 176 177
178
320439_1_En_12_Chapter ! TYPESET
DISK
LE ! CP Disp.:6/12/2014 Pages: 30 Layout: T1-Standard
186 187 188 189 190 191 192 193 194 195 196 197 198 199 200 201 202 203 204 205 206 207 208 209 210 211 212 213 214 215 216
OO F
185
Evaluation Criterion. Evaluation criteria for clustering are distinguished between known ground truth and unknown ground truth [14]. In case of known ground truth, the similarity between known clusters and obtained clusters can be measured. The most commonly used clustering quality measure for known ground truth is the Rand Index or minor variants of it [40]. In contrast, without prior knowledge the clusters are usually evaluated according their within-cluster similarity and between-cluster dissimilarity [14]. Various validity indices have been proposed to determine the number of clusters and their goodness. For instance, the index I has been found to be consistent and reliable, irrespective of the underlying clustering technique and data dimensionality, and furthermore has been shown to outperform the Dunn and David-Bouldin index [24].
PR
183 184
Realistic Assumptions. The majority of publicly available time series datasets were preprocessed and cleaned before publishing. For instance, the UCR archive [9] contains only time series with equal length, which are mostly snippets of the original data that were retrieved manually. The publication of perfectly aligned patterns of equal length has lead to huge amount of time series classification and clustering algorithms that are not able to deal with real-world data, which contains irrelevant sections. Hu et al. [5] suggest to automatically build a data dictionary, which contains only a small subset of the training data and neglects irrelevant sections and redundancies. The evaluations show that using a data dictionary with a set of retrieved subsequences for each class leads to higher classification accuracy and is several time faster than the compared strawman algorithms. However, one needs to be careful about how to retrieve subsequences, for reasons explained in the following.
ED
182
CT
181
RE
180
positions. The authors demonstrate that order invariance is an important consideration for domains such as automotive engineering and smart home environments [33, 35], where multiple sensors observe contextual patterns in their naturally occurring order, and time series are compared according the occurrence of these multivariate patterns.
Subsequence Clustering. Keogh and Lin [12] state that the clustering of time series subsequences is meaningless, referring to the finding that the output does not depend on input, and the resulting cluster centers are close to random ones. In almost all cases the subsequences are extracted with a sliding window, which is assumed to the quirk in clustering. To produce meaningful results the authors suggest to adopt time series motifs, a concept highly related to clusters. Their experiments demonstrate that motif-based clustering is able to preserve the patterns found in the original time series data [12].
CO R
179
S. Spiegel
Time Series Motifs. Motifs are previously unknown, frequently occurring patterns, which are useful for various time series mining tasks: such as summarization, visualization, clustering and classification of time series [2, 16]. According to the definition [16] a time series motif is a subsequence that comprises all nontrivial matches within a given range. Since the naive (brute-force) approach to motif discovery has quadratic complexity, Lin et al. [16] introduce a new motif discovery algorithm that provides fast exact answers, and faster approximate answers, achieving a speedup of one to two orders of magnitude. In order to reduce the num-
UN
Author Proof
6
217
218 219
220 221
320439_1_En_12_Chapter ! TYPESET
DISK
LE ! CP Disp.:6/12/2014 Pages: 30 Layout: T1-Standard
227 228 229 230 231 232 233 234 235 236 237 238 239 240 241 242 243 244 245 246 247 248 249 250
OO F
226
Time Series Shapelets. Most existing methods for time series clustering rely on distances calculated on the shape of the signals. However, time series usually contain a great amount of measurements that do not contribute to the differentiation task or even decrease cluster accuracy. Hence, to cluster time series, we are generally better off ignoring large sections of extraneous data and keeping intervals with high discriminative power. Recent work [28, 40] proposes to use local patterns, so called shapelets, to cluster time series databases. According to the definition [40], a shapelet is a time series snippet that can separate and remove a subset of the data from the rest of the database, while maximizing the separation gap or rather information gain. Although the experiments demonstrate that shapelet-based clustering gives better results than statistical-based clustering of the entire time series, finding optimal shapelets is a nontrivial task, and almost certainly harder than the clustering itself [40]. However, the results underline the importance of ignoring some data to cluster time series in real-world applications under realistic settings.
PR
225
ED
224
CT
223
ber of possible candidates of motifs, Chiu et al. [2] propose to omit consecutive subsequences that resemble each other. Furthermore, the set of subsequences in each motif should be mutually exclusive, because otherwise the motifs would be essentially the same. Although normalization techniques are commonly applied to compare time series with different offset and amplitude, Chiu et al. [2] state that these are important characteristics that might prove to be useful to distinguish motifs, because after normalization most subsequences correspond to almost the same upward or downward trend and become indistinguishable.
Time Series Discords. Different from motifs or shapelets, time series discords are subsequences of longer time series that are most unusual or rather maximally different to all the rest of the time series subsequences. Keogh et al. [7] have shown that time series discords are particularly attractive as anomaly detectors because they only require one intuitive parameter, namely the length of the subsequences. Furthermore, discords have implications for the time series clustering, cleaning, and summarization.
RE
222
7
256
12.4 Recurrence Plots
253 254
257
CO R
255
Time Series Prototypes. To sum up, the concepts that may possibly be adapted to identify time series prototypes (as described in our problem statement in Sect. 12.2) include motifs [2, 16] and shapelets [28, 40]. However, in both cases this would require major modifications of the existing algorithm. A straightforward approach to solve the stated problem is presented in the following sections.
251 252
Recurrence plots (RPs) are used to visualize and investigate recurrent states of dynamical systems or rather time series [23, 31]. Even though RPs give very vivid and impressive images of dynamical system trajectories, their implicit mathematical foundation is deceptively simple [18]:
UN
Author Proof
12 Discovery of Driving Behavior Patterns
258
259 260
320439_1_En_12_Chapter ! TYPESET
DISK
LE ! CP Disp.:6/12/2014 Pages: 30 Layout: T1-Standard
S. Spiegel
Ri,x j (ϵ) = Θ(ϵ − ||xi − x j ||)
261
268 269 270 271 272 273 274 275 276 277 278 279 280 281 282 283 284 285 286 287
288
289 290 291 292 293 294 295 296 297 298
OO F
267
PR
266
ED
265
CT
264
299 300
(12.1)
where x is a time series of length n, || · || a norm and Θ the Heaviside function. One of the most crucial parameters of RPs is the recurrence threshold ϵ, which influences the formation of line structures [21]. In general, the recurrence threshold should be chosen in a way that noise corrupted observations are filtered out, but at the same time a sufficient number of recurrence structures are preserved. As a rule of thumb, the recurrence rate should be approximately one percent with respect to the size of the plot. For quasiperiodic processes, it has been suggested to use the diagonal line structures to find the optimal recurrence threshold. However, changing the threshold does not preserve the important distribution of recurrence structures [23]. A general problem with standard thresholding methods is that an inappropriate threshold or laminar states cause thick diagonal lines, which basically corresponds to redundant information. Schultz et al. [31] have proposed a local minima-based thresholding approach, which can be performed without choosing any particular threshold and yields in clean RPs of minimized line thickness. But this approach comes with some side effects, e.g., bowed lines instead of straight diagonal lines. Furthermore, it is important to discuss the definition of recurrences, because distances can be calculated using different norms [18]. Although the L 2 -norm is used in most cases, the L ∞ -norm is sometimes preferred for relatively large time series with high computational demand [23]. Although traditional RPs only regard one trajectory, we can extend the concept in a way that allows us to study the dynamics of two trajectories in parallel [22]. A cross recurrence plot (CRP) shows all those times at which a state in one dynamical system occurs in a second dynamical system. In other words, the CRP reveals all the times when the trajectories of the first and second time series, x and y, visits roughly the same area in the phase space. The data length, n and m, of both systems can differ, leading to a nonsquare CRP matrix [19, 21].
RE
263
x,y
C Ri, j (ϵ) = Θ(ϵ−||xi −y j ||) xi , y j ∈ Rd , i = 1 . . . n,
j = 1...m
(12.2)
For the creation of a CRP, both trajectories, x and y, have to present the same dynamical system with equal state variables because they are in the same phase space. The application of CRPs to absolutely different measurements, which are not observations of the same dynamical system, is rather problematic and requires some data preprocessing with utmost carefulness [21]. In order to test for simultaneously occurring recurrences in different systems, another multivariate extension of RPs was introduced [22]. A joint recurrence plot (JRP) shows all those times at which a recurrence in one dynamical system occurs simultaneously with a recurrence in a second dynamical system. With other words, the JRP is the Hadamard product of the RP of the first system and the RP of the second system. JRPs can be computed from more than two systems. The data length of the considered systems has to be the same. [19, 21].
CO R
262
xi ∈ Rd , i, j = 1 . . . n
UN
Author Proof
8
320439_1_En_12_Chapter ! TYPESET
DISK
LE ! CP Disp.:6/12/2014 Pages: 30 Layout: T1-Standard
x,y
J Ri, j (ϵ x , ϵ y ) = Θ(ϵ x − ||xi − x j ||) · Θ(ϵ y − ||yi − y j ||)
302
xi ∈ Rd1 ,
303
307 308 309 310 311
312
OO F
306
Such joint recurrence plots have the advantage that the individual measurements can present different observables with different magnitudes or range. They are often used for the detection of phase synchronization [19, 21]. Since this work aims at clustering test drives, which involves pairwise (dis)similarity comparisons of multivariate time series, we propose a combination of joint and cross recurrence plot, namely (JCRP) joint cross recurrence plot. A JCRP shows all those times at which a multivariate state in one dynamical system occurs simultaneously in a second dynamical system.
PR
305
x,y
J C Ri, j (ϵ 1 , . . . , ϵ k ) = Θ(ϵ 1 − ||xi1 − y 1j ||) × · · · × Θ(ϵ k − ||xik − y kj ||) (12.4)
313
xi , y j ∈ Rd , i = 1 . . . n,
314
317 318 319 320 321
322
323
324 325 326 327 328 329 330 331 332
ED
316
For the creation of a JRCP both trajectories, x and y, need to have the same dimensionality or number of parameters d, but can have different length, n and m. We shall see that JCRPs are very useful, because they enable us to compare two multivariate systems with the same set of observables that can have different magnitudes. In other words, the introduced JCR notation allows us to determine an ϵ-threshold for each individual parameter, which is advantageous for observables with different variance. A toy example for JCRPs is given in the following:
x= y=
!
!
dfcghGATHERSPEEDlmknhDECELERATEghfkd rsqtpACCELERATORxywzvBRAKEPEDALtvswr kdhfSLOWDOWNglbkchdgfGATHERSPEEDnkml tpsBRAKEPEDALzrysxtwvACCELERATORxtwv
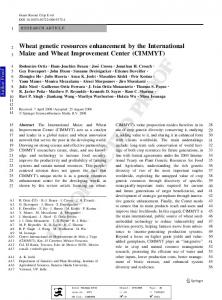
Assume two multivariate time series x and y which comprise the speed and accelerator signal recorded during different car drives. Both time series contain multivariate states or rather string sequences that occur in both systems, as demonstrated in Fig. 12.1a. The corresponding JCRP of x and y, as illustrated in Fig. 12.1b, shows the times at which a multivariate state occurs simultaneously in both systems. Furthermore, the diagonal line structure in Fig. 12.1b reveals that both trajectories run through a similar region in phase space for a certain time interval. With other words, both systems contain the same multivariate pattern, which represents that the driver hits the ‘ACCELERATOR’ pedal and the vehicle simultaneously ‘GATHERSPEED’. In Sect. 12.5, we discuss how to interpret single recurrence points and diagonal line structures, and explain how to use them to define a distance measure for time series with certain distortions or invariance.
CO R
315
j = 1...m
CT
304
333
334 335
(12.3)
y j ∈ Rd2 , i, j = 1 . . . n
RE
301
9
UN
Author Proof
12 Discovery of Driving Behavior Patterns
320439_1_En_12_Chapter ! TYPESET
DISK
LE ! CP Disp.:6/12/2014 Pages: 30 Layout: T1-Standard
S. Spiegel
Author Proof
10 140 120
(a)
100 80
OO F
dfcghGATHERSPEEDlmknhDECELERATEghfkd rsqtpACCELERATORxywzvBRAKEPEDALtvswr
140 120 100 80
PR
kdhfSLOWDOWNglbkchdgfGATHERSPEEDnkml tpsBRAKEPEDALzrysxtwvACCELERATORxtwv
ED
(b)
RE
CT
60
dfcghGATHERSPEEDlmknhDECELERATEghfkd rsqtpACCELERATORxywzvBRAKEPEDALtvswr
ASCii Encoding
60
kdhfSLOWDOWNglbkchdgfGATHERSPEEDnkml tpsBRAKEPEDALzrysxtwvACCELERATORxtwv
12.5 Recurrence Quantification
UN
336
CO R
Fig. 12.1 a ASCii decimal encoding of two multivariate time series x and y which contain the same pattern or string sequence at different positions in time. b Joint cross recurrence plot (JCRP) of time series x and y, introduced in a, with ϵ = 0. The diagonal line structure in the recurrence plot indicates the existence and position of a co-occurring multivariate pattern. The single recurrence points can be considered as noise
337 338
339 340
Recurrence quantification analysis (RQA) is used to quantify the structures observed in recurrence plots [21]. RQA is grounded in theory, but possesses statistical utility in dissecting and diagnosing nonlinear dynamic systems across multiple fields of science [38]. The explicit mathematical definition to distinct features in recurrence 320439_1_En_12_Chapter ! TYPESET
DISK
LE ! CP Disp.:6/12/2014 Pages: 30 Layout: T1-Standard
343 344 345 346 347 348 349 350 351
"N
l=l
DET(ϵ, lmin ) = " Nmin
352
353
355
364 365 366 367 368 369 370 371 372 373 374 375
376 377
(12.6)
where P(ϵ, l) is the histogram of diagonal lines of length l with respect to a certain ϵ neighborhood. In general, processes with chaotic behavior cause none or short diagonals, whereas deterministic processes cause relatively long diagonals and less single, isolated recurrence points [21, 37]. In respect to JCRPs, diagonal lines usually occur when the trajectory of two multivariate time series segments is similar according to a certain threshold. Since we aim to measure the similarity between time series that contain segments of similar trajectories at arbitrary positions, which in turn cause diagonal line structures, we propose to use determinism as a similarity measure. According to the introduced JCRP approach, a high DET value indicates high similarity or rather a high percentage of multivariate segments with similar trajectory, whereas a relatively low DET value suggests dissimilarity or rather the absence of similar multivariate patterns. However, data preprocessing like smoothing can introduce spurious line structures in a recurrence plot that cause high determinism value. In this case, further criteria like the directionality of the trajectory should be considered to determine the determinism of a dynamic system, e.g., by using iso-directional and perpendicular RPs [19, 21, 23]. In contrast to traditional recurrence plots, perpendicular recurrence plots (PRPs) consider the dynamical evolution of only the neighborhoods in the perpendicular direction to each phase flow, resulting in plots with lines of the
RE
363
$ % × 1 − Ri+l, j+l (ϵ) ' l−1 & × Ri+k, j+k (ϵ)
CO R
361
(12.5)
k=0
357
362
Ri, j (ϵ)
CT
356
360
i, j=1
ED
i, j=1
358
l · P(ϵ, l)
N ! # $ % 1 − Ri−1, j−1 (ϵ) P(ϵ, l) =
354
359
OO F
342
plots enables us to analyze signals that are multivariate, nonlinear, nonstationary, and noisy. The global (large-scale) appearance of a RP can give hints on stationarity and regularity, whereas local (small-scale) patterns are related to dynamical properties, such as determinism [38]. Recent studies have shown that determinism, the percentage of recurrence points that form lines parallel to the main diagonal, reflects the predictability of a dynamical system [21]. Given a recurrence matrix R with N × N entries generated by any of the introduced recurrence plot variations, such as our proposed JCRP, we can compute the determinism DET(ϵ, lmin ) for a predefined ϵ-threshold and a minimum diagonal line length lmin as followed [19, 21]:
PR
341
11
UN
Author Proof
12 Discovery of Driving Behavior Patterns
320439_1_En_12_Chapter ! TYPESET
DISK
LE ! CP Disp.:6/12/2014 Pages: 30 Layout: T1-Standard
379 380 381 382 383
similar width without spreading out in various directions. Removing spurious widths makes it more reasonable to define line-based quantification measures, such as divergence and determinism [3]. Another solution is to estimate the entropy by looking at the distribution of the diagonal lines [23]. The entropy is based on the probability p(ϵ, l) that diagonal lines structures with certain length l and similarity ϵ occur in the recurrence matrix [19, 21], and can be computed as follows: ENTR(ϵ, lmin ) = −
384
N #
OO F
378
S. Spiegel
p(ϵ, l) ln p(ϵ, l)
l=lmin
(12.7)
399
12.6 Recurrence Plot-Based Distance
391 392 393 394 395 396 397
400 401 402
403
404 405 406 407 408
ED
390
CT
389
RE
387 388
According to our formalization of joint cross recurrence (JCR) in Eq. 12.4 and the denotation of the determinism (DET) in Eq. 12.5, we can define our RecuRRence Plot-based (RRR) distance measure as follows:
CO R
386
PR
398
Recurrence plots (RPs) and corresponding recurrence quantification analysis (RQA) measures have been used to detect transitions and temporal deviations in the dynamics of time series. Since detected variations in RQA measures can easily be misinterpreted, Marwan et al. [20] have proposed to calculate a confidence level to study significant changes. They formulated the hypothesis that the dynamics of a system do not change over time, and therefore the RQA measures obtained by the sliding window technique will be normally distributed. Consequently, if the RQA measures are out of a predefined interquantile range, an observation can be considered significantly. Detecting changes in dynamics by means of RQA measures obtained from a sliding window have been proven to be useful in real-life applications such as comparing traffic flow time series under fine and adverse weather conditions [37]. Since recurrence plot-based techniques are still a rather young field in nonlinear time series analysis, systematic research is necessary to define reliable criteria for the selection of parameters, and the estimation of RQA measures [23].
385
RRR(ϵ, lmin ) = 1 − DET(ϵ, lmin )
409 410
411
(12.8)
Since the DET value ranges from 0 to 1, depending on the proportion of diagonal line structures found in a JCR plot, the RRR distance is 0 if the trajectory of both dynamical systems is identical and 1 if there are no similar patterns at any position in time. Although our proposed RRR distance measure can be used as a subroutine for various time series mining tasks, this work primarily focuses on clustering. Our aim is to group a set of t unlabeled time series T into k clusters C with centroids Z . In order to evaluate the performance of the time series clustering with respect to our RRR distance, we suggest to quantify the number of similar patterns that recur
UN
Author Proof
12
320439_1_En_12_Chapter ! TYPESET
DISK
LE ! CP Disp.:6/12/2014 Pages: 30 Layout: T1-Standard
412 413 414
13
within the established clusters. Therefore, we define the following cluster validation index: 1 # # E(k) = RRR(z, c) (12.9) t −k
416 417 418 419 420
According to our problem setting, the more patterns occur jointly when comparing each centroid z ∈ {Z } with all objects c ∈ {C z \z} of the corresponding cluster, the lower E, the better our clustering, and the more characteristic are the corresponding prototypes. Furthermore, we are going to evaluate the clustering of time series according to the index I [24], whose value is maximized for the optimal number of clusters: 1 E(1) · Dk ) p I (k) = ( · k E(k)
PR
415
OO F
z∈{Z } c∈{C z \z}
421
424 425 426 427 428 429
The index I is a composition of three factors [24], namely 1/k, E(1)/E(k), and Dk . The first factor will try to reduce index I as the number of clusters k increases. The second factor consists of the ratio of E(1), which is constant for a given dataset, and E(k), which decreases with increase in k. Consequently, index I increases as E(k) decreases, encouraging more clusters that are compact in nature. Finally, the third factor, Dk (which measures the maximum separation between two clusters over all possible pairs of clusters), will increase with the value of k, but is bounded by the maximum separation between two points in the dataset.
ED
423
CT
422
(12.10)
k
Dk = max ||z i − z j ||
430
i, j=1
(12.11)
437
12.7 Dimensionality Reduction
433 434 435
438 439 440
CO R
432
RE
436
Thus, the three factors are found to compete with and balance each other critically. The power p is used to control the contrast between the different cluster configurations. Previous work [24] suggests to choose p = 2. The index I has been found to be consistent and reliable, irrespective of the underlying clustering technique and data dimensionality, and furthermore has been shown to outperform the Dunn and David-Bouldin index [24].
431
As with most problems in computer science, the suitable choice of representation greatly affects the ease and efficiency of time series data mining [15]. Piecewise Aggregate Approximation (PAA), a popular windowed averaging technique, reduces a time series x of length n to length n/r by dividing the data into r equal sized frames. The mean value of the data falling within a frame is calculated and a vector of these values becomes the data-reduced representation.
UN
Author Proof
12 Discovery of Driving Behavior Patterns
441 442 443
320439_1_En_12_Chapter ! TYPESET
DISK
LE ! CP Disp.:6/12/2014 Pages: 30 Layout: T1-Standard
S. Spiegel n
445
r n
i = 1 . . . r,
446
(12.12)
xj
j= nr (i−1)+1
j = 1...n
OO F
xi =
444
ri #
458
12.8 Adjustment Window Condition
454 455 456
459 460 461 462 463 464 465 466 467 468 469 470
471 472 473 474
475
ED
453
Another approach to reduce the computational complexity of our proposed recurrence plot-based (RRR) time series distance measure is to constrain the number of cells that are evaluated in the distance matrix [30]. Constraints have been successfully applied to the Dynamic Time Warping (DTW) distance to create tight lower bounds which allow to prune similarity calculations [8, 11]. The two most commonly used constraints are the Itakura Parallelogram [6] and the Sakoe-Chiba Band [29], which both speed up calculations by a constant factor, but still lead to quadratic complexity if the window size w is a linear function of the time series. Given the formal definition of (joint) cross recurrence (see Eqs. 12.2 and 12.4), the Sakoe-Chiba Band is an adjustment window condition which corresponds to the fact that time-axis fluctuations in usual cases never causes a too excessive timing difference [29]:
CT
451 452
RE
450
CO R
448 449
PR
457
The PAA dimensionality reduction is intuitive and simple, yet has been shown to rival more sophisticated dimensionality reduction techniques like Fourier transforms and wavelets [15]. Having transformed a time series database into PAA, we can apply our proposed recurrence plot-based time series distance measure on the reduced representation. Since the computational complexity of our RRR distance measure is quadratic in the length n of the time series, reducing the original time series to r dimensions leads to a performance improvement of factor (n/r )2 . In our experiments on the real-life vehicular data we use a compression rate of n/r = 10, which correspond to a speedup of two orders of magnitude or rather 100 times less matrix entries to compute. However, this approach comes with the cost of missing recurrences [23].
447
|i − j| ≤ w
∀ xi , y j ∈ Rd , i = 1 . . . N ,
(12.13) j = 1... M
In general, constraints work well in domains where time series have only a small variance, but perform poorly if time series are of events that start and stop at radically different times [30]. Since this study considers time series that exhibit recurring patterns at arbitrary positions, we refrain from applying constraints for the data under study.
UN
Author Proof
14
476 477
478 479
320439_1_En_12_Chapter ! TYPESET
DISK
LE ! CP Disp.:6/12/2014 Pages: 30 Layout: T1-Standard
480
15
12.9 Evaluation
486
12.9.1 Order-Invariance
491 492 493 494 495 496 497 498 499 500 501 502 503 504 505 506 507 508 509 510 511 512 513 514
PR
489 490
ED
488
In this section, we demonstrate the practicality of our proposed RRR distance on a sample dataset of synthetic time series. As illustrated in Fig. 12.2a, we consider four different normally distributed pseudorandom time series with artificially implanted sinus patterns. The first two time series comprise the same subsequences in reverse order, whereas the last two time series contain a subset of the artificially implanted signals. Figure 12.2b illustrates the cross recurrence plot (CRP) of time series ABCD and DCBA as well as ABCD and A**D introduced in Fig. 12.2a. Lines parallel to the main diagonal (from upper left to bottom right corner) indicate similar subsequences in both time series. The percentage of recurrence points that form diagonal lines is much higher in the CRP of the time series ABCD and DCBA than in the CRP of the pair ABCD and A**D. As discussed in Sect. 12.6, we quantify the local smallscale structures in the recurrence plots by means of the determinism DET (refer to Eq. 12.5). Figure 12.2c shows a direct comparison of Dynamic Time Warping and our introduced RRR distance measure. As expected, the hierarchical cluster tree generated by means of DTW indicates a relatively small distance between the time series ABCD, A**D and *BC*, because they exhibit similar subsequences at the same positions. However, DTW treats the time series DCBA as an outlier, because the artificially implanted patterns occur in reverse order and cross-alignment is prevented. In contrast, the RRR measure considers the time series ABCD and DCBA as most similar, as the order of the matched patterns is disregarded. Furthermore, the dendrogram generated by means of RRR reveals that the time series A**D and *BC* are dissimilar to ABCD and DCBA, which is due to the fact that the overlap of same or similar subsequences is relatively small (≤50 %). The results presented in Fig. 12.2 serve to demonstrate that the proposed RRR distance measure is able to handle time series with order-invariance. In the following, we investigate the capability of our RRR measure to cluster time series which exhibit same or similar subsequences at arbitrary positions in time.
CT
487
RE
484
CO R
483
OO F
485
The goal of our evaluation is to assess how well the RRR distance is suited for: (i) calculating the similarity between time series with order-invariance (in Sect. 12.9.1), (ii) clustering time series that contain similar trajectories at arbitrary positions (in Sect. 12.9.2), and (ii) identifying prototypical time series that cover as much as possible patterns which co-occur in other sequences of the dataset (in Sect. 12.9.3).
481 482
UN
Author Proof
12 Discovery of Driving Behavior Patterns
515
320439_1_En_12_Chapter ! TYPESET
DISK
LE ! CP Disp.:6/12/2014 Pages: 30 Layout: T1-Standard
ABCD
A
B
C
D
DCBA
D
C
B
A
A**D
A
D
OO F
(a)
*BC*
C
B
ED
ABCD
ABCD
PR
(b)
CT
DCBA
(c) ABCD
RE
A**D
A**D
ABCD
DCBA
*BC*
A**D
DCBA
*BC*
CO R
19
19.5
20
DTW
0.75 0.8 0.85 0.9 0.95
RRR
Fig. 12.2 a Sample dataset of normally distributed pseudorandom time series (named as ABCD, DCBA, A**D and *BC*, illustrated left) with artificially implanted sinus patterns (labeled as A–D, presented in their occurring order on the right). b Cross Recurrence Plot (CRP) of synthetic time series ABCD and DCBA (left) as well as ABCD and A**D (right) introduced in a. Note that the main diagonal runs from upper left to bottom right. c Agglomerative hierarchical cluster tree (dendrogram) of synthetic time series data (introduced in a) according to the DTW distance (left) and our proposed RRR distance (right), where the x-axis reveals the distance between the time series being merged and the y-axis illustrates the corresponding name and shape of the signal
320439_1_En_12_Chapter ! TYPESET
DISK
LE ! CP Disp.:6/12/2014 Pages: 30 Layout: T1-Standard
B&W IN PRINT
S. Spiegel
UN
Author Proof
16
519 520 521 522 523
This controlled experiment aims at visualizing the clustering results of the proposed RRR distance measure compared to the DTW distance. We generated a labeled dataset, which consists of nine time series from three different categories, called Wave, YoYo, and Peak. Each category comprises three time series characterized by multiple occurrence of the same artificial patterns at arbitrary positions. The dataset consists of univariate time series of equal length, as shown in Fig. 12.3. To visualize the clustering results of the RRR and DTW
CT
ED
PR
(a)
CO R
RE
(b)
Fig. 12.3 Univariate a and multivariate b synthetic time series with artificially implanted patterns (red color) at arbitrary positions, where each time series belongs to one of three groups (Wave, YoYo, and Peak) 320439_1_En_12_Chapter ! TYPESET
DISK
LE ! CP Disp.:6/12/2014 Pages: 30 Layout: T1-Standard
B&W IN PRINT
517 518
12.9.2 Synthetic Data
OO F
516
17
UN
Author Proof
12 Discovery of Driving Behavior Patterns
526 527 528
(a) Wave01
YoYo01
Peak01
YoYo03
Wave03
YoYo02
Wave01
PR
YoYo01 YoYo03
Wave03
Peak03
Wave02 Peak01
Peak02 YoYo02
1.9
2
CT
RE
2xYoYo03
Peak02 Peak03
2.1
DTW
2xWave03
ED
Wave02
(b)
B&W IN PRINT
525
distance, we applied agglomerative hierarchical clustering with complete linkage on the synthetic dataset. Figure 12.4 illustrates the generated hierarchical cluster trees for both examined distance measures on the synthetic time series. The first observation to be made is that RRR perfectly recovers the cluster structure provided by the ground truth, given
OO F
524
S. Spiegel
0.7
2xYoYo01 2xYoYo03
2xWave01
2xWave01
2xYoYo01
2xWave03
2xPeak01
2xWave02
2xWave02
2xPeak01
2xPeak02
2xPeak02
2xYoYo02
2xPeak03
CO R
2xYoYo02
2
2.2 2.4
DTW
0.9
RRR
2xPeak03
1.6 1.8
0.8
0.2
0.4
0.6
0.8
RRR
UN
Author Proof
18
Fig. 12.4 Cluster tree (dendrogram) of univariate a and multivariate b synthetic time series (introduced in Fig. 12.3) according to the DTW and RRR distance. The x-axis reveals the distance between the time series being merged and the y-axis illustrates the corresponding name and shape of the time series
320439_1_En_12_Chapter ! TYPESET
DISK
LE ! CP Disp.:6/12/2014 Pages: 30 Layout: T1-Standard
19
536
12.9.3 Real-Life Data
538 539 540 541 542 543 544 545 546 547 548 549 550 551 552 553 554 555 556 557 558 559 560 561 562 563 564
This experiment aims at assessing the time series prototypes identified by the proposed RRR distance measure compared to the DTW distance. For our evaluation, we consider the VW DRIVE dataset, which consists of 124 real-life test drives recorded by one vehicle operated by seven different individuals. Test drives are represented as multivariate time series of varying length and comprise vehicular sensor data of the same observed measurements. Since we aim to identify operations profiles that characterize recurring driving behavior, we exclusively consider accelerator, speed, and revolution measurements, which are more or less directly influenced by the driver. The complete VW DRIVE dataset contains various other measurements, such as airflow and engine temperature, and can be obtained by mailing the first author of this paper. To measure the (dis)similarity of the VW DRIVE time series using our proposed RRR distance, we first need to determine the optimal similarity threshold ϵ and pattern length lmin for each of the considered measurements, such that a considerable amount of the recurring patterns is preserved. Figure 12.5 shows the determinism value for the accelerator, speed, and revolution signal in regard to different parameters settings. We can observe that for all considered signals the DET value decreases with increasing pattern length lmin and decreasing similarity threshold ϵ. Furthermore, Fig. 12.5 reveals that the speed signal is highly deterministic, meaning that the same patterns occur frequently, whereas the acceleration and revolution signal are less predictable and show more chaotic behavior. Since we aim to analyze all signals jointly by means of the proposed joint cross recurrence plot (JCRP) approach, we have to choose a pattern length or rather minimum diagonal line length lmin that is suitable for all signals. In general, we are looking for relatively long patterns with high similarity. In other words, we aim to find a parameter setting with preferably large lmin and small ϵ which results in a DET value that is above a certain threshold. To preserve the underlying characteristics or rather recurring patterns contained in examined data, at least 20 % of the recurrence points should form diagonal line structures, which corresponds to DET ≥ 0.2. Based on this criterion, we choose lmin = 5 and ϵ = 14/2/40 for the accelerator, speed, and revolution signal, respectively. Note that the individual signals were not normalized,
PR
537
ED
534
CT
533
RE
531 532
CO R
530
OO F
535
our knowledge that there are three categories. In contrast, the DTW distance fails and assigns time series of different categories to the same cluster at an early stage. The second observation to be made is that RRR is able to recover the ground truth even if a large portion of the time series is noisy. The DTW distance, however, groups time series into the same clusters, if they have globally a similar shape. Therefore, the noisy parts of the time series supersede or superimpose the relevant recurring patterns.
529
UN
Author Proof
12 Discovery of Driving Behavior Patterns
565
566 567
568
320439_1_En_12_Chapter ! TYPESET
DISK
LE ! CP Disp.:6/12/2014 Pages: 30 Layout: T1-Standard
S. Spiegel
Author Proof
20 Acceleration
1
0.6 0.4 0.2 0
9
8
eps
7
6
5
4
3
2
1
0
13 12
11
2 4 3 6 5 7 8 10 9
minL
PR
15 14 13 12 11 10
OO F
DET
0.8
15 14
Speed
1
ED
DET
0.8 0.6 0.4
0
CT
0.2
15 14 13 12 11 10
9
8
7
5
4
3
2
1
RE
eps
6
0
15 14
13 12
11
2 4 3 6 5 7 8 10 9
minL
Revolution
1
CO R
0.8
DET
0.6 0.4 0.2
UN
0
150 140 130 120 110 100 90 80 70 60 eps 5040 30 20 10
0
15 14
13 12
11
3 2 5 4 6 8 7 10 9
minL
Fig. 12.5 Determinism (DET) value for changing similarity threshold ϵ and minimum diagonal line length lmin for accelerator, speed, and revolution signal; based on the cross recurrence plots (CRPs) of 10 randomly selected pairs of tours from our DRIVE dataset. Note that the DET was averaged 320439_1_En_12_Chapter ! TYPESET
DISK
LE ! CP Disp.:6/12/2014 Pages: 30 Layout: T1-Standard
Author Proof
12 Discovery of Driving Behavior Patterns (b)
(a)
(b)
ED
PR
OO F
(a)
21
571 572 573 574 575 576 577 578 579 580 581 582 583 584
UN
585
RE
570
wherefore the ϵ-threshold represents the accelerator pedal angle, kilometers per hour, and rotations per minute. To identify prototypical time series using RRR and DTW distance respectively, we applied k-medoids clustering with random initialization. For evaluation purpose, we computed index I and E for a varying number of k prototypes. The results of index I were normalized in a way that the highest value, which indicates the optimal number of clusters, equals one. Since index E is a sum of RRR values (see Eq. 12.9) and RRR = 1 − DET, the lower E, the higher the average DET value, and the more recurring (driving behavior) patterns are comprised of the prototypes identified by the respective distance measure. Figure 12.6 shows the empirical results for clustering univariate and multivariate time series of the VW DRIVE dataset using RRR and DTW distance, respectively. Since the VW DRIVE dataset consists of ‘only’ 124 test drives recorded by one and the same vehicle, the optimal number of clusters for both RRR and DTW distance is rather small. However, the proposed RRR distance is able to find cluster configurations with lower index E values or rather prototypes with higher amount of recurring patterns than the DTW distance. In case of univariate time series (a), in particular speed measurements, RRR and DTW achieved an index E value of around 0.52 and 0.65 for the optimal number of clusters, which corresponds to a determinism value of 0.48 and 0.35, respectively. In the multivariate case (b), RRR and DTW reached an index E value of around 0.74 and 0.84 for the optimal number
CO R
569
CT
Fig. 12.6 Evaluation of RRR and DTW distance for clustering a univariate and b multivariate time series of our DRIVE dataset. We compare the index E for the number of clusters k where the (normalized) index I reaches its maximum. The results are based on 1,000 runs of k-medoids clustering with random initialization
586 587
588 589
320439_1_En_12_Chapter ! TYPESET
DISK
LE ! CP Disp.:6/12/2014 Pages: 30 Layout: T1-Standard
Author Proof
22
S. Spiegel
100
200
300
0
100
200
300
100
200
300
0
100
200
300
0
100
200
0
100
CT 300
600
500
700
600
700
500
600
700
400
500
600
700
400
500
600
700
400
500
600
700
400
300
RE 200
500
ED
Acceleration
0
Speed Revolution
400
Time
(b)
Recurrence
400
OO F
0
PR
Recurrence
Speed
(a)
Time
590 591 592 593
of clusters, which corresponds to determinism value of 0.26 and 0.16, respectively. As might be expected, the results for the univariate time series are better than for the multivariate case, because the search space expands and the probability of recurring patterns decreases with an increasing number of dimensions or measurements, respectively. In both cases, however, our RRR distance performs about 10 % better than the compared DTW distance, meaning that the identified prototypes contain 10 % more recurring (driving behavior) patterns. Figure 12.7 shows the prototype or rather medoid time series of the biggest cluster found by the k-medoids algorithm (for k = 2) in combination with our RRR distance
UN
594
CO R
Fig. 12.7 Medoid time series of biggest cluster (with k = 2) found by our RRR distance measure for a univariate and b multivariate case. The intervals highlighted in red color indicate patterns that frequently recur in the time series objects of the corresponding cluster, whereas intervals in blue indicate low recurrence
595 596
597
598
320439_1_En_12_Chapter ! TYPESET
DISK
LE ! CP Disp.:6/12/2014 Pages: 30 Layout: T1-Standard
23
603
12.10 Application
608 609 610 611 612 613 614 615 616 617 618 619 620 621 622 623 624 625 626 627 628 629
630 631 632 633 634
PR
607
ED
605 606
Having introduced our recurrence plot-based distance measure, we are eventually in the position to present BestTime, a platform-independent Matlab application with graphical user interface, which enables us to find representatives that best comprehend the recurring temporal patterns contained in a certain time series dataset. Although BestTime was originally designed to analyze vehicular sensor data and identify characteristic operational profiles that comprise frequent behavior patterns [32], our extended version [36] can be used to find representatives in arbitrary sets of single- or multi-dimensional time series of variable length. As described above, our approach to find representatives in time series datasets is based on agglomerative hierarchical clustering [14]. We define a representative as the time series that is closest to the corresponding cluster center of gravity [25]. Since we want a representative to comprehend the recurring temporal patterns contained in the time series of the respective cluster, we need a distance measure that accounts for similar subsequences regardless of their position in time [32]. However, as mentioned before, traditional time series distance measures, such as the Euclidean distance (ED) and Dynamic Time Warping (DTW), are not suitable to match similar subsequences that occur in arbitrary order [1, 4]. Hence, we proposed to employ Recurrence Plots (RPs) and corresponding Recurrence Quantification Analysis (RQA) [21, 38] to measure the pairwise (dis)similarity of time series with similar patterns at arbitrary positions [34]. Above, we introduced a novel recurrence plot-based distance measure, which is used by our BestTime tool to cluster time series and find representatives. In the following, we briefly describe the operation of our BestTime application and illustrate the data processing for a small set of sample time series, see Figs. 12.8 and 12.9. Please feel free to download our BestTime tool [36] to follow the stepwise operating instructions given below.
CT
604
RE
601
CO R
600
OO F
602
measure. In the univariate case (a) the medoid contains a high amount of patterns that recur in the time series objects of the corresponding cluster, making it an excellent prototype. As expected, in the multivariate case (b) the medoid time series contains less and shorter intervals of recurring patterns.
599
Input Data. BestTime is able to analyze multivariate time series with same dimensionality and of variable length. Each individual time series needs to be stored in an independent csv (comma separated values) file, where rows correspond to observations and columns correspond to variables. Optionally, the first row may specify the names of the variables. The user selects an input folder that should contain all time series in specified csv format. A small set of sample time series that we use as input is illustrated in Fig. 12.8.
UN
Author Proof
12 Discovery of Driving Behavior Patterns
635 636
320439_1_En_12_Chapter ! TYPESET
DISK
LE ! CP Disp.:6/12/2014 Pages: 30 Layout: T1-Standard
S. Spiegel
PR
OO F
Author Proof
B&W IN PRINT
24
Fig. 12.8 Given a set of time series with previously unknown patterns, we aim to cluster the data and find a representative (highlighted) for each group
641 642 643 644 645 646 647 648 649 650 651 652 653 654 655 656 657 658
UN
659
ED
640
CT
639
RE
638
Minimum Number of Observations. Depending on the application, the user can optionally reduce the size of the dataset by specifying the minimum length of the time series which should be consider for further processing. Data Reduction Rate. Since the computational complexity of our distance calculations is quadratic in the length of the time series, we offer the possibility to reduce the length via piecewise aggregate approximation [4]. Given a time series of length n and a reduction rate r , the approximate time series is of length n/r . Minimum Pattern Length. As described in Sect. 12.9, the predetermined minimum pattern length lmin directly influences the time series similarity. This parameter strongly depends on the application and needs to be chosen by a domain expert. Variable Selection. In case of time series datasets with multiple dimensions, the user interface of our tool offers the possibility to select the variables that should be considered for further analysis. Similarity Threshold. This parameter is usually very sensitive and directly influences the clustering result. Since it may be challenging to determine an appropriate similarity threshold ϵ for each variable, our tool can alternatively recommend (estimated) thresholds. Parallel Computing. Calculating the distance matrix is costly for large datasets. However, this step is fully parallelized and runs almost n CPU -times faster than serial processing. Up to 12 parallel workers are supported. Quality Control. Our tool presents a colored plot of the computed distance matrix and a histogram of the distance distribution in order to ensure appropriate parameter settings as well as clusters that preserve the time series characteristics. Since both plots are updated iteratively during distance calculations, we can abort computation anytime the preview suggests undesired results. For the distance matrix, a high variance in the distances/colors indicates an appropriate parameter setting, and a low variance in the distances/colors may result in poor clustering. In general,
CO R
637
660
661 662 663
320439_1_En_12_Chapter ! TYPESET
DISK
LE ! CP Disp.:6/12/2014 Pages: 30 Layout: T1-Standard
B&W IN PRINT
25
OO F
(a)
CT
ED
PR
(b)
CO R
RE
(c)
Fig. 12.9 BestTime operation and data processing for finding representatives in time series datasets, exemplified on sample time series introduced in Fig. 12.8. a Visualization of computed distance matrix and distance distribution, which are used to ensure both appropriate parameter settings and clusters that preserve the time series characteristics. b Clustering results which show various validation indexes for a changing number of clusters, the list of identified representatives for a selected number of clusters, and the cardinality of the individual clusters. c Detailed view of a representative and its corresponding pattern frequency with regard to the selected cluster
UN
Author Proof
12 Discovery of Driving Behavior Patterns
320439_1_En_12_Chapter ! TYPESET
DISK
LE ! CP Disp.:6/12/2014 Pages: 30 Layout: T1-Standard
666 667 668 669 670 671 672 673 674 675 676 677 678
OO F
665
good clustering results can be achieved when the distances do not accumulate at either end of the interval (all close to zero or one). Figure 12.9a shows the quality control for our sample dataset. Clustering Validation. To support the user in choosing an optimal number of k clusters or representatives, our tool validates the cluster goodness for changing k according to three cluster validation indexes. Figure 12.9b shows the cluster validation for our sample dataset. Cluster Distribution. The clustering may result in groups of different size. Our tool illustrates the cluster distribution to identify outliers and emphasize prominent groups with expressive representatives. For our sample dataset all clusters have the same size, see Fig. 12.9b. List of Representatives. Since we aim at finding representatives, our tool does not only show a list of identified candidates as illustrated in Fig. 12.9b, but also allows to visualize the time intervals or patterns that co-occur in other time series of the same cluster, see Fig. 12.9c.
PR
664
S. Spiegel
681 682 683 684 685 686 687 688 689 690 691 692 693
This work is a first attempt to solve time series clustering with nonlinear data analysis and modeling techniques commonly used by theoretical physicists. We adopted recurrence plots (RPs) and recurrence quantification analysis (RQA) to measure the (dis)similarity of multivariate time series that contain segments of similar trajectories at arbitrary positions and in different order. Strictly speaking, we introduced the concept of joint cross recurrence plots (JCRPs), a multivariate extension of traditional RPs, to visualize and investigate recurring patterns in pairwise compared time series. Furthermore, we defined a recurrence plot-based (RRR) distance measure to cluster (multivariate) time series with order invariance. The proposed RRR distance was evaluated on both synthetic and real-life time series, and compared with the DTW distance. Our evaluation on synthetic data demonstrates that the RRR distance is able to establish cluster centers that preserve the characteristics of the (univariate and multivariate) sample time series. The results on real-life vehicular data show that, in terms of our cost function, RRR performs about 10 % better than DTW, meaning that the determined prototypes contain 10 % more recurring driving behavior patterns. In addition, we have introduced BestTime, a Matlab tool, which implements our RRR distance to find time series representatives that best comprehend the recurring
RE
680
12.11 Conclusion and Future Work
CO R
679
CT
ED
Please note that we provide supplementary online material [36], which includes our BestTime tool for finding time series representatives, real-life testing data, a video demonstration, and a technical report.
UN
Author Proof
26
694
695 696
697
698
320439_1_En_12_Chapter ! TYPESET
DISK
LE ! CP Disp.:6/12/2014 Pages: 30 Layout: T1-Standard
700 701 702 703 704 705 706
temporal patterns in a corresponding dataset. Although BestTime was originally designed to analyze vehicular sensor data [32], our extended version [36] can be used to find representatives in arbitrary sets of single- or multi-dimensional time series of variable length. Worthwhile future work includes (1) the investigation of RQA measures which quantify recurring patterns with uniform scaling, (2) the application of speed-up techniques for RP computations, and (3) the formalization/analysis of a RP-based distance metric.
OO F
699
27
712
References
715 716 717 718 719 720 721 722 723 724 725 726 727 728 729 730 731 732 733 734 735 736 737 738 739
ED
714
1. G.E.A.P.A. Batista, X. Wang, E.J. Keogh, A complexity-invariant distance measure for time series, in SDM, pp. 699–710 (2011) 2. B.Y. chi Chiu, E.J. Keogh, S. Lonardi, Probabilistic discovery of time series motifs, in KDD, pp. 493–498 (2003) 3. J.M. Choi, B.H. Bae, S.Y. Kim, Divergence in perpendicular recurrence plot; quantification of dynamical divergence from short chaotic time series. Phys. Lett. A 263(4–6), 299–306 (1999) 4. H. Ding, G. Trajcevski, P. Scheuermann, X. Wang, E.J. Keogh, Querying and mining of time series data: experimental comparison of representations and distance measures. PVLDB 1(2), 1542–1552 (2008) 5. B. Hu, Y. Chen, E.J. Keogh, Time series classification under more realistic assumptions, in SDM (2013) 6. F. Itakura, Minimum prediction residual principle applied to speech recognition. IEEE Trans. Acoust. Speech Signal Process. 23(1), 67–72 (1975) 7. E.J. Keogh, J. Lin, A.W.-C. Fu, Hot Sax: efficiently finding the most unusual time series subsequence, in ICDM, pp. 226–233 (2005) 8. E.J. Keogh, C.A. Ratanamahatana, Everything you know about dynamic time warping is wrong, in KDD (2004) 9. E.J. Keogh, Q. Zhu, B. Hu, Y. Hao, X. Xi, L. Wei, C.A. Ratanamahatana, The UCR time series classification/clustering homepage (2011), www.cs.ucr.edu/~eamonn/time_series_data/ 10. E.J. Keogh, S. Kasetty, On the need for time series data mining benchmarks: a survey and empirical demonstration. Data Min. Knowl. Discov. 7(4), 349–371 (2003) 11. E.J. Keogh, C.A. Ratanamahatana, Exact indexing of dynamic time warping. Knowl. Inf. Syst. 7(3), 358–386 (2005) 12. E.J. Keogh, J. Lin, Clustering of time-series subsequences is meaningless: implications for previous and future research. Knowl. Inf. Syst. 8(2), 154–177 (2005) 13. M. Kumar, N.R. Patel, J. Woo, Clustering seasonality patterns in the presence of errors, in KDD (2002) 14. T.W. Liao, Clustering of time series data—a survey. J. Pattern Recognit. 38(11), 1857–1874 (2005) 15. J. Lin, E.J. Keogh, S. Lonardi, B.Y. chi Chiu, A symbolic representation of time series, with implications for streaming algorithms, in SIGMOD, pp. 2–11 (2003) 16. J. Lin, E.J. Keogh, S. Lonardi, P. Patel, Finding motifs in time series, in KDD (2002)
CT
713
RE
709 710
CO R
708
PR
711
Acknowledgments The proposed recurrence plot-based distance measure for clustering multivariate time series was developed in cooperation with the Volkswagen AG, Wolfsburg. Thanks to Bernd Werther and Matthias Pries (from the Volkswagen AG) for their contribution of expert knowledge and their help in recording vehicular sensor data. The presented BestTime application was developed in cooperation with David Schultz at DAI-Labor.
707
UN
Author Proof
12 Discovery of Driving Behavior Patterns
740
741 742
743 744
320439_1_En_12_Chapter ! TYPESET
DISK
LE ! CP Disp.:6/12/2014 Pages: 30 Layout: T1-Standard
752 753 754 755 756 757 758 759 760 761 762 763 764 765 766 767 768 769 770 771 772 773 774 775 776 777 778 779 780 781 782 783 784 785 786 787 788 789 790 791 792
OO F
750 751
PR
749
ED
748
CT
747
17. J. Lines, A. Bagnall, P. Caiger-Smith, S. Anderson, Classification of household devices by electricity usage profiles, in IDEAL, pp. 403–412 (2011) 18. N. Marwan, Encounters with Neighbours: Current Developments of Concepts Based on Recurrence Plots and their Applications. Ph.D. thesis, University of Potsdam (2003) 19. N. Marwan, M. Romano, M. Thiel, Recurrence plots and cross recurrence plots. www. recurrence-plot.tk 20. N. Marwan, S. Schinkel, J. Kurths, Recurrence plots 25 years later—gaining confidence in dynamical transitions. Europhys. Lett. 101(2), (2013) 21. N. Marwan, M. Romano, M. Thiel, J. Kurths, Recurrence plots for the analysis of complex systems. Phys. Rep. 438(5–6), 237–329 (2007) 22. N. Marwan, A historical review of recurrence plots. Eur. Phys. J. Spec. Top. 164(1), 3–12 (2008) 23. N. Marwan, How to avoid potential pitfalls in recurrence plot based data analysis. Int. J. Bifurc. Chaos 21(4), 1003–1017 (2011) 24. U. Maulik, S. Bandyopadhyay, Performance evaluation of some clustering algorithms and validity indices. IEEE Trans. Pattern Anal. Mach. Intell. 24(12), 1650–1654 (2002) 25. W. Meesrikamolkul, V. Niennattrakul, C.A. Ratanamahatana, Shape-based clustering for time series data, in PAKDD, pp. 530–541 (2012) 26. C.S. Moeller-Levet, F. Klawonn, K.-H. Cho, O. Wolkenhauer, Fuzzy clustering of short timeseries and unevenly distributed sampling points, in LNCS, Proceedings of the IDA2003, pp. 28–30 (2003) 27. T. Rakthanmanon, B.J.L. Campana, A. Mueen, G. Batista, M.B. Westover, Q. Zhu, J. Zakaria, E.J. Keogh, Searching and mining trillions of time series subsequences under dynamic time warping, in KDD, pp. 262–270 (2012) 28. T. Rakthanmanon, E.J. Keogh, Fast-shapelets: a scalable algorithm for discovering time series shapelets, in SDM (2013) 29. H. Sakoe, S. Chiba, Dynamic programming algorithm optimization for spoken word recognition. Trans. Acoust. Speech Signal Process. 26(1) (1978) 30. S. Salvador, P. Chan, Toward accurate dynamic time warping in linear time and space. J. Intell. Data Anal. 11(5), 561–580 (2007) 31. A.P. Schultz, Y. Zou, N. Marwan, M.T. Turvey, Local minima-based recurrence plots for continuous dynamical systems. Int. J. Bifurc. Chaos 21(4), 1065–1075 (2011) 32. S. Spiegel, S. Albayrak, An order-invariant time series distancemeasure—position on recent developments in time series analysis, in Proceedings of 4th International Conference on Knowledge Discovery and Information Retrieval (KDIR) (SciTePress, 2012), pp. 264–268 33. S. Spiegel, J. Gaebler, A. Lommatzsch, E. De Luca, S. Albayrak, Pattern recognition and classification for multivariate time series, in Proceedings of the 5th International Workshop on Knowledge Discovery from Sensor Data, SensorKDD’11 (ACM, New York, 2011), pp. 34–42 34. S. Spiegel, B.-J. Jain, S. Albayrak, A recurrence plot-based distance measure, in Springer Proceedings in Mathematics—Translational Recurrences: From Mathematical Theory to RealWorld Applications (2014). To appear 35. S. Spiegel, B.-J. Jain, E. De Luca, S. Albayrak, Pattern recognition in multivariate time series— dissertation proposal, in Proceedings of 4th Workshop for Ph.D. Students in Information and Knowledge Management (PIKM), CIKM’11 (ACM, 2011) 36. S. Spiegel, D. Schultz, M. Schacht, S. Albayrak, Supplementary onlinematerial—besttime App, test data, video demonstration. Technical report: www.dai-lab.de/spiegel/besttime.html (2013) 37. E.I. Vlahogianni, M.G. Karlaftis, Comparing traffic flow time-series under fine and adverse weather conditions using recurrence-based complexity measures. J. Nonlinear Dyn. 69(4), 1949–1963 (2012) 38. C.L. Webber, N. Marwan, A. Facchini, A. Giuliani, Simpler methods do it better: success of recurrence quantification analysis as a general purpose data analysis tool. Phys. Lett. A 373(41), 3753–3756 (2009)
RE
746
CO R
745
S. Spiegel
UN
Author Proof
28
793
794 795 796
797
320439_1_En_12_Chapter ! TYPESET
DISK
LE ! CP Disp.:6/12/2014 Pages: 30 Layout: T1-Standard
798 799 800
39. A. Wismueller, O. Lange, D.R. Dersch, G.L. Leinsinger, K. Hahn, B. Puetz, D. Auer, Cluster analysis of biomedical image time-series. Int. J. Comput. Vis. 46(2), 103–128 (2002) 40. J. Zakaria, A. Mueen, E.J. Keogh, Clustering time series using unsupervised-hapelets, in ICDM, pp. 785–794 (2012)
CO R
RE
CT
ED
PR
OO F
801
29
UN
Author Proof
12 Discovery of Driving Behavior Patterns
320439_1_En_12_Chapter ! TYPESET
DISK
LE ! CP Disp.:6/12/2014 Pages: 30 Layout: T1-Standard