Available online at www.sciencedirect.com
ScienceDirect Procedia - Social and Behavioral Sciences 174 (2015) 3868 – 3872
INTE 2014
Undergraduate programming courses, students’ perception and success Divna Krpan*a, Saša Mladenovića, Marko Rosića, a
Faculty of Science, University of Split, Teslina 12, Split, Croatia
Abstract Learning programming at university level is the challenge for both students and teachers, especially for students without previous exposure to programming. Most of the programming courses are compulsory and tough to learn for novice programmers. Students lack the understanding of basic programming concepts and algorithms and find programming difficult. Early failure of understanding important concepts weakens students’ confidence and increases drop-out rate. Students’ success rate and perception during most important programming courses at the undergraduate level at the Faculty of Science, University of Split over extended period of time were analyzed. Results of this research are presented in this paper. © byby Elsevier Ltd.Ltd. This is an open access article under the CC BY-NC-ND license © 2015 2014The TheAuthors. Authors.Published Published Elsevier (http://creativecommons.org/licenses/by-nc-nd/4.0/). Peer-review under responsibility of the Sakarya University. Peer-review under responsibility of the Sakarya University
Keywords:Novice programmers; undergraduate programming courses; learning and teaching programming
1. Introduction Programming is challenging subject for learning and teaching. Introductory programming courses at the universities are very important since they are responsible for students’ acquiring of basic programming skills and knowledge. Unfortunately, they also have highest drop-out rates and we also noticed that students do not have knowledge and skills as expected even after they pass introductory programming courses. It is important to note that introductory programming courses in the literature are often “hidden” under “Computer science” title (Pears et al., 2007) (Radenski, 2006) which makes literature research more difficult.
* Corresponding author. Tel.: +385 21 385 133. E-mail address:
[email protected]
1877-0428 © 2015 The Authors. Published by Elsevier Ltd. This is an open access article under the CC BY-NC-ND license (http://creativecommons.org/licenses/by-nc-nd/4.0/).
Peer-review under responsibility of the Sakarya University doi:10.1016/j.sbspro.2015.01.1126
Divna Krpan et al. / Procedia - Social and Behavioral Sciences 174 (2015) 3868 – 3872
3869
Department of computer science at the Faculty of science (FOS), University of Split is responsible for teaching most of the programming courses for students with majors in computer science, mathematics, physics and technical science, with large number of students, especially in the introductory courses. It is not vast number of students compared to other universities in the world, but it is significant in the context of the faculty. In this paper, we examine students’ success rate and perception during most important programming courses at the FOS. In the next section we reflect on related work on programming difficulties for novice programmers and factors that might affect their learning of programming. Second section consists of data analysis and observations during three years on selected programming courses at the FOS. 2. Related work According to some researchers, students mathematical abilities often positively reflect on their programming abilities (Bennedsen, 2008), (Sauter, 1986). Hence, teachers tend to design curriculum that favors such students, while other aspect such as problem solving might be neglected. Expert programmers know more than novices, but researchers emphasize that the quantity of knowledge is not the only difference, because experts also organize their knowledge better (Lister, Simon, Thompson, Whalley, & Prasad, 2006). Novice programmers have a tendency of making context specific programs and demonstrate superficial knowledge of programming concepts (Lahtinen, Ala-Mutka, & Järvinen, 2005). They learn syntax and little pieces of code, but lack the ability to put all the pieces of the program together. Researchers in (Hawi, 2010) emphasize ten factors that affected their students, and some of those factors that we also noticed through observation and interviews with our students were: “learning strategy”, “lack of study”, “lack of practice”, “teaching method”, “exam anxiety” and “cheating”. Some of those factors were also noted in (Bennedsen, 2008) as predictors of success for programming. Students have additional difficulties with abstract thinking. In the research conducted by (Eckerdal, Thun, & Berglund, 2005), students were interviewed with the purpose of determining if they understood what learning programming means. Many students stated it is special way of thinking, but were not able to describe in detail. In the next section, we analyze success rate for students at the FOS during three academic years in order to determine if there is correlation between introductory programming courses in first and second semester and introductory mathematical courses, and to examine success rate on following programming courses. 3. Undergraduate programming courses research First year undergraduate students at the FOS have very few (if any) programming skills and knowledge. Some of those students enrolled major in computer science, and it is important to note that computer science study programme is for future school teachers of computer science. Knowing that, task for their teachers seems much more difficult since they have to teach adult novice programmers how to learn programming and also how to teach other novice programmers. Besides computer science majors, other students with major in physics, technical science and mathematics (or double major students with the combination of two subject) attend programming courses. That increases problems for teachers since different student groups (or student types) might require different approaches but curriculum is the same. Each of two semesters at the FOS consists of 15 weeks. Most of the programming courses consist of two school hours (45 minutes) of lectures per week and two school hours of labs per week. During first semester, all students enroll introductory programming course Programming I (P1), and during second semester they enroll course Programming II (P2). During course P1 students learn procedural programming in Python as soft introduction to programming. Students find that course difficult since most of them learn programming for the first time. Second semester during P2 is still introductory, but P2 is “crossover” course between procedural programming and introductory object-oriented programming in C#. First half of P2 is sort of “crash course” in C# syntax with console applications and similar assignments and concepts covered in P1, then followed by second half of semester when students get introduced to graphical user interface.
3870
Divna Krpan et al. / Procedia - Social and Behavioral Sciences 174 (2015) 3868 – 3872
3.1. Data collection and analysis We collected data from all enrolled students during three academic years and most important (and challenging) programming courses at the FOS: Programming I, Programming II, Data structures and algorithms (DSA), Object oriented programming (OOP), Computer Architecture (CA), Databases (DB), Problem solving (PS) and Network Application Programming (NAP). Since we already stated that some researchers consider mathematical abilities very important in programming, we also analyzed information on two first mathematical courses: Mathematics I (M1) and Mathematics II (M2), during first and second semester, respectively. In Table 1 there is an overview of pass rate for selected courses. Total number of students contains total number of students that only enrolled course for the first time, for all three years combined. Table 1. Pass rate for selected programming and mathematical courses Course
2010/11
2011/12
2012/13
All three years
Total number of students
P1
60,87 %
53,67 %
48,47 %
53,62 %
511
P2
51,08 %
44,00 %
39,09 %
44,03 %
511
DSA
86,96 %
87,69 %
72,73 %
81,92 %
177
OOP
89,32 %
79,31 %
73,85 %
81,96 %
255
CA
77,50 %
75,00 %
64,15 %
73,06 %
193
DB
100,00 %
98,44 %
83,56 %
93,12 %
189
PS
84,78 %
58,33 %
75,86 %
78,16 %
87
NAP
95,12 %
82,61 %
80,65 %
86,44 %
118
M1
50,00 %
52,52 %
21,15 %
39,55 %
397
M2
42,16 %
39,57 %
16,03 %
30,98 %
397
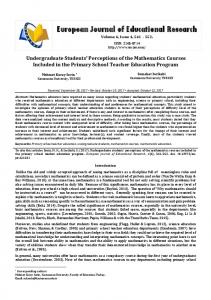
It is obvious that success rate for programming courses P1 and P2 are the lowest, like mathematical courses M1 and M2. Since all those courses have the lowest pass rate among observed courses, interrelationship between final exam grades for those four courses was further analyzed using correlation analysis (Cohen, Manion & Morrison, 2007). Correlation analysis is used for measuring association between variables and there are several simple measures which depend on data type and distribution. First step before correlation analysis is to check data distribution. There were some doubts about normality since graphical representation for each course and year diverted from normal curve (example for course M1 is on Fig. 1). Skewness coefficient was checked to determine if there is any further evidence that some variable is skewed.
Fig. 1. Histogram for course M1 (grade distribution)
Divna Krpan et al. / Procedia - Social and Behavioral Sciences 174 (2015) 3868 – 3872
3871
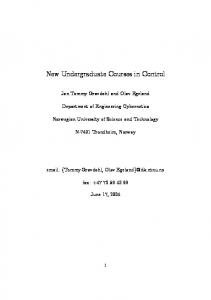
Simple check consists of examining that skewness coefficients are not too large: absolute values of the skewness coefficients should be less than two times their standard errors. Calculation for each course during each year demonstrated that data is not normally distributed (example for year 2010/11 in Fig. 2). Year=2010./2011. Descriptive Statistics (progr_i_matem) Valid N Mean Minimum Maximum Variable P1 P2 M1 M2
74 74 74 74
2,027027 1,581081 1,500000 1,432432
1,000000 1,000000 1,000000 1,000000
5,000000 5,000000 3,000000 4,000000
Std.Dev. Skewness 1,323890 0,921683 0,646381 0,723028
Std.Err. Skewness 0,968547 0,279197 1,697046 0,279197 0,938390 0,279197 1,806875 0,279197
Fig. 2. Output analysis for year 2010./2011.
Hence data was not normally distributed, correlation analysis was conducted using Spearman’s nonparametric test commonly used for ordinal data (Cohen, Manion & Morrison, 2007). Results are presented in Table 2. Table 2. Spearman’s correlation analysis Variable
P1
P2
M1
M2
P1
1,000
0,802 *
0,655 *
0,626 *
P2
0,802 *
1,000
0,685 *
0,731 *
M1
0,655 *
0,685 *
1,000
0,747 *
M2
0,626 *
0,731 *
0,746 *
1,000
All correlations marked by asterisk are significant at the level p