Electronic Supplementary Material (ESI) for Environmental Science: Processes & Impacts. This journal is © The Royal Society of Chemistry 2016
Supplementary Material 1: General information on
Understanding arsenic mobilization using reactive transport modeling of groundwater hydrochemistry in Datong Basin study plot, China Harold Wilson Tumwitike Mapoma1,2; Xianjun Xie1*; Kunfu Pi1; Yanxin Wang1**; Yaqing Liu1; Yapeng Zhu1 1School
of Environmental Studies & State Key Laboratory of Biogeology and Environmental Geology, China University of Geosciences, 430074 Wuhan, China 2Physics
and Biochemical Sciences, The Polytechnic, University of Malawi, Private Bag 303, Blantyre 3,
Malawi. Corresponding
author:
*Tel: +86-27-67883170; Fax: +86-27-87436235; Email:
[email protected] **Tel: +86-27-67883998; Fax: +86-27-87481030; Email:
[email protected]
1. General groundwater chemistry
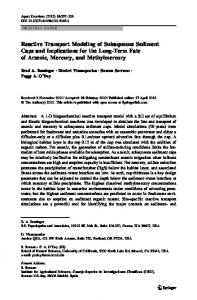
Fig. S1 Piper diagram plotted using field data from the study plot used to identify the main groundwater facies. The diagram identifies Na-HCO3 is the predominant water type consistent with various observations done in Datong basin.
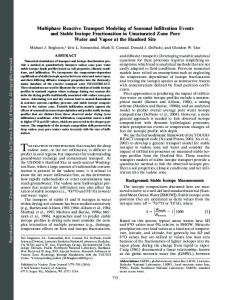
Fig. S2 Relationship between total arsenic and Fe (a), Mn (b) and ORP while total Mn is plotted against ORP (c). The correlation of As with Fe suggests that Fe is a significant factor contributing to mobilization of As in the study area under reducing conditions. Otherwise poor correlations were observed between As and Mn/ ORP. Yet, Mn inversely correlated with ORP (Figure S3d) and that higher concentration of As is observed under reducing conditions.
2. Raw Data Table S1 Raw Data in mg/L (unless where indicated) obtained from field data as explained in the main paper.
7.97
ORP (mV) -47.5
EC (μS/cm) 1512
Ca
Mg
Na
K
14.06
37.26
440.3
1.05
663.3
348.9
214
4.615
0.04
0.083
S2(µg/L) 4
A1
T (0C) 9.01
A3
8.40
7.85
-96.1
444
19.18
22.69
93.98
0.52
373.8
7.98
27.9
7.662
0.04
0.084
12
0.32
149.6
6.03
482.4
271.7
A5
8.68
8.03
-153.7
446
19.52
25.21
88.14
0.65
374.8
5.799
26.15
5.394
0.07
0.125
22
0.51
115.6
4.28
562.0
489.0
B2
8.79
8.04
-31.9
511
10.65
16.52
134.8
0.6
438.7
11.06
22.28
5.758
0.01
0.043
1
0.15
71.3
5.49
8.2
0.0
B4
8.67
8.17
-155.9
454
12.5
18.97
109.2
0.44
377.4
5.537
22.11
5.247
0.08
0.155
15
0.20
128.7
1.91
1598.1
1389.0
B5
8.81
8.08
-141
401
11.93
20.78
90.16
0.56
343.9
4.471
19.25
5.282
0.09
0.106
27
0.33
111.4
3.73
1187.4
662.5
C1
8.97
8.02
-75.8
907
11.05
17.75
252.4
0.72
489.9
105.6
83.06
4.838
0.04
0.136
15
0.28
102.1
103.00
13.1
10.9
C5
8.83
7.94
-135.5
695
15.41
18.85
158.4
0.53
479.1
36.07
26.44
5.687
0.24
0.272
30
1.53
183.8
5.85
2627.1
1885.3
D2
8.51
7.69
-221.7
1002
24.64
32.63
239.6
1.11
441.1
51.73
221.6
5.006
0.02
0.105
293
0.91
160.0
5.57
22.4
7.1
No
pH
HCO3
SO4
Cl
Si
Fe2+
Fe
0.39
Mn (µg/L) 106.1
Al (µg/L) 2.13
AsT (µg/L) 8.4
AsIII (µg/L) 1.8
NH4+
3. Mineral Reaction Kinetics and kinetics Table S2 Minerals and their solubility constants used in reactive transport simulation obtained from field data at Datong Basin Mineral
Reactions
Solubility constant (log10K) -20.119
Volume fraction
Albite
NaAlSi3O8 = Na+ + 3SiO2(aq) + AlO2-
Annite
KFe3AlSi3O10(OH)2 + 6H+ = K+ + 3Fe2+ + 3SiO2(aq) + 4H2O + AlO2-
6.5860
0.203
Calcite
CaCO3 +H+ = Ca2+ + HCO3-
1.8490
0.097
Chlorite
(Mg,Fe2+)5Al2Si3O10(OH)8 + 8H+ = 3SiO2(aq) + 2.5Fe2+ + 2.5Mg2+ + 8H2O + 2AlO2-
4.2900
0.165
Illite
K0.6Mg0.25Al2.3Si3.5O10(OH)2 = 1.2H+ 0.25Mg2+ + 0.6K+ + 3.5SiO2(aq) + 0.4H2O + 2.3AlO2-
-47.418
0.205
K-Feldspar
KAlSi3O8 = K+ + 3SiO2(aq) + AlO2-
-22.910
0.009
Montmorillonite-Na
Na0.33Mg0.33Al1.67Si4O10(OH)2 = 0.68H+ + 0.33Mg2+ + 0.33Na+ + 0.66H2O + 4 SiO2(aq) + 1.67AlO2-
-37.158
0.089
Quartz
SiO2 = SiO2(aq)
-3.7390
0.176
Mackinawite
FeS + H+ = Fe2+ + HS-
-3.6000
Orpiment
As2S3 + 6H2O = 2H2AsO3- + 3HS- + 5H+
-79.416
0.055
The reactions and solubility constants are from database used for modeling (see main paper). The volume fraction values are converted from weight percentage obtained from laboratory analysis of aquifer material using XRD analysis.
Table S3. Parameters for calculating kinetic rate constants of minerals obtained from Palandri and Kharaka's open file1 Mineral
Acid Mechanism
Neutral Mechanism
k25 (mol/ cm/ s)
E (KJ/ mol)
n(H+)
k25
Albite
6.9183 x 10⁻¹¹
65.0
0.457
2.7542 x 10⁻¹³
Annite
1.4100 x 10⁻¹²
22.0
0.37
Chlorite
7.7620 x 10⁻¹²
88
Illite
1.0500 x 10⁻¹¹
K-feldspar Montmorillonite-Na
Base Mechanism E
k25
E
n(H+)
A
69.8
2.5119 x 10⁻¹⁶
71
-0.572
9.8
2.8200 x 10⁻¹⁴
22.0
2.8200 x 10⁻¹⁵
22
-0.22
9.8
0.5
3.0200 x 10⁻¹³
88
23.6
0.34
1.6600 x 10⁻¹³
35.0
3.0200 x 10⁻¹⁷
59
-0.4
8.7096 x 10⁻¹¹
51.7
0.5
3.8905 x 10⁻¹³
38.0
6.3096 x 10⁻²²
94
-0.823
1.9498 x 10⁻¹³
48.0
0.22
3.8905 x 10⁻¹⁵
48.0
3.8905 x 10⁻¹⁵
48
-0.13
1.0233 x 10⁻¹⁴
87.7
Calcite
Quartz
151.6 151.6 9.8 151.6 9.8
NOTE: k25 is the rate constant at 25 °C, E is the activation energy, n is a power term (constant) for both acid and base mechanism with respect to H+ and A is specific surface area. Calcite and chlorite were allowed to react at equilibrium
4. Aqueous Complexes The list of aqueous complexes used in this study can be obtained from the text file (Chemical.out) accompanying the manuscript.
5. XRD Results Figure S1 provides evidence of XRD analysis as stated in the manuscript. The methodology behind XRD as used in Datong Basin is available in Gao et al.2 Explanation of the outcome is beyond the scope of this manuscript.
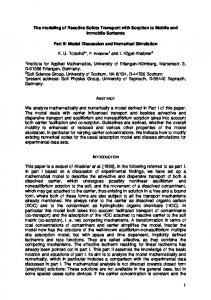
Fig. S3 XRD output used to obtain mineral volume fraction for Datong Basin aquifer sediments. The Minerals (weight perecent) identified from the XRD analysis are albite (6%), annite (17%), calcite (10%), chlorite (16%), illite (22%), K-feldspar (1%), montimorillonite (10%) and quartz (18%).
Fig. S4 Percentage change in volume fraction of chlorite which displays incongruent dissolution with annite (main article)
References 1. 2.
J. L. Palandri and Y. K. Kharaka, A compilation of rate parameters of water-mineral interaction kinetics for application to geochemical modeling, DTIC Document, 2004. X. Gao, C. Su, Y. Wang and Q. Hu, Journal of Geochemical Exploration, 2013, 135, 93-103.