Jun 14, 2007 - [access] the information that [anyone] has added to it" - a sort of world-as-wiki model. At the personal level, these ...... different types settings (home, school) and with other populations and ages. Beyond ..... 617-577-3820, [email protected] ..... Singer (Eds.), Handbook of health psychology (pp. 365-385).
Understanding Behavior with Ubiquitous Computing for Architectural Design By Kenneth Chun-Wai Cheung B.Arch. Cornell University, 2005 SUBMITTED TO THE DEPARTMENT OF ARCHITECTURE IN PARTIAL FULFILLMENT OF THE REQUIREMENTS FOR THE DEGREE OF MASTER OF SCIENCE IN ARCHITECTURAL STUDIES AT THE MASSACHUSETTS INSTITUTE OF TECHNOLOGY JUNE 2007 @ 2007 Massachusetts Institute of Technology all rights reserved
Signature of Author:
Certified by:
\V
I
Department of Archit 9 6t re May 24, '007 a'2
Kent Larson Principal Research Scientist, Department of Architecture Thesis Supervisor Accepted by:
Cha
MASSACHUSETTS INSTITUTE
OF TECHNOLOGY
JUN 14 2007
LIBRARIES
ROTCH
C ftJulian Beinart Professor of Architecture f the Department Committee on Graduate Students
-o
2
THESIS COMMITTEE Kent Larson Principal Research Scientist, Department of Architecture Dr. Terry W. Knight Professor, Department of Architecture Dr. Stephen S. Intille Research Scientist, Department of Architecture
4
Understanding Behavior with Ubiquitous Computing for Architectural Design By Kenneth Chun-Wai Cheung SUBMITTED TO THE DEPARTMENT OF ARCHITECTURE ON MAY 24, 2007 IN PARTIAL FULFILLMENT OF THE REQUIREMENTS FOR THE DEGREE OF MASTER OF SCIENCE IN ARCHITECTURAL STUDIES ABSTRACT
Understanding the relationship between workplace environment and behavior is an important concern for designers. We report on a pilot study where ubiquitous computing was used to examine workplace activity quality in a commercially designed workplace environment. Data were collected from twelve adult participants in the same professional workplace, for twenty-one workdays during one month. The data collection system was composed of small wireless infrared motion sensors, a Bluetooth-based positioning system using mobile phones, and a context-sensitive self-report survey administered on the mobile phones. Participants were automatically queried about their work practices and their environment via these mobile phones, every time they changed their locations in the workplace. Questions were also asked during the remainder of the day, albeit less frequently. We describe how software visualization tools were developed to visualize the data collected during the experiment, and we report on some of the attributes of subjects' behaviors that can be observed using the tools. Implications of these results with respect to research methods and enabled design methods are discussed.
Thesis Supervisor: Kent Larson Title: Principal Research Scientist
6
TABLE of CONTENTS Introduction
9
Background
13
Prior Work
16
System Design
17
MIT Environmental Sensors
17
Bluetooth Positioning System
18
Experience Sampling System
18
Software
18
Method
21
Participants
21
Constructs and Measures
22
Procedure
27
Compliance
28
Results
30
Data Visualization
30
Factor Analysis
41
Discussion
47
Future Work
42
Evaluating Finished Work
51
Evaluating Prospective Designs
54
Generative Design Tools
54
Appendices
55
References
77
8
INTRODUCTION
The notion that designed environments have an effect on the behavior of their occupants is widely assumed in architectural and design practice,' but there appears to be little industry agreement on methodology for implementing occupancy studies.2 Furthermore, the literature on the topic of occupancy evaluations mostly consists of small scale studies that are specifically designed for one group of subjects in one building, and are not designed experimentally such that they may work in many different types of environments. 3 In the past few decades, technology has made it possible to efficiently measure the ambient environment (i.e. temperature and humidity levels, light levels, sound levels, etc.), to establish functioning conditions while the environment is being used, over extended periods of time. However, designers still have few tools for measuring the effect of an environment on human psychology, cognition, and behavior. A thorough search of the IEEE and ACM electronic databases revealed only one publication on behavioral assessment for architectural design. 4
Conventional methods of environmental evaluation are typically designed to explicitly provide answers to a set of generalized questions, instead of providing a perspective on overall behavior that allows designers to then ask pertinent, specific questions, as would be necessary to gain a holistic perspective on user behavior. Furthermore, it is clear that conventional means of collecting this type of data - one-time questionnaires or surveys - produce results that do not correlate well with real time empirical data regarding the same behavior or events.5
1"The events of human life, whether public or private, are so intimately linked to architecture that most observers can reconstruct nations or individuals in all the truth of their habits from the remains of their monuments or from their domestic relics." (Honore de Balzac); "We shape our buildings; thereafter they shape us." (Sir Winston Churchill) 2 Please see Appendix A for a list of reviewed occupancy evaluation systems. 3 In terms of the latter, there are attempts (BUS and CBE) to implement questionnaires on a large scale, but such studies have yet to come to fruition. 4 Yan & Forsyth, 2005 5This is not to undermine the relevance of qualitative data - only to point out the distinction when considering such data when it addresses quantitative behavioral phenomena.
A notable body of research has emerged in the past few decades, in the psychology literature, suggesting methodologies for empirical assessment of the interaction between an environment and human behavior (e.g., Journal of Environment and Behavior). These studies show that environmental conditions are a significant factor in human behavior and cognitive performance, 6 as well as other psychological 7 and physiological dimensions. 8 Studying human behavior and the environment may reveal relationships that are useful in architectural design. For professional architects, "designing with the behavior of the occupants in mind" is often a significant part of the work process. Design justifications therefore often involve intended behavior of occupants (i.e. spatial layout affecting interaction between research groups). However, many of the small portion of existing, mainstream occupancy analysis studies that include behavioral dimensions, with surveys and ethnographic tools, are subject to investigator and response bias, and are very costly (i.e. requiring long term observation). An aim of this thesis is to expand the field of occupancy evaluation so that architects and designers have tools that enable them to measure the impact of a design on behavior. Designers currently have few cost-effective tools to gain an empirical understanding of the effect of architectural design on user behavior. The problem is that conventional methods of assessing the behavior of users in existing, occupied architecture, for the purpose of designing a new space, are time consuming (and therefore costly), and invasive for occupants (i.e. direct observation), or rely solely on user retrospective assessment, which has been shown to conflict with data on actual behavior.9 Due to the difficulty of deploying these tools, designers are not compelled to evaluate new designs in terms of user behavior, after they are built.
6Cimprich,
1990; Hartig, Mang, & Evans, 1991; Kuo, 2001; Tennessen & Cimprich, 1995 7R. Kaplan, 1973 8For example, it has been shown that surgical patients in rooms with windows with specific views showed benefits, including shorter postoperative hospital stays, and requiring fewer potent analgesics, as opposed to patients in similar rooms, but with windows with a specifically different type of view (Ulrich 1984). 9 Stone, Shiffman, Schwartz, Broderick, & Hufford 2002
During the past several decades, a small body of psychology literature has illustrated that environmental factors have profound effects on human psychology. Demonstrated environmental associations include psychological well-being,' 0 cognitive functioning," and physiological condition. 2 Workplace environments have been a focus of some such research, due to implications for productivity and profitability. Although this research has examined the direct effects of certain physical design characteristics on humans, such as presence of windows' 3 or indoor plants,14 factors such as interactions with others (i.e. group meetings) and quality of work activity have not yet been measured.
In this work, we demonstrate how the technologies of mobile devices and sensor networks might be used to study and evaluate the behavior of people in architectural environments. The availability and cost of these devices is dropping rapidly, and mobile devices can gather and analyze information from sensors in the environment in real-time. Phone processing power, memory, data connectivity, and battery life is all improving, as well as their sheer ubiquity (i.e. current conservative estimates are that over 60% of all people in the United States carry a mobile device).' The former makes them suitable for powerful context aware applications, where services and functions can rely on estimates of where the user is and what the user is doing. The latter creates the opportunity to use the phone to gather sensor and self-report data continuously, for extended time periods, wherever people go.
This document presents a ubiquitous computing based automated occupancy analysis system. An empirical study utilizing this automated system is then presented, 10R. Kaplan, 1973
" Cimprich, 1990; Hartig, Mang, & Evans, 1991; Kuo, 2001; Tennessen & Cimprich, 1995 E. 0. Moore, 1981; West, 1986; Ulrich, 1984; Verderber, 1986; Verderber & Reuman, 1987 13Leather, Pyrgas, Beale, & Lawrence, 1998 14Larsen, Adams, Deal, Kweon, & Tyler, 1998 1 http://www.itu.int/ITUD/icteye/Reporting/ShowReportFrame.aspx?ReportName=/WTI/CellularSubscribersPublic&RPintYear=2 005&RP_intLanguageID=1
examining the relationship between workplace environment and real-time reported job activity quality. The main contribution of this work is the demonstration that ubiquitous computing tools can effectively and economically collect data about human behavior in relationship to environments. Further, this data can be structured through visualizations in a way that provides designers with the ability to determine what is important, from a very large space of possible features in the data, by focusing on the meanings of visual features in a graph.
BACKGROUND
The most prevalent behavioral occupancy evaluation methods currently in use are survey based methods of providing designers with material that allows them to better understand a given design problem.' 6 They give subjects a one shot chance to provide input about the whole of their work activities, through a set of questions that require subjects to generalize about their behavior. An option that is sometimes included in these reviews includes direct observation, whereby a member of a consultant staff sits and observes the clientele for lengthy periods of time. This is clearly a very expensive proposition, yet its inclusion in the process indicates the need to collect information that cannot be gained through conventional surveys. Designers understand that there is a need to understand user behavior beyond their own generalizations. We have implemented automated, mobile device based experience sampling system to accomplish this at a fraction of the cost of direct observation, by automatically prompting subjects to quickly register the nature of their activities throughout the day, for an extended period of time. This type of "just-in-time" experience sampling has the capability of capturing a temporal and, with our systems, a spatial layer of data with similar qualitative dimensions. We propose a system that relies on the ubiquity of mobile devices (i.e. phones). In doing so, we also propose that this type of system has the potential to become ubiquitous, itself. Commercial development is already underway, for systems that take advantage of context awareness to provide services (i.e. location based advertising, product tracking, transportation services tracking). Proof of concept is provided by the Google Maps application, which provides users with the ability to locate nearest public transportation units (taxis / buses / subway trains), and other geospatial web services, where media is tied to location, which is resolved through any number (often a combination) of means. At the heart of this is the notion that "when you look at [any] object [or location], you can [access] the information that [anyone] has added to it" - a sort of world-as-wiki model. At the personal level, these systems enable applications that are aware of the users' locations relative to other users or objects, and a myriad of services that attempt to answer the 16 i.e. Steelcase Community Based Planning (CBP)
question - "what kinds of tools can help [the user] to be more creative / more productive / improve my health?" Every such application can individually contribute to the ubiquity of mobile devices. Many rely on specific technologies embedded in these mobile devices, that in turn enable other types of applications to become widespread (i.e. because the devices will already exist, for other purposes). At the most basic level, such ubiquity can allow idle processing power of remote devices to be utilized for generalized behavior research that can be applied towards the design of environments (while providing context aware services to the individual users). Higher level applications include building systems (environmental controls, industry safety monitoring equipment, mobile medical, etc.) integrated with such behavioral information. In other words, the end-user applications proposed by service providers allow low power/cost mobile sensing equipment to gain ubiquity, which results in economical means of introducing powerful macro-behavioral applications (i.e. traffic control, automated large scale wireless package inventory, etc.). The promise of these types of solutions for architectural means will be discussed in this document. Combined with localization technology, ubiquitous mobile computing technology is armed with the ability to generate usefully interactive environments. This is partially owed to the fact that people now carry mobile devices virtually continuously. Various localization or positioning technologies are becoming increasingly supported by cellular phone systems. This functionality may be extended to include public services; such as the ability for users to place common services requests. Access permissions may then be determined by the host environment, according to whatever criteria may suffice. As such, interaction and controls are an aspect of architectural environments that many consider to be vastly underutilized - however, when everyone has a remote control, this opens up a new range of possibilities. In terms of privacy, one must address the effect of the continual recording of individuals' physical experiences in the digital world, with the possibility of being
accessed, browsed, and mined. An answer might be seen in the nature of web logs (blogs), which few predicted would become as ubiquitous as they are, today. It might be argued that the primary purpose of such journals is for the author himself/herself; secondarily, it serves as a mode of communication to the author's closest social circle. The day to day use of the information presented is up to the imagination and needs of society, as individuals are empowered with the perceived freedom to decide who can access the information. The speed at which web logs have attained ubiquity is, perhaps, proof of the ability for users to find function to maintaining a digital record of their lives. A useful metaphor might be to think of physical experience, or "browsing the world" as "browsing the web." As such, individuals can maintain a history, set location based reminders, with all of the functionality of web cookies, monitor their own behavior, explore their environment, keep accessibility settings, store personal profiles, and maintain the ability to control access to the wealth of information that becomes possible. An interesting and architecturally relevant aspect to the paradigm of a "world wide web of existence" - is related to the vast body of research on the structure of the internet and browsing behaviors of its users. We can only begin to imagine a design world wherein we can apply a holistic understanding of peoples' activity throughout the urban environment, in the same way that software architects and computer science researchers are beginning to address the problems of human computer interaction.
PRIOR WORK Prior work has been conducted with occupancy recognition with similar distributed sensing equipment, including testing of high level behavior recognition algorithms (i.e. meetings, fire drills).' 7 This has also been attempted as a computer vision application,18 using video, but there exists a strong ethical and economical argument for
utilizing equipment that provides only the bit level information that is required of the system. The ethical argument rests on the assumption that people perceive the vulnerability of a system to abuse, whether or not they have reason to believe that it is being abused.19 Therefore, simply having devices with clear optical lenses (as opposed to the opaque lenses on our PIR MITes) presents itself as a perceived intrusion. The economical analysis of the problem of occupancy sensing by Reynolds and Wren concludes that a system that offers one bit of information per square meter per second is ideal.2 0 Prior to this work, no such ubiquitous computing based occupancy research has included experience sampling, to collect information on users' perceived qualities of activities.
17Munguia-Tapia
& Wren, 2006 & Forsyth, 2005 19 Reynolds, 2005 20 Reynolds & Wren, 2006 18 Yan
SYSTEM DESIGN
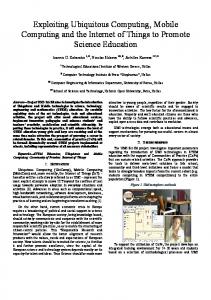
Two types of data were collected - quantitative low level occupancy data, and qualitative high level workplace quality data. The first data type includes information regarding the presence of individuals throughout the space, as well as their movement patterns. There are three interdependent systems involved - MIT Environmental Sensors (MITes), 2 a Bluetooth Positioning System (BTPS), and an Experience Sampling System.
Figure 1: Equipment MIT Environmental Sensors
The MITes system is a distribution of motion sensors that simply logs the presence of users throughout the space (appx. 6' x 6' resolution). The choice of MITes is based on low cost, relative to other commercially available sensor systems, and high scalability of system structure and performance. 21 developed
by the Massachusetts Institute of Technology House-n Research Consortium
Bluetooth Positioning System The BTPS system is a distribution of passive beacons that allows users' mobile devices to perform a positioning routine which is based simply on the IDs of available beacons, with a variable resolution that can be adjusted (from appx. 100' x 100' to appx 10' x 10' resolution). The development of the Bluetooth Positioning System was driven also by cost, relative to other commercially available indoor positioning systems, as well as the need for a system that worked at the resolution of typical work spaces (i.e. appx. l0'xl0'). 22
Experience Sampling System The previous systems allow real time recognition of movement behavior. Shortly following a subject's move from one space to another, he/she will be queried via his/her mobile device, concerning the nature and quality of the activity that just took place. As such, the experience sampling data will be collected using software deployed on the phones, which primarily takes advantage of the BTPS data for context sensitive functionality.
Software All software applications for mobile phone positioning, experience sampling, data collection (intranet MITes data collection and internet transmission to a local server), and data visualization were written by the author in the C# language. This decision was based on the need for interoperability with existing support infrastructure (computers and networks to host data collection applications).
For example, GPS does not function indoors, and Cricket systems have higher resolution than necessary for room level positioning, and are extremely costly. Our Bluetooth based system relies on standard hardware mobile devices. 22
We have developed a questionnaire system that allows subjects to quickly register the nature of their activities throughout the day, for an extended period of time. This type of "just-in-time" experience sampling has the capability of capturing a temporal and, with our systems, a spatial layer of data with similar qualitative dimensions. Through user testing, we developed the following set of queries, which are designed to be prompted on a mobile phone:
Table 1: Questionnaire ID
Question
Response Scale (Likert)
Q04
"Did you feel that, during this time, your
1 = "no, the environment made things
environment accommodated your needs?"
difficult"
+
4 = "yes, the environment met
my needs perfectly" Q05
Q06**
"How much of this time involved
1 = "all independent"
independent activity, versus group activity?"
activity"
"How much of this group activity involved
1 = "none"
+
+
4 = "all group
4 = "all"
presentations?" Q07**
"How much of this group activity was virtual
1 = "all virtual" 4 4 = "all in person"
(involved electronic communications, including messaging or email)?" Q08**
"During this time, did you brainstorm?"
1 = "no; not at all"
Q09**
"My activity during this time was mainly?"
1 = "work"
Q1O***
"During this time, did you do any writing
1 = "no; not at all"
-
-
4 = "yes; a lot"
4 = "social"
+
4 = "yes; a lot"
tasks (by hand or on a computer)?" Q1l*** Q12***
1 = "no, anyone could have taken part"
need to be isolated?"
= "yes, I needed to have my own space"
"During this time, did you do any analytical
1 = "no; not at all" - 4 = "yes; a lot"
or design tasks?" Q13***
"During this time, did you do any organizing
1 = "no; not at all"
4 4 = "yes; a lot"
of your digital or physical space?" Q14***
"How well could you concentrate during this
1 = "not well at all" 4 4 = "very well"
time?" Q15****
+
"For your activities during this time, did you
"During this time, how effective was
1 = "not effective at all" - 4 = "very
communication between people?"
effective"
Q16****
"Did you learn much?"
1 = "no; not at all" 4 4 = "yes; a lot"
Q17
"How did your activity, during this time,
1 = "decreased stress"
-
4 = "increased
4
Q18
affect your stress levels?"
stress"
"During this time, did you accomplish much,
1 = "no; none" 4 4 = "yes; lots"
in terms of your individual tasks?" Q19
"Are you more or less energized for future
1 = "not energized"
+
4 = "very energized"
tasks?" Q20
"How valuable was your activity, during this
1 = "a waste of time" 4 4 = "highly
time, to you?"
valuable"
**if (response[Q05]> 1) ***if (response[Q05] < 5) ****if (response[Q05]>1)
METHOD
Two types of data were collected in the data acquisition phase - quantitative low level occupancy data, and qualitative high level social network data. The first data type includes information regarding the presence of individuals throughout the space, as well as their movement patterns. There are two main systems involved - MIT Environmental Sensors (MITes), and a Bluetooth Positioning System (BTPS). These systems allow real time recognition of movement behavior. Throughout the study period, shortly following a subject's move from one space to another, he/she was queried via his/her mobile device, concerning the nature and quality of the activity that just took place. As such, the second data type was collected using software deployed on the phones, which takes advantage of the first data type for context sensitive functionality. Acquiring this data raises serious privacy concerns, which are dealt with through the technology implementation. The MITes collect data without identity; the BTPS system does record collect identity information, but the positioning routine is performed entirely on the users' device, so individuals will always have the option of turning this system off. It is predicted that the utility of these location aware systems will ultimately compel users to leave the system on, in the future. Participants A total of twelve adults23 participated in this study. All were working professionals in the same working group at the corporate headquarters office building of Steelcase in Michigan. All are working peers of similar job status and socioeconomic status. Eleven of the twelve participants were designers, and one was an engineer. Two of the designers, as well as the engineer, had a managerial role that did not preclude their role as designers/engineer; these three subjects collaborated with the rest of the subjects on projects, in the same sense that most subjects collaborated with each other on projects.
23
six males, six females
MIT institutional review board approval, for use of human subjects in research, was obtained, for this study.
All participants were volunteers, with an incentive that
they would be able to use and keep the mobile phones that were part of the study. The length of time commitment for the subjects was one month. Participants were informed that they could exit the study without penalty at any time, due to discomfort or concern about the data collection. No participants actually exited the study.
Constructs and Measures Occupancy. 120 PIR MITes were installed on the ceiling, throughout the study area. Each provided information on whether or not a person occupied the circular area below the sensor, roughly two meters in diameter. As a whole, these provide data on the duration and frequency of use of each space within the study area.
Figure 2: PIR MITes sensor locations 24
COUHES Protocol # 0703002146
Environment Type. Prior to data collection, each space in the study area was labeled by type (personal work space, meeting area, or lounge area) as according to design intent. The mobile device positioning system employed in the study automatically recorded location data such that all questionnaire data was automatically associated with an environment type.
Table 2: Environment Types Low Level Categorization
High Level Categorization
Personal work space (window)
Personal Work Space
Personal work space (edge)
Personal Work Space
Personal work space (interior)
Personal Work Space
Personal work space (hall)
Personal Work Space
Meeting area (open)
Meeting Area
Meeting area (closed)
Meeting Area
Lounge area (cafd)
Lounge
Lounge area (seating)
Lounge
Lounge area (media station)
Lounge
Spersonal work space meeting area 61
Figure 3: BTPS location recognition Work Type. The questionnaire included characterization of activity by work type, according to seven items regarding the nature of the activity as independent or group oriented, involving presentations, involving virtual communication, work or social, involving writing tasks, needing isolation, involving analytical or design tasks, and involving organizing tasks. The work type scale items are summarized in Table 3. Some of these questions specifically involved group or independent activities. In these cases, whether or not the question was asked in a given questionnaire session was dependent upon the subject's responses to earlier questions (i.e. if the subject reported engaging in only independent activity, then questions about the nature of group activity would be omitted). It would be expected that subjects' frustration with the system would increase without this conditional branching, as irrelevant questions may be seen as a waste of time.
Table 3: work type questions ID
Question
Response Scale
Q05*
"How much of this time involved independent
1 = "all independent"
activity, versus group activity?"
activity"
"How much of this group activity involved
I = "none"
Q06"
+
+
4 = "all group
4 = "all"
presentations?"
Q07*
"How much of this group activity was virtual (involved
electronic
I = "all virtual" 4 4 = "all in person"
communications,
including messaging or email)?"
Q09 Q0~
I = "work" 4 4 = "social"
"My activity during this time was mainly?" "During this tie
did you do m wrin
tasks
=I "Io; not at al"4
4
s;
lot"
(t.y hland o r o optrI?"i~
Ql
l
"For your
ities
ieed to be
ii ?
Q"During
hrhing
iis
time di
you
i ="no, ay one loud have taken
"sded
this tine, did you do a
n alyical or
i .1
no;
to h n
part"
4
my own s-pace "
all" - 4
"yes; a lot
desigan tasks?"
Q 3
"Duiring this timn
did you do ary organizingw
of' yor digital o physalr
I ="no: not at all"
4 =
a lot"
spae?
*if (responsejl01]!=1) **if (responseQ01) != I && responselQ05) > 1) **0
1rsosi0l1 &&
epueQ5
Workplace Activity Quality. Of primary interest were characterizations of the quality of each work activity, according to nine items regarding the nature of the activity in terms of accommodation of needs, cognitive attention, ability to concentrate, communication effectiveness, learning, stress, accomplishment, energy, and overall value. The workplace activity quality assessment scale items are summarized in Table 4. Table 4: workplace activity quality questions ID
Question
Response Scale
Q04'
"Did you feel that, during this time, your
1 = "no, the environment made things
environment accommodated your needs?"
difficult"
4 4 = "yes, the environment met my
needs perfectly"
Q08*
"During this time, did you brainstorm?"
I = "no; not at all"
4 ="yes; a lot"
"Hwwl Ql4"~~
ol v o
Q5
"During
Q16' Q17'
"id you en
Q18.
this
ime
veywel
ontrat duringths=
how
eFcive
was
="ot
I
much?"
effecne
no: not at a"
at all"
' 4
"es;
"decreased stress" 4
4 4 =ver a lot"
4 = "increased
"How did your activity, during this time, affect
1
your stress levels?"
stress"
"During this time, did you accomplish much,
1 = "no; none" 4 4 = "yes; lots"
=
in terms of your individual tasks?"
Q19*
"Are you more or less energized for future
1 = "not energized" 4 4 = "very energized"
tasks?"
Q20*
"How valuable was your activity, during this time, to you?"
*if (response[ 01]!=1) *]
!= && responselQ05]>1)
responsI!Q]1]!=
1&&
1
'epneQ j>
1&&~ resp'oeQ2S
!=3)
1 = "a waste of time" 4 4 = "highly valuable"
Procedure All data were collected according to a uniform protocol summarized here,25 using personal mobile devices. Each subject was given a device that automatically prompted them to respond to the questionnaire every time the subject changed location within the study area, as long as they spent longer than ten minutes in the previous location. This information, regarding when and how often subjects changed location, was automatically monitored by the BTPS system. When subjects were not in the designated study area, they were queried every two hours and asked about the type and quality of their activities, as long as they reported that they were working. In total, data were collected for 1803 activities; responses to the questionnaire were received 1803 times, amongst all participants, over the course of the month.
Figure 4: experience sampling application
25
Please see Appendix F for a description of the study protocol.
Compliance
To ensure that subject's interactions with the query tool were as expected, compliance was monitored throughout the study. Figure twelve shows an example of total daily query compliance rate. Subjects were given the initial opportunity, with each query, to respond that they do simply not have enough time to respond to the query. These cases, when the subjects respond that they do not have time, as well as queries that were started but not completed within a reasonable amount of time (discussed further) are defined as user non compliance. Queries that were halted due to incoming phone calls are defined as interruption non compliance. Approximately 8% of all attempted queries were interrupted, and approximately 21% of all attempted queries were cancelled due to user non compliance.
daily response rate
Figure 5: responses per day (weekend days are shaded) As can be seen above, query response was significantly reduced on weekends. Note that full queries were only implemented when subjects reported having engaged in
work activities or were physically in the workplace - during the weekends, neither scenario occurred frequently enough to have statistically meaningful data for the weekends. Given the intuitive assumption that subject behavior is significantly different on weekends than work days, and the relative lack of data, week end data was removed from the data set before analysis.
The amount of time taken to complete a query (from subjects' input to stop the alert to completion of the last question) was also monitored. The vast majority of queries took less than five minutes to answer, with most taking between one and two minutes. As the study progressed and subjects became more acquainted with the system, mean response time decreased with most responses taking one to two minutes. The longest query response took over four hours - this, as well as the few other query responses taking longer than indicated by the ninety-fifth percentile (twenty minutes) were removed from the data before analysis.
time to complete questionnaire 250
200 --
150 +-
100 -
50 4-
1
3
5
7
9
11 13 15 17
19 21 23
25 27
29 31
33 35
time (minutes)
Figure 6: time to complete queries
37 39
41 43
45 47 49 51
53
55 57
Responses to the first question (Q00:"Do you have time to answer a few questions about the past NN minutes?") did not differ significantly by environment type, or location. This confirms that we did not have compliance bias by location, or people responding at significantly different rates, depending on environment type.
RESULTS Analysis of the data set included two complementary strategies. The first was to produce visualizations that allow designers to understand the temporal and spatial aspects of the data. The second was to perform a classical factor analysis, to determine the significance of qualitatively observed variations, and to assess the ability of the data collection system to produce high quality data sets. It is important to note that this is pilot work to show proof of concept that the tools have value, and to inform the development of questions and visualizations for larger deployments.
Data Visualization A data visualization application was developed for the PIR MITes data, which allows users to freely peruse the data for each day, by playing back sensor activations at high speed, or viewing cumulative sensor activation information. The application consists of two main components - a plan view and a timeline. A screen shot of this application is shown in Figure 7. Upon loading data, the timeline is populated with sensor activations, each represented by a brightened pixel. Every pixel row (across the vertical axis) in the timeline represents a single sensor, and the horizontal axis represents time (from 12:00:00am to 11:59:59pm). The user can then choose to play back the sensor activations, which appear as filled nodes on the plan, or select a time span on the timeline, to view cumulative occupancy and movement, which is parsed from the data. As shown in Figure 7, cumulative occupancy, or time spent in a single location, is
.. .. ......... ............................................... ...
.
................................... .
displayed as filled circles, and cumulative movement, or travel between locations, is displayed as thick lines.
Figure 7: PIR MITes Data Visualization
This application presents the user with an overview of how subjects occupy and move through the space. For design information purposes, this may be most useful for exposing unusual or unexpected behavior, as well as confirming assumptions about how the study environment is used. Including information from the BTPS system, we can also examine the amount of time spent in various locations throughout the space. Figures 8 and 9 show the relative amounts of total and mean time (per activity event), respectively, that subjects spent in the three primary space types26 throughout the study space, throughout the day. 26
Significant differences (alpha: 0.10) in behavior (work type and activity quality responses), within these high level environment type categorizations were not found, so locations were clustered, as such.
distribution of total person time per location, throughout day 1200
1000 -
800
Emeefing area
Ulounge area
600
Ocubide
400
7
8
9
10
11
12
14
13
15
18
17
18
19
20
hour
Figure 8: total aggregate person time per location in study area distribution of mean time per location, throughout day 180
160 140
120
E meeting area
100
I lounge area Ocubide I
80
60
40
7
8
9
10
11
12
14
13
15
hour
Figure 9: mean person time per location in study area
16
17
18
19
20
For space usage mapping, the primary advantage of our automated systems, over traditional methods like ethnographic observation or surveys, is the accuracy and ease of implementation. However, the following figures, showing user responses to questions throughout time, and by environment type or location, might be useful for rapid and accurate assessment of many aspects of behavior that would be difficult to uncover using conventional methods. As an example, we look at one subject's mean responses to the questions, when asked between 12:00pm and 1:00pm. A graph of these responses, by location, is provided in Figure 10, below. Responses are centered on the horizontal axis, with positive responses to the questions leading up from the axis, and negative responses leading down. The darkness of bars represents normalized significance of the data point - if the subject spent more time in that location, and consistently responded as such, then the bars appear darker.
a typical late morning for subject1 0... personal work space meeting area
0 CL
0)
4) CI
Figure 10: mean perceptions of work quality, subject 10, 12:00pm to 1:00pm As can be seen in the figure, this subject spent most of his/her time, at this hour, in his/her personal work space or meeting area. When he/she were in his/her personal work space, he/she would generally report not doing work related activities and not really being able to concentrate. This seems perfectly plausible, given the time that is likely to include the subject's lunch break. However, it is interesting to note that the subject
...............
generally reports positive work activity qualities when they are spending this time in a meeting area.
Figure 11 shows an array of these graphs, for all subjects, for all hours of the day for which data was collected. This type of representation allows the researcher to quickly scan the large amount of data for unusual features that deserve further exploration. This is intended to take advantage of the human ability to discern visual patterns - and in particular, the ability to rapidly identify breaks in patterns. Examples of such features are shown in Figure 12.2
Figure 11: mean perceptions of work quality, per subject, per hour
27
(next page) Figure 12: mean perceptions of work quality, per subject, per hour
mean perceptions of work quality, throughout the day, for a working group...
a typical late momning for subject'10...
subjectO8 seems to have a different perspective..
EsubjectO8 has a very different role than the rest
the rest of the subjects' general behavior and workquality assessments appear to follow
similar trends, as would be expected from members of the same working group... the lounge or cafe areas are generally only used durng meal times
negative assessmnrits of work quahty appear
much more frequent subjects
late
in the day. for some
The most immediately apparent feature is that subject 08 seems to have a notably different perspective than the rest of the subjects. Review of this result with the study group revealed that this subject has a slightly different role than the rest of this working group. The rest of the subjects' general behavior and work quality assessments appear to follow similar trends, as would be expected from members of the same working group. For instance, the lounge areas are generally only used during meal times, if at all, by any subject. Further, negative assessments of work quality appear more frequently later in the day, for a portion of the subjects.
The data visualization can be transformed in a variety of ways, each providing a new perspective on the behavior that occurred in the office. To look closer at behavior at specific locations, all subjects' mean responses to a single question, for a single location, over the entire study period, can be plotted. A graph of these responses, by subject, is provided in Figure 13, below, for the question - "Were you involved in group (versus independent) activity?" Responses are again centered on the horizontal axis, as in the previous example. The darkness of bars also represents normalized significance of the data point.
group (versus independent) activity... meeting area (closed - "retreat")
'-
CJ
Ci')
0
-
Go' 0
0)
0
V-
C%4
Figure 13: mean assessment of work type, for the closed meeting area As can be seen in the figure, different individuals consistently utilize this space in different ways. Subject 01 and subject 08 are more likely to use the closed meeting area for independent activity, while most subjects are most Riely to use the space for group activity. The remaining few use the space less often, or vary their use between independent and group activities. This is certainly informative for designers - to know, for instance, that the closed meeting space is utilized in varying ways by different individuals. Figure 14 shows an array of these graphs, for all locations, for all work activity quality questions.
............................... -WSW& .
. ......... .
I. .
1 .,
1*
Figure 14: mean perceptions of work quality, per subject, per hour Again, this type of representation allows the researcher to pick out visual features in a large dataset, for further exploration. Examples of such features are shown in Figure 15.28
2
(next page) Figure 15: mean perceptions of work quality, per location, per subject
mean perceptions of work quality, per location. tor a working group
group (versus independent) activity
Individual features are apparent throughout - for instance, two subjects appear to engage in virtual group activities more than the rest, and of the little use that lounge areas saw, subjects tended to report increased stress. The natures of possibly general trends are also apparent. Most interestingly, one can see differences in variance between subjects, across locations, that show that certain spaces provide subjects with a more universally suitable (or unsuitable) environment for certain activities or behavior.
To further examine this notion, we proceeded with a classical factor analysis of the data set.
Factor Analysis
In this section, the focus of our analytic strategy was to assess the interactions between environment type and work type and workplace activity quality.2 9 We performed an analysis of variance (ANOVA) for responses to each question, by environment type. Responses to the following workplace activity quality scales were found to differ significantly by environment type (P2 .5 - assessments of whether or not they are energized for future Subjects' tasks were
also found to differ significantly by location. Interestingly, subjects reported that they were least energized following activities in the lounge areas. E
Q19: "Are you more or less energized for future tasks?"
personal work space
lounge area
meeting area Envilronment Type
Figure 24: Q19 (P