Understanding Conceptual Electronic Design Using Protocol Analysis1
Thomas Mc Neill2, John S. Gero3 and James Warren4
[email protected]
Abstract Many theories about the process of design have been derived from prescriptive or descriptive analysis. There have been few attempts to empirically test these theories. Protocol analysis facilitates detailed inspection of the design process allowing design task analysis across the temporal dimension. Some hypotheses about the design process, derived from the literature, are objectively tested using results obtained from protocol analyses of various electronics designers engaged in conceptual design. Support for the hypotheses is found.
Keywords Design Protocols, Design Process, Function-Behaviour-Structure Model, Design Research.
[Research in Engineering Design (to appear)]
1 2 3
4
This work was carried out at the Key Centre of Design Computing, University of Sydney. Department of Electrical Engineering, Mahidol University, Nakorn Pathom, 73170, Thailand. Key Centre of Design Computing, Department of Architectural and Design Science, University of Sydney NSW 2006 Australia. School of Computer and Information Science, The University of South Australia, SA 5095, Australia.
1. Introduction Much of what has been written about design in the last three decades is characterized by one of three types of analysis: prescriptive, descriptive and investigative. Prescriptive analysis, of which Asimow (1962), Mead and Conway (1980), Hubka (1982), Pahl and Beitz (1984), VDI (1987) and French (1992) are examples, presents an idealized account of the design process which prescribes the steps that should be followed by a designer. In general the authors are presenting what they believe to be the best approach to the design of a system or artifact. Descriptive approaches (Dym 1994, Mostow 1985 and Sullivan and Mutch 1986) describe the process based on introspective or anecdotal evidence. Authors of this approach argue that the process which designers actually follow is quite different from the idealized prescriptive account but the strength of this argument is diminished by the fact that it is based on anecdotal evidence. Investigative analysis (Cross 1984, Ullman et al 1988, Cross et al 1992, van Someren et al 1994 and Cross et al 1996) uses techniques developed in psychology and behavioral science to make objective studies of the design process. One area of data collection that is particularly effective when applied to design is protocol analysis (Ericsson and Simon 1993). A designer is asked to think aloud whilst performing a design task and his or her actions and verbalizations are recorded for later analysis. Using protocol analysis it is possible to observe the design process in detail. In particular, it is possible to observe the temporal aspects of the design process. Common to the three approaches is the desire among researchers to bring about a formal basis for design methodology (Dixon 1988). In engineering education the approach taken to teaching design presents the student with a series of design tasks. The student is expected to glean the essential elements of the process by experience. There is little scope for objective evaluation of the process. This is in stark contrast to the learning of other facets of engineering such as electronics where a range of physical principles based on electromagnetic theory and quantum mechanics forms the basis upon which the subject is learnt and against which it can be evaluated. Dixon (1988) advocates the development of scientific theories of engineering design and sees much of the current design research as being in a pre-theory stage. Science develops theories to explain natural phenomena. A scientific theory defines an ideal system which can be used to predict some observable behaviour. Dixon makes the distinction between data or observations from the real system, generalizations of the data and explanations of why the generalizations are what they are. A model can be derived from a generalization of the data but it is theory that explains why the model behaves as it does. Current research in engineering design is at the stage of collecting data, making observations of the design process and finding appropriate generalizations of the data and observations. The work reported here takes some generalizations proposed by authors of the prescriptive and descriptive approaches and derives some hypotheses that can be objectively tested using protocol analysis. This work facilitates the development of a model of the design process which can in the future serve as the basis for the development of theories about engineering design. 1.1. Conceptual Design The earliest phase of the design process is distinguishable from later phases in that it is concerned more with understanding the problem and making general, rather than specific, decisions about the solution (Guindon et al 1987, French 1992, Edmonds and Candy 1993). This phase, referred to as conceptual design, is the topic of study for this paper. Conceptual design commences with a high level description of a requirement and proceeds to a high level description of a solution. The process may include periods of detailed design that are required to elaborate an aspect of a candidate solution to the point where its feasibility can be confirmed.
2
1.2. Hypotheses Protocol analysis is used to test some hypotheses about conceptual electronic design. Two main hypotheses are presented with some minor hypotheses attached to the second hypothesis. 1. Conceptual design commences with the designer considering mainly function and finishes with the designer considering mainly structure. 2. In the process of designing the designer cycles between the three activities of analyzing the problem, proposing a solution or partial solution, and evaluating a proposed solution. a. The designer cycles between the three activities in the order of analysis of the problem followed by synthesis of a solution followed by evaluation of the solution. b. Conceptual design begins with the designer spending more time on analysis of the problem, followed by a period characterized by mainly synthesis followed a period characterized by mainly evaluation of the problem. 2. Protocol Analysis The work described in this paper builds on work undertaken in preliminary studies by the authors. Three protocol studies of engineers engaged in conceptual design were used as a vehicle for the development of the analysis method used here. Two protocol studies of electronic engineers were conducted. Details of the first study appear in Mc Neill and Edmonds (1994). Details of the second study appear in Gero and Mc Neill (1998). A third study was made of an engineer engaged in mechanical design (Purcell et al 1996). When analyzing the protocol data two important factors are to be taken into consideration. The coding scheme used must adequately reflect the complexity of the data without distorting it, and the process of coding the protocol must be as objective as is possible. The first of these considerations can be addressed by a combination of coding categories that are derived from real data collected in the earlier studies (Gero & Mc Neill 1998) and categories that are derived from theories of design. The second consideration can be addressed by the use of two coders and a consensus approach to the final coding result. Whilst there have been criticisms of the use of the think aloud protocol analysis as a means of producing a unitary cognitive model of human designers (Lloyd et al 1996). The current approaches offer the opportunity to gain some insight into a range of design processes of humans without claiming complete insight. As such they are useful in the development of cognitively-based models of design. 2.1. Coding Scheme The coding scheme makes use of the notion of multiple dimensions by using up to four codes to capture the aspects of each coding segment. Two dimensions are concerned with the designer’s navigation within the problem domain and two dimensions are concerned with the strategies used by the designer. The designer’s interaction with the design problem can be characterized by navigation through a two dimensional space representing the problem domain. One dimension is the level of abstraction and the other is concerned with whether the designer is reasoning about function, behaviour or structure.
3
The designer can be considering the problem at a level of abstraction that ranges from a high level to a detailed level. Between these two extremes an arbitrary number of levels may be identified. Watts (1966) represents the range as a continuum between concrete and abstract. Lang and Mc Cormick (1986) and Zimmermann (1986) suggest that five levels can be delineated. Many other authors (M'Pherson 1981, El-Turky and Nordin 1986, Thomas 1986 and Umbach 1992) divide the range into three levels. When deciding on the number of levels to be used in the protocol analysis it is necessary to consider the coding process. More than four levels is difficult to categorize consistently and less than three levels does not capture all of the detail in the protocols. The problem used in the this study could be readily categorized into one of four levels. Table 1 shows the four codes used to capture the level of abstraction. Level 0 corresponds to a high level and level 3 corresponds to a detailed level. Level of Abstraction A numerical code indicates which part of the problem the designer is considering. 0
-
System
The problem in terms of the overall system.
1
-
System & Sub systems
The problem in terms of the sub systems.
2
-
Sub systems
The details of the sub systems.
3
-
Detail
The detailed workings of the sub systems.
Function, Behaviour and Structure A code indicates in which of the three areas the designer is reasoning. F
-
Function
The functional aspects of the problem domain.
B
-
Behaviour
The behavioral aspects of the problem domain.
S
-
Structure
The structural aspects of the problem domain.
Table 1 Coding Categories for the Problem Domain
The second dimension of the problem domain is captured by the use of three codes to indicate when the subject is reasoning about function, behaviour or structure. A summary of the codes for this dimension is given in Table 1. Reasoning about structure is readily identified by the subject proposing some aspect of the designed system. Reasoning about function and behaviour are similar to each other in that they occur when the designer is describing how the system will behave. Reasoning about function is distinguished by the subject attending to the use of the system or its interaction with its environment. The designer’s strategy when undertaking a design task can be viewed in two ways. The designer’s immediate actions can be identified and classified into one of a small number of categories, recorded as a micro strategy dimension. The designer’s overall approach to the problem is captured in the macro strategy coding scheme. Micro Strategies The codes are divided into four groups. An -
Analysing the Problem
Sy -
Synthesising a Solution
Ev -
Evaluating a Proposed Solution
Ot -
Other Activities
Table 2 Coding groups used for the designers’ micro strategy
4
The micro strategy coding scheme takes a large number of categories that arose from real design sessions (Gero & Mc Neill 1998) and forms these categories into groups based on theories of design discussed in the literature (Asimow 1962, Watts 1966, Broadbent 1973, Gasson 1974, Hubka 1982, Coyne et al 1990, Candy and Edmonds 1994, Dym 1994). There are four groups used in the coding of the subjects’ micro strategy: analysis of the problem; synthesis of a candidate solution; evaluation of a candidate solution; and other activities. The four groups are given in Table 2. (The individual categories are discussed in detail in Mc Neill 1998.) The purpose of coding the macro strategy is to capture the subject’s long term process in terms of their approach to the overall problem. Each subject’s approach is different and it is difficult to describe the subjects’ strategies using a small number of fixed categories. The macro strategy coding consists of dividing the protocol into a small number of large segments which are numbered. Each segment represents a different activity. An index table is completed for each protocol in which a brief description is given of each activity. It is possible for a designer to return to an activity that has previously been suspended, so any index number may appear more than once in the protocol. 2.2. Coding Method The protocols are coded by two coders and a final protocol is achieved using a process of arbitration based on the Delphi method (Linstone and Turoff 1975). This method has been applied to a diverse range of applications and appears in a number of different forms. The essential feature of the different approaches is that they involve a process of highlighting differences in the views of the members of a group which results in the main effort being applied to the areas where there is disagreement while minimizing group interaction on the areas of agreement. In conventional protocol coding emphasis is placed on inter-coder reliability as a measure of the ambiguity of the coding scheme. Minimal disagreement between coders is desired (van Someren et al 1994) but this can be difficult to achieve given the qualitative nature of the coding process. By adopting the Delphi method, coder effort is focused on the segments that are ambiguous whilst minimizing the time spent on segments that clearly exemplify one of the categories. In earlier studies (Gero & Mc Neill 1997) the Delphi method was used by one coder and this forms the basis of the process used in the main study, summarized in Figure 1. Each coder makes a first pass of the transcript, segmenting and coding concurrently. During this pass the first three coding columns are completed. (The macro strategy is not coded at this stage.) The coding is entered into the three columns simultaneously rather than a pass for coding the first column then a pass for each of the second and third columns. For some of the micro strategy codes there is no corresponding problem domain codes, so in these cases only one code is entered. There is a break of about ten days before the coder returns to the protocol.1 The second pass is completed in the same way as the first pass without any reference to the first coding result. The first and second passes are completed quite quickly with any sections that are ambiguous appearing as discrepancies in the subsequent arbitration process. After a further ten day break the coder compares the two coding results and performs a process of self arbitration. When the two protocols agree the result is copied onto a third protocol form. Where a section has been coded differently in the two protocols the need to examine the section more closely is signaled. The resulting code may be one of the two already used or it may be a combination of the two. In rare circumstances the result may be 1
During the ten day break other protocols are coded. This helps to reduce the coder’s tendency to remember the previous coding and to fixate on a particular result.
5
quite different to the first two coding results. During the arbitration process the coder consults the transcript, referring to the video only when it is necessary to clarify the subject’s actions. When the arbitration is completed each coder codes the macro strategy dimension. The coding of this dimension requires a global view of the design process. The coders have attained such a view by the time they have coded a protocol twice and have performed a self arbitration. After the above procedure is followed by each coder, the two coders combine their results in a joint arbitration process, similar to the self arbitration. When there is disagreement each coder offers reasons for their particular result. An arbitrated result is achieved by a consensus approach. When all three results from one coder (first and second passes plus the self arbitrated result) are the same there is a strong weighting attached to the result and this can make the joint arbitration process easier. The joint arbitration process is applied to the first three dimensions concurrently. The macro strategy dimension is arbitrated separately. First Coder
Second Coder
Encode Protocol First Pass
Encode Protocol First Pass
1st Encoded Protocol
1st Encoded Protocol
Encode Protocol Second Pass
Encode Protocol Second Pass
2nd Encoded Protocol
2nd Encoded Protocol
Arbitration
Arbitration
First Coder's Arbitrated Protocol
Second Coder's Arbitrated Protocol
Both Coders Final Arbitration
Final Protocol
Figure 1 The coding method
6
2.3. The Coders Coder A is a male electronic engineer with ten years of design experience. Coder B is a male architect with two years of design experience and a keen interest in the design process. Coder B was trained by coder A. Coder B was presented with selected segments of protocols which had previously been coded by coder A (Gero & Mc Neill 1998). Coder B’s results were compared with those of coder A. Discrepancies were discussed in detail to assist coder B in understanding the coding scheme. The coding scheme for the main study was completed initially by coder A and this scheme was used by both coders to code several segments of another protocol. The process consisted of coding a segment, arbitrating the segment, then discussing elaborations to the coding categories. This approach was used to refine the coding scheme and to ensure that coder B had a complete understanding of the scheme. Both coders then coded a dummy run protocol and arbitrated their results to check the final coding scheme. 3. Experiment Electronic engineers were presented with a problem of typical real world complexity and instructed to produce a solution in a high level descriptive form. They were required to produce a design outline at the conceptual level. They were allowed to approach the problem as they felt appropriate. The designers were asked to think aloud while designing. Their actions and speech were recorded and protocol transcripts were produced. The protocols were then studied and encoded as described above. 3.1. Procedure Each subject worked at a large table with pen and paper. Two video cameras were used, one trained on the designer from the side to give a clear view of the designer’s face and hand movements, the second looking over the shoulder of the designer to show the sketches and notes produced by the designer. There were two other people in the room, one operating the video equipment and the second was the experimenter. The experimenter delivered the verbal instructions and answered any questions about the requirements of the exercise. These answers were restricted to topics such as the level of detail required in the solution. The experimenter did not answer questions pertaining to the technical requirements of the design exercise. During the exercise the experimenter would only interject to remind the designer to think aloud. Each subject was first required to complete a ten minute practice exercise that was not related to the design task. The brief was given verbally by the experimenter as well as in written form. The practice exercise is a problem solving task that generally takes ten minutes to complete. The purpose is to acclimatize the subject to the process of thinking aloud and working in front of a camera. The subject was then presented with the main design brief. A copy of the brief appears in Appendix A. The design problem is concerned with a personal alarm system for use by hospital staff to summon assistance. The subject was given forty five minutes to produce a solution in a high level, block diagram form. Detailed solutions were not required. Multiple solutions were allowed. After the main exercise each subject completed a questionnaire used to collect demographic data and the subject’s response to the exercise. Prior to the recording of the subjects a dummy run was completed to test the procedure against any problems with the instructions given to the subjects and the transcript was used to fine tune the coding scheme. The results of the dummy run were not used in the analysis. In devising this procedure it was necessary to strike a balance between the need to make the exercise as close to real life as possible and the need to have some commonality between episodes to allow generalization of the results. The experimental situation falls short of a
7
real world situation in that it is taking place in a contrived environment, the subjects are using A3 paper supplied for the experiment, they do not have the same access to outside data sources and colleagues that may exist in their normal work place and they are constrained to produce a result in 45 minutes. Each subject was clearly comfortable with the arrangements. One subject reported that the time limit was an important factor and another reported that they would have contacted the “customer” during the forty five minutes to ask for more information, otherwise the subjects thought the setting was realistic. 3.2. Participants Ten subjects were studied. The subjects have a wide range of experience in the field of electronic engineering ranging from final year undergraduate students to an engineer with 38 years experience. All subjects were male. The subjects were labeled from E01 to E10 reflecting the order in which the sessions were recorded. A technical problem with the recording of one subject resulted in unusable data. The other nine subjects were used in the analysis. The objective was to obtain a broad representation of designers ranging from inexperienced to experienced designers. Particularly in the case of the experienced designers the aim was to find as wide a range of experience and educational backgrounds as possible. 4. Results from the Protocol Analysis 4.1. Agreement Between Coders The Delphi method was used to arrive at the final codes for each design episode. It is not appropriate to use the levels of agreement between coders as a measure of the coding accuracy since disagreement between coders is used as a flag to prompt closer inspection and more careful coding of a segment. However it should be expected that a reasonable level of agreement would exist in the protocols produced by each coder before they are arbitrated. A low level of agreement would tend to suggest that the coding scheme is ill defined and interpreted differently by the two coders. Two protocols were examined to assess the level of agreement. Agreement was checked between the coders' self arbitrated protocols and between each coder's protocol and the final arbitrated protocol. The levels of agreement are shown in Table 3. Agreement is expressed as a percentage of total coding events. Each of the problem domain dimensions and the micro strategy dimension are examined. Results are aggregated over the three dimensions for each subject and then aggregated for both subjects. The table shows raw agreement between protocols and does not take into consideration marginal frequencies of the coding categories as is suggested by van Someren et al (1994). Such a detailed analysis of consistency is not appropriate since the coding method relies on discrepancies to flag sections that need closer attention.
Subject E03
Number of Events 513
Agreement Coder A and Final Coder B and Final 85% 73%
Between Coders 61%
Subject E08
590
58%
88%
68%
Total
1103
59%
87%
71%
Table 3 Agreement Between Coders
Agreement between coders is generally high and agreement between each coder and the final arbitrated result is very high with coder A having a higher agreement than coder B. This reflects the fact that coder A has been working with the coding scheme for a longer period than coder B.
8
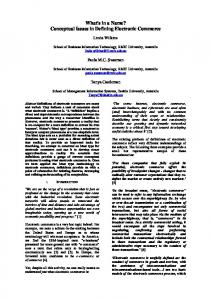
4.2. Protocol Data A set of graphs was produced to represent a summary of each design protocol with the four coding dimensions recorded together. Figure 2 shows the typical result. The lowest section of the graph shows the results for the levels of abstraction dimension [0–1–2–3]. Above this section is the function-behaviour-structure dimension [F–B–S]. The micro strategy dimension appears in the third section from the bottom [An–Sy–Ev]. The three groups of analysis, synthesis and evaluation are plotted. Codes in the other group are not shown on the graph for reasons of clarity. The uppermost section of the graph shows the macro strategy dimension. The trace starts at the lowest level, corresponding to the first macro strategy activity and shows the subject’s progress through to the final activity. Each activity has a unique code which is recorded in each protocol transcript.
Figure 2 Typical activity during a design episode (Subject E02).
All subjects move rapidly backward and forward between categories in the first three dimensions while following a more direct and slowly changing path in the macro strategy dimension. They begin the episode in the analysis group and all except one move quickly to synthesis. All subjects begin at a high level of abstraction and all except one begin by reasoning with function. The end point of the design episodes are more varied but there is a tendency towards ending the session considering the problem at an intermediate level of abstraction, while reasoning in structure. Most subjects end the episode in the synthesis group of the micro strategy dimension. 5. Tests of the Hypotheses 5.1 Function, Behaviour and Structure The first hypothesis is concerned with the amount of time the subject spends reasoning with function in relation to time spent reasoning with structure. One graphical and two statistical approaches are used to test the hypothesis. A set of graphs is produced for the function-behaviour-structure dimension by filtering the data using a moving weighted average filter (Gero and Mc Neill 1998). The weighted average filter used in this analysis is derived from a normal distribution with a standard deviation of 90 seconds (Mc Neill 1998). The three categories are plotted together on each 9
graph. Although the graphs vary for each subject the general tendency is towards the graph shown in Figure 3. The subjects begin by reasoning mostly in function for a short period of time. Their time is then divided between reasoning about behaviour and structure. The graphs generally support the first part of the hypothesis concerning function. There is no general trend in the time spent reasoning about structure.
Figure 3 A typical graph for Function, Behaviour and Structure verses time (Subject E02).
Each design episode is divided into deciles of time. The time spent in each decile reasoning with each category is calculated and the results are aggregated for the nine protocols. The aggregated data is used to calculate a linear regression for each subcategory in the functionstructure-behaviour dimension. The expected results from the hypothesis are a significant negative slope in the function category and a significant positive slope in the structure category. The results, given in Table 4, show a significant negative slope for the function category, a significant positive slope for the behaviour category and no significant slope for the structure category.
R Square Coefficient t Statistic P-value
Function 0.074 -0.281 -2.609 0.011
Behaviour 0.057 0.199 2.265 0.026
Structure 0.010 0.081 0.913 0.364
Table 4 Aggregate Regression Results for Function, Behaviour and Structure
For each category a centre of gravity can be calculated. The centre of gravity is the point at which the subject has spent as much time reasoning with a category so far in the design episode as they will spend in the rest of the design episode. The centers of gravity are expressed as percentages of the total episode time. This allows episodes of differing lengths to be compared. If the hypothesis holds the centers of gravity of the function category should be significantly earlier than the centers of gravity for the structure category. A paired t test was performed on the centers of gravity data for all of the subjects for the function category and the structure category to test for a significant difference in the centers of gravity1. The test was made assuming both equal variances and unequal variances since the nature of the general population data is not known. The results are given in Table 5. The critical t values for this test (α=0.10) are -1.345 (assuming equal variances) and -1.383 (assuming unequal variances). For both critical values the result shows that the centers of gravity for function are significantly before the centers of gravity for structure.
1
The null hypothesis that is used is that the centers of gravity are equal.
10
Function 0.354 0.079 0.047 -1.517 0.076 0.082
Mean Variance Pooled Variance t value P value (Equal Var) P value (Unequal Var)
Structure 0.518 0.015
Table 5 T Test Comparing the Centers of Gravity of Function and Structure
The first hypothesis is based on the view of Gero and Rosenman (1990) that the design process moves from a design requirement, expressed in terms of function, to a design description given in terms of structure. The hypothesis asserts that designers initially spend most of their time considering function and later spend most of their time considering structure. A description of the design process, based on the results, is that the subjects initially spend more time reasoning about function. They progress through a stage where they are reasoning about all three categories. They then move to a stage, at the end of the design episode, where they are reasoning about only structure and behaviour. The first part of the hypothesis concerning function is supported. The assertion that there is more time spent reasoning with structure at the end of the design episode is not supported. The hypothesis represents one interpretation of Gero and Rosenman’s (1990) view of design as a "process of arriving at a structure description from a function description". While the results do not agree fully with the hypothesis they are not inconsistent with Gero and Rosenman’s view. A model proposed by Tham (1991) and Gero et al (1992) agrees very well with the results. The model describes an initial period where functional requirement is translated into behavioral description. This accounts for more time initially spent reasoning with function, as found in the experiment. The next stage in their model, of selecting structure and comparing its actual behaviour with the desired behaviour, corresponds to the middle period of reasoning in all three categories. Their refinement process, where the structure is modified to account for discrepancies between the actual behaviour and the desired behaviour and new actual behaviour is derived from the modified structure, matches the period at the end of the design episode when the subjects were reasoning about behaviour and structure. 5.2 Analysis, Synthesis and Evaluation The second hypothesis is concerned with the designers’ strategies. The specific hypotheses can be tested using the micro strategy data that has been collected. The first of the specific hypotheses states that the designer cycles between the three activities in the order of analysis of the problem, synthesis of a solution, and then evaluation of the solution. A Markov analysis is used to test the hypothesis. The micro strategy data is analyzed to identify transitions between the three groups of categories of analysis, synthesis and evaluation. The results are normalized so that results from each protocol can be compared. The hypothesis can be reformulated into three assertions that should be apparent in the Markov analysis: 1. Transitions between analysis and synthesis should be more likely than transitions between analysis and evaluation.
11
2. Transitions between synthesis and evaluation should be more likely than transitions between synthesis and analysis. 3. Transitions between evaluation and analysis should be more likely than transitions between evaluation and synthesis. A paired t test was used to compare transitions between states for all design episodes1. The results are given in Table 6. The critical t value (α=0.05) is 1.860. The results indicate very strongly that the most likely event to follow analysis is a synthesis event and the most likely event after synthesis is evaluation but that the most likely event after evaluation is synthesis. The results support the first two assertions above but the third result is in strong opposition to the third assertion.
Mean Variance Pooled Variance t value P value (Equal Var) P value (Unequal Var)
An-Sy 0.513 0.034 -0.006 4.090 0.081 0.087
An-Ev 0.169 0.017
Sy-Ev 0.718 0.023 -0.001 11.886 0.228 0.229
Sy-An 0.080 0.002
Ev-An 0.151 0.009 0.002 -8.768 0.040 0.046
Ev-Sy 0.614 0.020
Table 6 T Test Comparing the Markov Transitions
This result may be explained by the fact that there are few analysis events later in the design episodes and that after initial analysis is complete the cycle tends towards a two state cycle between synthesis and evaluation. To investigate this explanation the Markov data was divided into deciles. In the early stage of the design episodes there should be more transitions from evaluation to analysis and these should reduce towards the end of the design episodes. The decile data was aggregated over all design episodes and a graph of transitions from evaluation to analysis against transitions from evaluation to synthesis is produced in Figure 4. The graph shows that in the first decile the number of transitions from evaluation to analysis is equal to the number of transitions from evaluation to synthesis, both 45 percent. The number of transitions from evaluation to analysis then reduces while transitions from evaluation to synthesis are generally higher than fifty percent.
Figure 4 Markov Transitions by Decile
1
The null hypotheses are that the transitions in each of the pairs are equally likely.
12
A linear regression was calculated for the “evaluation to analysis” data to test for a significant negative slope. The results, presented in Table 7 show that there is indeed a significant negative slope of -0.032. Transitions R Square Coefficient t Statistic P-value
0.580 -0.032 -3.327 0.009
Table 7 Linear Regression of Markov Transitions from Evaluation to Analysis
The second of the specific hypotheses states that conceptual design begins with the designer spending more time on analysis of the problem. This is followed by a period characterized mainly by synthesis. Finally there is a period characterized mainly by evaluation of the problem. The hypothesis is concerned with the trends in the micro strategy dimension for the duration of the design episode.
Figure 5 A typical graph for Micro Strategy Groups verses time (Subject E02).
The three groups of analysis, synthesis and evaluation were filtered and included on the same graph using the same method as for the function-behaviour-structure dimension. Figure 5 shows the general trend where subjects begin by Analysing the problem for a short period of time. Their time is then divided between synthesis and evaluation. The graphs generally support the hypothesis. There is a general trend in the graphs for more time spent on analysis at the beginning of the design episodes with the time later in the design episode being spent mainly on synthesis and evaluation. Although the example given in Figure 5 shows a trend towards mainly evaluation at the end of the design episode the trend is less apparent in the graphs for other design episodes.
R Square Coefficient t Statistic P-value
Analysis 0.118 -0.350 -3.372 0.001
Synthesis 0.010 0.081 0.913 0.364
Evaluation 0.095 0.269 2.981 0.004
Table 8 Aggregate Regression Results for Micro Strategies
A linear regression is calculated by combining decile data from each subject in the same way as for the function-structure-behaviour dimension. The expected results from the hypothesis are a significant negative slope in the analysis group, no significant slope for synthesis and a
13
significant positive slope in the evaluation group. The results, given in Table 8, agree with the expected results. Centers of gravity are calculated for each coding group in similar fashion to those calculated for function, behaviour and structure. The hypothesis predicts that the centers of gravity for analysis are significantly before fifty percent of episode time, the centers of gravity for synthesis are not significantly different to fifty percent of episode time and that the centers of gravity of evaluation are significantly after fifty percent of episode time. Three paired t tests are performed on the centers of gravity data for all of the subjects for the three sets of data1. The critical t values (α=0.10) are -1.415 and 1.415. The results of the single sample t test are given in Table 9. The results show that the centers of gravity for analysis are significantly before fifty percent of the episode time, the centers of gravity for synthesis are not significantly different to fifty percent of the episode time and the centers of gravity for evaluation are significantly later than fifty percent of the episode time.
Mean Variance t value P value
Analysis 0.350 0.088 -1.424 0.099
Synthesis Evaluation 0.518 0.564 0.015 0.014 0.423 1.535 0.423 0.084
Table 9 T Test Comparing the Centers of Gravity with 50% of Episode Time
The second hypothesis is based on a view that is common in the literature (Asimow 1962, Watts 1966, Broadbent 1973, Gasson 1974, Hubka 1982, Coyne et al 1990, Candy and Edmonds 1994 and Dym 1994) that the design episode can be characterized by a series of cycles through analysis of the problem, synthesis of a solution, and evaluation of the solution. In addition to the short term cycles, there is a trend over the whole design episode to begin by spending most of the time Analyzing the problem then mainly synthesizing the solution and finishing by spending most time on the evaluation of the solution. The results show that there is a general trend, over the duration of the design episode, to initially analyze the problem and then move to synthesis followed by evaluation. There are also smaller cycles of analysis, synthesis and evaluation occurring throughout the design episode. The episode begins with the subjects cycling through the three activities of analysis, synthesis and evaluation with most of the time spent on analysis. This changes, after about ten minutes, to cycles where the time is spent evenly on the three activities. Later, the subjects engage in two way cycles between synthesis and evaluation with very little time spent on analysis. These results are in agreement with the general hypothesis. The first specific hypothesis asserts that the three way cycles occur over the duration of the design episode. However, the experiment reveals that the analysis phase occurs infrequently later in the design episode, where two phase cycles between synthesis and evaluation occur. This is not predicted in any of the literature. The common view suggests that a three way cycle exists throughout the design episode with emphasis changing from analysis in the initial phase to synthesis then to evaluation. The results show an overall trend from most time spent on analysis, to most time spent on synthesis, to most time spent on evaluation. The results represent only a minor departure from the views expressed in the literature and we may conclude that the second hypothesis is supported by the results.
1
The null hypotheses are that the centers of gravity for each of the three groups are not significantly different to fifty percent of the episode time.
14
6. Conclusion Protocol analysis was used to capture and represent the design process as a sequence of events in time. Protocol analysis techniques were extended through the use of a domaindependent coding scheme based on generic models of design and a coding methodology based on the Delphi method. These techniques allow us to bring quantitative structure to the qualitative data that is collected during a design episode, facilitating the articulation of many aspects of the behaviour of designers. Some generalizations proposed by authors of the prescriptive and descriptive approaches to design study were used to derive hypotheses that were objectively tested. Support for these hypotheses was found. A designer begins a conceptual design session by Analyzing the functional aspects of the problem. As the session progresses the designer focuses on the three aspects of function, behaviour and structure and engages in a cycle of analysis, synthesis and evaluation. Towards the end of a design session the designer’s activity is focussed on synthesizing structure and evaluating the structure’s behaviour. As research in engineering design moves from the current stage, of making observations to the stage of making generalizations from the observations and building models, it may be possible to establish principles of “good designing”. The principles could be taught and objective criteria for the assessment of design ability may well be able to be established. The work described in this paper represents a beginning. Progress from here can take place in three areas: further measurements can be derived from the data; assessment of other hypotheses about design can be tested; and the method used can be further developed. The protocol data collected for this study represents a rich source which may be used to further test theories about the design process. The amount of time spent on an activity over the duration of the episode and the sequence of transitions between activities have been investigated thus far. Another aspect that may be investigated is the length of time spent in a single segment of activity before moving on. A spectrum of segment times could be constructed and the average segment time for each activity could be compared. It would then be possible to address questions such as whether a designer spends longer in segments of analysis than in synthesis or evaluation. In addition to examining the data to gain insights into the design process, further hypotheses derived from current views of the design process could be tested using the data. The hypotheses tested in this work are preliminary and general in nature. Hypotheses more specific than those presented could be tested. Some questions that could be addressed are: do designers in all disciplines follow a top down approach; do designers in some disciplines spend more time on Analyzing the problem; do designers in some disciplines spend more time reasoning with function; is there a difference in the activities of novice versus expert designers? The method used in this study may be further developed to address specific questions about design. The authors are currently investigating ways to extend the method to examine the role of drawing in the design process (Suwa et al 1998). Acknowledgments This work is supported in part by a grant (No. A89601894) from the Australian Research Council. References Asimow, M. (1962). Introduction to Design, Prentice-Hall, New York.
15
Broadbent, G. (1973). Design in Architecture, Architecture and the Human Sciences, John Wiley & Sons, London. Candy, L. and Edmonds, E.A. (1994). Artefacts and the Designer’s Process: Implications for Computer Support to Design, Revue Sciences et Techniques de la Conception, 3 (1): 11-31. Coyne, R. D., Rosenman, M. A., Radford, A. D., Balachandran, M. and Gero, J.S. (1990). Knowledge Based Design Systems, Addison-Wesley, Reading, Massachusetts. Cross, N. (1984). Developments in Design Methodology, John Wiley, London. Cross, N., Dorst, K. and Roozenburg, N. (1992). Research in Design Thinking, Delft University Press, Delft. Cross, N., Christiaans, H. and Dorst, K. (eds) (1996). Analysing Design Activity, John Wiley, Chichester. Dixon, J. R. (1988). On Research Methodology Towards a Scientific Theory of Engineering Design, Artificial Intelligence for Engineering Design, Analysis and Manufacturing, 1 (3). Dym, C. L. (1994). Engineering Design: A Synthesis of Views, Cambridge University Press, Cambridge. Edmonds, E.A. and Candy, L. (1993). Knowledge Support Systems for Conceptual Design: The Amplification of Creativity, in Salvendy and Smith (eds), Human-Computer Interaction: Software and Hardware Interfaces - HCI International ‘93, Elsevier, Amsterdam, pp 350-355. El-Turky, F. M. and Nordin, R.A. (1986). BLADES: An Expert System for Analog Circuit Design, IEEE International Symposium on Circuits and Systems IEEE, pp 552-555. Ericsson, K.A. and Simon, H.A. (1993). Protocol Analysis; Verbal Reports as Data – Revised Edition, MIT Press, Cambridge, Massachusetts. French, M.J. (1992). Conceptual Design for Engineers, The Design Council, London. Gasson, P. (1974). Theory of Design, BT Batsford, London. Gero, J.S. and Mc Neill, T. (1997). An Approach to the Analysis of Design Protocols, Research in Engineering Design, Springer-Verlag, London, (to appear). Gero, J.S. and Rosenman, M. A. (1990). A conceptual framework for knowledge-based design research at Sydney University's Design Computing Unit, Artificial Intelligence in Engineering 15 (2): 65-77. Gero, J. S., Tham, K. W. and Lee, H. S. (1992). Behaviour: a link between function and structure in design, in D. C. Brown, H. Yoshikawa and M. Waldron (eds), Intelligent Computer-Aided Design, North-Holland, Amsterdam, pp 193-225. Guindon, R., Krasner, H. and Curtis, B. (1987). Cognitive Process in Software Design: Activities in Early Upstream Design, Proceedings of the Second IFIP Conference on Human Computer Interaction, Stuttgart, Germany, pp 383-388. Hubka, V. (1982). Principles of Engineering Design, Butterworths, London. Lang, M.H. and Mc Cormick, P. E. (1986). Hierarchical Design Methodologies: A VLSI Necessity, in S. Goto (ed), Design Methodologies, North Holland, Amsterdam, pp 123-149. Linstone, H.A. and Turoff, M. (1975). The Delphi Method; Techniques and Applications, Addison-Wesley, Reading, Massachusetts. Lloyd, P., Lawson, B. and Scott, P. (1996). Can concurrent verbalisation reveal design cognition? in Cross, N., Christiaans, H. and Dorst, K. (eds), Analysing Design Activity, John Wiley, Chichester, pp. 437463.
16
M'Pherson, P.K. (1981). A Framework for Systems Engineering Design, The Radio And Electronic Engineer, 51 (2): 59-93. Mc Neill, T. (1998). The Anatomy of Conceptual Electronic Design, Doctoral Dissertation, University of South Australia, Adelaide. Mc Neill, T. and Edmonds, E.A. (1994). An Empirical Study of Conceptual Electronic Design, Revue Sciences et Techniques de la Conception, 3 (1): 61-86. Mead, C. and Conway, L. (1980). Introduction to VLSI Systems, Addison-Wesley, Reading, Massachusetts. Mostow, J. (1985). Towards Better Models of Design, AI Magazine, 6 (1): 44-57. Pahl, G. and Beitz, W. (1984). Engineering Design, The Design Council, London. Purcell, A.T. , Gero, J.S., Edwards, H.M. and Mc Neill, T. (1996). The Data in Design Protocols: The Issue of Data Coding, Data Analysis in the Development of Models of the Design Process, in Cross, N., Christiaans, H. and Dorst, K. (eds), Analysing Design Activity, John Wiley, Chichester. Sullivan, G. A. and Mutch, K.M. (1986). Issues for the Construction of an Automatic Analog Circuit Design System. Fifth Annual Phoenix Conference on Computers and Communications, Phoenix, Arizona, pp 568-571. Suwa, M., Gero, J. S. and Purcell, T. (1998) The roles of sketches in early conceptual design processes, CogSci’98 (to appear) Tham, K.W. (1991). A Model of Routine Design Using Design Prototypes, Doctoral Dissertation, Sydney University, Sydney. Thomas, D. E. (1986). Automatic Data Path Synthesis, in S. Goto, Design Methodologies, North Holland, Amsterdam, pp 401-439. Ullman, D.G, Deiterich, T.G and Stauffer, L. (1988). A Model of the Mechanical Design Process Based on Empirical Data, Artificial Intelligence in Engineering, Design and Manufacture, 2(1), 33-52. Umbach, F. W. (1992). Design of Extensive Measurement Systems, in P.H. Sydenham & R. Thorn (eds) Handbook of Measurement Science, Volume 3, John Wiley & Sons Ltd, pp 1947-1977. van Someren, M.W., Barnard, Y.F. and Sandberh, J.A.C. (1994). The Think Aloud Method; A Practical Guide to Modelling Cognitive Processes, Academic Press, London. VDI. (1987). VDI-2221: Systematic Approach to the Design of Technical Systems and Products, Verein Deutscher Ingenieure, (English Translation), VDI-Verlag. Watts, R. D. (1966). The Elements of Design, in S.A. Gregory (ed), The Design Method, Butterworths, London, pp 85-95. Zimmermann, G. (1986). Top Down Design of Digital Systems, in E. Horbst (ed), Logic Design and Simulation, North Holland, Amsterdam, pp 9-30.
17
Appendix A: The Design Brief In hospitals for the mentally ill staff sometimes find themselves in need of some form of assistance. The need can range from a requirement such as assistance to lift a patient to a need for security personnel where the staff member's personal safety is compromised. Currently, systems exist where by the staff member can activate one of many alarm buttons that are positioned on the walls of the ward. There are three short comings of the current system. The staff member may not always be able to reach the alarm point. The alarm point can be activated by anyone giving the potential for false calls. Thirdly, the system does not give the staff member the ability to indicate the urgency of the need for assistance. The aim of this exercise is to design a system where a request for assistance can be received and the location of the person in need can be readily determined. Each staff member carries a device on their person which would be used to make an urgent or non-urgent request. The request would be received by a central control point from which the appropriate response can be initiated. The device should be designed to meet the following requirements: * * * *
Be compact and easy to carry and use. Allow for urgent and non urgent requests. Be inexpensive to produce in large quantities. The device should send a signal which is unique to each device.
The central control point should be able to present to an operator the following information: * Location of the staff member making the request. i.e. A room number. * Identity of the staff member. * Priority of the request (urgent/non urgent). Detailed schematic drawings are not required. Simple, rough outline sketches of a block diagram of the system are all that is needed. The sketches may be annotated with written comments to clarify your intentions. You will be allowed 45 minutes to complete the design. If you wish you may complete more than one design. Please number each individual design.
18