Business applications (i.e., cost-effective development, ... The execution of Java programs can behave differently .... shown only for the interpreting mode and small instruction .... with a JIT compiler, there is only one branch that accounts.
Understanding Control Flow Transfer and its Predictability in Java Processing Tao Li and Lizy Kurian John Laboratory for Computer Architecture Department of Electrical and Computer Engineering The University of Texas at Austin, Austin, TX 78712 {tli3,ljohn}@ece.utexas.edu Abstract An in-depth look and understanding of control flow transfer and its predictability can guide architects to adapt control flow prediction hardware in Java processing or finely tune the performance of JVM software on general purpose machines. To our knowledge, this paper provides the first insight of branch behavior on a standard Java Virtual Machine with real workloads. Employing a complete system simulation environment, we profile branch execution characteristics and quantify the performance of a wide range of prediction schemes on both user and kernel code. The impact of different JVM styles (JIT compiler and interpreter) on branch behavior is also studied. We find that: (1) Kernel branches constitute a significant portion of total branch execution in Java processing; (2) Kernel and user code favor different prediction mechanisms; (3) Java processing exercises fairly large number of branch sites and large control flow footprint compared with the execution of benchmarks such as SPECInt95; (4) A major part of the dynamic indirect branches are multiple target (polymorphic) branches. Target addresses of indirect branches, especially those in interpreting mode are highly interleaved and cause high BTB misprediction.
1. Introduction Java is becoming increasingly important with the pervasiveness of the World Wide Web and intelligent mobile devices. Its “write-once run-anywhere” promise has resulted in portable software for systems spanning from embedded processors to high-end servers. Recently, the demanding requirements of the new breed of eBusiness applications (i.e., cost-effective development, deployment and maintenance, reusability of application components, and cross-platform support) have also contributed to the rapid adoption of Java technologies [1]. The execution of Java programs can behave differently from that of traditional C/C++ and FORTRAN code [15] because a Java Virtual Machine (JVM) [16] and related runtime support are involved in exercising the machine neutral format known as bytecode. Typically, JVM
implementations rely on runtime interpretation [17], Justin-Time Compilation [5] or a hybrid of the two [10]. Previous research [18, 15] shows that performance of Java execution is largely dependent on the mode of translation employed. Java is designed to support the safe execution of portable programs across platforms and networks and hence provides unique language features (e.g. dynamic class loading and validation, runtime exceptions checking, automatic garbage collection, multithreading and synchronization) which are absent in other programming languages such as C and C++. Moreover, many Java classes require services provided by the underlying operating system and can spend a significant amount of time in exercising the native code interfaces and OS services [15]. The complexity of Java processing dynamic translations (interpretation and compilation), frequent calls to native interface libraries or OS services, presence of various JVM components and abundant usage of virtual methods - can complicate intrinsic control flow transfer within the instruction stream. Today, nearly all high performance microprocessors support instruction level parallelism (ILP). Within such microprocessors, an instruction fetch unit at the front-end of the pipeline must continually provide a smooth instruction stream to the back-end logic stages. Accurate control flow prediction is imperative for improving ILP processor performance, especially on wide issue and deeply pipelined superscalar machines where the misprediction penalty is high. Consequently, there continues to be ongoing research to improve branch prediction accuracy, especially on real-world applications and emerging workloads whose branch behavior is not well understood. These motivate us to characterize control flow transfer in Java technology and understand its microarchitectural implications. This paper presents results from an in-depth look at branch behavior and characteristic of Java runtime systems. Employing a complete system simulation environment, we quantify the performance of branch prediction structures for both user and kernel executions. The impact of different JVM styles (JIT compiler and
interpreter) is studied. Our research specifically attempts to answer the following questions: •What is the control flow transfer characteristic encountered on a microprocessor with speculative execution during Java processing? Is it different from that of applications such as SPECInt95? Is branch behavior different with different JVM styles (interpretation or JIT compilation)? •Does a Java runtime system spend a significant portion of time in executing branches from the underlying JVM and its native interface libraries? Do different applications use the JVM environment in a similar style? •What is the control flow characteristic of kernel code? Does a significant part of control flow transfer in Java execution occur in kernel mode? Are branch behavior studies in Java without OS activity representative of the aggregate Java branch behavior? •How do Java executions in JIT and interpreting modes fare with the widely used branch predictors? Do various JVM implementations favor different branch prediction schemes? How suited are the kernel and user parts of the JVM execution to the underlying prediction hardware? What is the optimized prediction scheme for each? •How are the targets of the indirect branches distributed? Will the conventional Branch Target Buffer (BTB) structure work well with the indirect branch rich Java runtime system? The major observations and contributions of this study are: •Kernel instructions and kernel branches play an important role in the execution of Java programs. Kernel has higher control flow transfer frequency than that of user code. Kernel and user code in a Java runtime system use the underlying speculative mechanisms in different styles. •Java execution involves fairly larger number of static conditional branches (with an average of 37K in JIT mode and 29K in interpreting mode, as opposed to 4.4K in SPECInt95), implying its inherently complex control flow graphs. •Indirect branch frequency during Java execution is much higher than that during SPECInt95 execution. These indirect branches are primarily from switch-case statements in the JVM interpreter and virtual function calls in Java code. •Most of the invoked (dynamic) indirect branches are polymorphic, meaning control is transferred to multiple targets. Various JVM styles affect indirect branch target transfer patterns drastically. In interpreting mode, target address transfer of indirect branches is highly interleaved and causes high BTB misprediction. Conventional BTB structures are not very effective for Java’s indirect branches. •The targets of the polymorphic indirect branches are clustered with high locality. Thus, Java processing exhibits
a new kind of locality in interpreting mode - branch target address locality, according to which a few target addresses appear very frequently in polymorphic indirect branch instances. These observations can be exploited while designing microarchitectural structures in future processors. For instance, the fact that kernel and user code favor different branch predictors suggests that split branch predictors may be effective for Java. Similarly, the locality shown by the targets of the indirect branches suggests that BTB structures that capture multiple target information from a few indirect branches may be effective in improving target prediction in Java applications. The rest of this paper is organized as follows. Section 2 briefly reviews previous and related research work. Section 3 describes the simulation environment, experimental methodology and benchmarks used in this study. Section 4 characterizes the conditional branch behavior of user and kernel code. Section 5 addresses indirect branch issues in Java processing. Section 6 makes conclusions and points out future research directions.
2. Related Work Many schemes have been proposed in the literature to enhance branch prediction performance on ILP machines [23, 4, 24, 8, 6]. These studies are largely concentrated on analysis and optimization of user-only branch prediction of SPECInt95 and C++ code. The control flow transfer characteristics of Java processing are not well understood. A recent paper [18] studies the branch predictability of SPECjvm98 benchmarks using a limited range of predictors. They show that predictability of interpreter branches is low, but they do not investigate the causes or the intrinsic behavior of branches themselves. This paper addresses this issue by performing both in-depth branch behavior characterization and predictability analysis. Hsieh, Conte and Hwu [12] compare the performance of Java code run on the Sun JDK 1.0.2 Java interpreter to code compiled through Caffeine [11]. Java code is also compared with compiled C/C++ versions of the code. It is observed that microarchitectural mechanisms, such as branch target buffers, are not well exploited by Java interpreters. Translating Java bytecodes to native code alleviates some of these problems. Compared with their study, this paper presents results on branch behavior of a standard JVM running on a commercial OS using real workloads. Driesen and Hölzle [6] investigate a wide range of twolevel predictors dedicated exclusively to indirect branches using programs from the SPECInt95 suite as well as a suite of large C++ applications. Indirect branch prediction studies using SPECint95 have been reported in [4]. A related study [21] examines the effectiveness of using path history to predict target addresses of indirect branches for
virtual method invocations used in Java applications. The XOR hashing scheme with a global path history and a 2-bit update policy is found to perform the best. This result is shown only for the interpreting mode and small instruction footprint benchmarks (richards and deltablue) and does not include kernel code. So far, the indirect branch characterization of Java processing, including OS and with different JVM implementations, is not well understood. Gloy et al. [7] analyze system traces from the Instruction Benchmark Suite (IBS) and find that user-only traces yield fidelity when the kernel accounts for less than 5% of the total executed instructions. Their simulation results show that including kernel branches in the branch trace worsens the effects of aliasing. In our study, a complete system simulation environment is used to accurately capture control flow transfer scenario during Java processing. To our knowledge, no previous study has looked at branch prediction issues on Java processing by examining kernel execution. We provide a detailed characterization and performance analysis of branch behavior in Java runtime systems, in kernel and user mode.
3. Methodology and Benchmarks This work is based on simulation analysis of branch instruction traces generated from a complete system simulation environment. The simulation platform used in our study is SimOS [9], which models hardware components with enough detail to boot and run a fullblown commercial operating system. In this study, the SimOS version that runs Silicon Graphics IRIX5.3 operating system is used. Interpreter and JIT compiler from Sun Microsystems Java Development Kit (JDK) [17] are simulated on top of IRIX 5.3 operating system. To characterize both user and kernel branch behavior in Java processing, we instrument SimOS MXS simulator [2] and generate full system traces. Table 1. Benchmarks Benchmarks compress jess db javac mtrt jack
Description Modified Lempel-Ziv method (LZW) to compress and decompress large file Java expert shell system based on NASA’s CLIPS expert system Performs multiple database functions on a memory resident database The JDK 1.0.2 Java compiler compiling 225,000 lines of code Dual-threaded raytracer Parser generator with lexical analysis, early version of what is now JavaCC
Our studies are based on programs from the SPECjvm98 [20] suite (see Table 1), a set of programs intended to evaluate performance for the combined
hardware (CPU, cache, memory, and other platformspecific performance) and software aspects (efficiency of JVM, the JIT compiler, and OS implementations) of the JVM client platform. In this paper, we exclude benchmark mpegaudio from our experimental evaluations because it failed to execute on the MXS model of SimOS. Due to the large slowdown of complete system simulation using superscalar model MXS and in order to capture the execution behavior of entire programs, we use the s1 data set and run each benchmark until completion.
4. Behavior of Conditional Branches in Java Runtime Systems The goal of this paper is to understand control flow transfer while executing Java applications. We begin by characterizing branch behavior of a Java runtime system (with different implementation styles and including operating system activity). Then branch predictability is investigated in section 4.3.
4.1. Branch Frequency and Mix Table 2 presents branch profiling results of the studied Java runtime system and OS running SPECjvm98 benchmarks. Branch instructions are categorized as conditional branches, direct branches that unconditionally redirect instruction streams to a statically specified target encoded in the instruction itself, (non-return) indirect branches which transfer control to an address stored in a register, and call/returns which always use jump and link instruction (e.g. jal, jalr) and a specified architecture register (e.g., r31 on MIPS machines). For each benchmark, the table lists branch frequency expressed as branches per instruction for each category, in both user and kernel modes. The execution of these benchmarks in both JIT compiler (jit) and interpreter (intr) is profiled. In user mode and with a JIT compiler, on the average conditional branches contribute 77% of total branches, and the rest represent 0.4% (direct), 10.4% (call/return) and 12.2% (indirect) of all branches. Compared with kernel code, the higher indirect branch mix corresponds to virtual method calls in Java code. Table 2 indicates that the interpretation increases indirect branch ratio in branch instructions from 12.2% to 18.4%. The interpreter mode results in higher frequency of indirect control transfers due to additional indirect jumps used to implement the switchcase statements for case by case interpretation [18]. Moreover, Table 2 reveals that kernel has higher number of branches per instruction than that of user codes. Kernel branches include loops, error and bounds checking, and other routine conditionals. Error and bound checking related branches are abundant in operating system because it has to be designed to handle all possible situations [22].
Table 2. Branch frequency and mix (jit: JIT compilation, intr: interpretation) Benchmarks
intr
jit
All compress jess db javac mtrt jack AVG compress jess db javac mtrt jack AVG
0.202 0.215 0.261 0.254 0.227 0.164 0.221 0.254 0.211 0.260 0.251 0.230 0.149 0.226
Kernel Branches per Instruction Call/ Cond. Direct Return 0.184 0.008 0.009 0.184 0.014 0.015 0.232 0.013 0.014 0.229 0.012 0.012 0.206 0.010 0.010 0.144 0.009 0.010 0.197 0.011 0.012 0.230 0.011 0.012 0.182 0.013 0.014 0.231 0.013 0.014 0.226 0.011 0.012 0.209 0.010 0.011 0.132 0.008 0.008 0.202 0.011 0.012
Indirect
All
0.001 0.002 0.002 0.002 0.001 0.002 0.002 0.001 0.002 0.002 0.001 0.001 0.001 0.001
0.177 0.158 0.156 0.155 0.171 0.165 0.164 0.143 0.144 0.153 0.155 0.137 0.149 0.147
User Branches per Instruction Call/ Cond. Direct Return Indirect 0.153 0.000 0.009 0.015 0.112 0.001 0.020 0.025 0.114 0.002 0.020 0.021 0.119 0.001 0.017 0.019 0.138 0.000 0.015 0.017 0.124 0.000 0.018 0.023 0.127 0.001 0.017 0.020 0.108 0.000 0.001 0.034 0.102 0.000 0.013 0.029 0.107 0.002 0.019 0.026 0.110 0.001 0.019 0.025 0.108 0.000 0.006 0.023 0.109 0.000 0.013 0.026 0.107 0.001 0.012 0.027
4.2. User vs. Kernel Branches Table 3. Characterization of User/Kernel Conditional Branches (JIT: with JIT compiler, INTR: with interpreter) User Benchmarks db jess javac jack mtrt compress
JIT INTR JIT INTR JIT INTR JIT INTR JIT INTR JIT INTR
SPECjvm98 JIT AVG INTR SPECInt95 AVG
Static Sites 33,957 29,219 38,654 29,477 38,815 29,487 40,640 29,164 36,629 29,373 33,907 28,383 37,100 29,184 4,413
Kernel Dynamic Dynamic Static Sites Instances Instances 13,147,512 6,016 19,742,706 11,585,463 6,014 20,576,410 35,986,299 6,037 28,266,026 39,335,967 6,034 28,790,197 34,766,245 6,070 20,807,714 25,467,007 6,070 21,340,379 210,722,195 6,142 40,451,532 249,267,660 6,143 47,513,966 195,674,102 6,099 23,343,298 284,752,333 6,148 22,702,360 406,427,219 6,081 26,101,839 212,303,879 5,995 20,707,607 149,453,929 6,074 26,452,186 137,118,718 6,067 26,938,487 -4,150 --
Table 3 shows conditional branch characterization of user and kernel code on the studied Java runtime system. Statistics are based on simulation of each benchmark (using s1 data sets) on SimOS MXS model until completion, except for compress invoked with an interpreter, which takes extremely long time to finish. In this case, we use the first 2,000M instructions as the representative execution window based on the profiling of entire execution on SimOS Mipsy model. Both user and kernel branch statistics are presented as static branch sites and dynamic instances. Additionally, the percentages of kernel branches are tabulated. We run SPECInt95 benchmarks until completion (with scaled test data set) on
% of Kernel Dynamic Instances 15.1% 60.0% 17.1% 64.0% 13.5% 44.0% 17.0% 42.3% 13.5% 37.4% 17.1% 45.6% 13.1% 16.1% 17.4% 16.0% 14.3% 10.7% 17.3% 7.4% 15.2% 6.0% 17.4% 8.9% 14.1% 29.0% 17.2% 30.7% 48.5% 4.3%
Static Sites
the same simulated architecture and the average numbers are also listed in Table 3. Considered statically, user code has higher number of branch sites: on the average, user codes contain 37K static branches in JIT mode and 29K static branches in interpreting mode. Compared with SPECInt95 (with an average of 4.4K static branches in user code), the execution of SPECjvm98 involves instructions both from Java applications and JVM (complicated software designed to support various runtime activities demanded by Java specification). The relatively small variance (1% 8%) on the number of static branches across workloads in user space implies that a significant portion of conditional
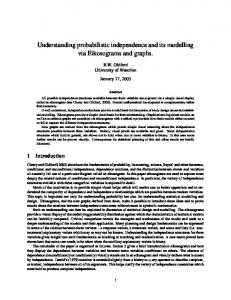
branches are workload independent and hence, probably JVM inherent. Compared with user code, kernel only exercises 6K static conditional branch sites, which stem from the highly localized kernel routine invocation characteristic found in SPECjvm98 execution [15]. It is found that kernel branches account for 29% of dynamic branch instances in JIT mode and 30% in interpreting mode, in comparsion to 4.3% in SPECInt95. This observation suggests that kernel instructions and branches constitute a significant portion of branch execution in Java processing and ignoring them will not capture complete and accurate branch execution behavior. We analyze the dynamic conditional branch distribution during the entire execution of each benchmark. Figure 1 shows the results for benchmarks db, jess and javac in both JIT and interpreting modes. The data is plotted as
branch identifier (Branch ID) vs. percentage of branch execution. The branch identifier is uniquely numbered based on the call site, namely program counter (PC) value of the branch instruction. For example, in benchmark db with a JIT compiler, there is only one branch that accounts for 13.4% of dynamic instances, with the rest having a value (percentage of branch execution) less than 2%. A more interesting observation is that dynamic conditional instances are distributed in a similar style across different benchmarks, i.e., the most frequently invoked branches are clustered together, spanning approximately the same range of branch sites. This similarity indicates that the studied applications use JVM and its native libraries in a similar way and it may be possible to “preoptimize” these heavily executed JVM parts, using profile-based compiler optimizations suggested in past research [3].
Figure 1. Dynamic distribution of conditional branches based on call sites (JIT: with JIT compiler, intr: with interpreter)
Figure 2 provides more insight on branch direction and runtime behavior by revealing the number of unique branch sites constituting the given portion of total dynamic branch instances and the percentage of taken branches that correspond to that portion. The above statistics are normalized for user and kernel spaces separately. For comparison, the average SPECInt95 statistics in user space are also shown. We ignore the kernel part of SPECInt95 because of its negligible impact (see Table 3). Figure 2 demonstrates that the execution of SPECjvm98 benchmarks (i.e. jess, db and jack) can contain a fairly larger number of static conditional branches compared with that of SPECInt95. However, when the dynamic branch behavior is examined, a small number of distinct
branches contribute to the overwhelming majority of the branch instances. For example, in user space, less than 200 branch sites accounts for the 50% of dynamic branch instances. This number further drops to 15 in kernel space. It is found that the percentage of taken branches decreases when more dynamic branches are considered. This implies that a significant portion of branches tends to be not taken. The abundant runtime checking codes (e.g. bytecode validation and exception checking) that are rarely taken contribute to more not taken branches compared with loop-rich SPECInt95 benchmarks which show higher taken percentage. This observation also holds for kernel branches, where the taken path usually transfers program counter to exception handling code [19].
90
100
80
90 80
% of Taken Branches
70
% of Dynamic Branches
db user jess user javac user jack user mtrt user compress user SPECInt95 user
60 50 40 db user jess user javac user jack user mtrt user compress user SPECInt95 user
30 20 10
70 60 50 40 30 20 10
0
0 0
200
400
600
800
1000
1200
1400
0
10
20
# of Unique Branches 90
100
80
90
40
50
60
70
80
90
100
80
% of Taken Branches
70
% of Dynamic Branches
30
% of Dynamic Branches
60 50 40 db kernel jess kernel javac kernel jack kernel mtrt kernel compress kernel
30 20
70 60 50 40 db kernel jess kernel javac kernel jack kernel m trt kernel compress kernel
30 20
10
10
0
0 0
50
100
150
200
250
0
10
# of Unique Branches
20
30
40
50
60
70
80
90
100
% of Dynamic Branches
Figure 2. Static and dynamic branch distributions (in JIT mode, branches are sorted by their dynamic frequency)
4.3. Branch Prediction Performance In this section, various branch prediction schemes are evaluated for Java code (see Table 4). The examined branch prediction schemes, ranging from a simple perbranch 2-bit saturating counter table (2bc) indexed by branch instruction address to more sophisticated two-level adaptive schemes which exploit patterns in the recent global (GAg, GAs and Gshare) or local (SAg and SAs) branch history, have been shown to be successful at predicting user-level branches [24, 7].
History Shift Registers (BHSRs) to record the recent branch history: GAg, GAs and Gshare exploit single BHSR to record and maintain global history information while SAg and SAs schemes map each program branch into a table of BHSRs. The content of the selected BHSR is combined with a portion of the branch address to select a BHT entry. For example, SAs.16K contains 4K BHSR entries of 4-bit history path, and 512 BHT sets, each of which consists of 16 2-bit counter entries indexed by the 4bit history path. In our study, we use a 2K-entry, 4-way Branch Target Buffer (BTB) with LRU replacement policy. Figure 3 shows the prediction performance for conditional branches with various branch prediction schemes. The average misprediction rate on all of the examined SPECjvm98 benchmarks is shown. Note that the aggregate misprediction rate is broken down and normalized to user and kernel parts separately for comparison. It is observed that kernel and user codes favor various prediction schemes. For example, in user space, the simple 2bc scheme outperforms Gshare and GAg predictors while in kernel space the 2bc scheme yields a misprediction rate as high as 13%. This implies that kernel code takes more advantage of history pattern than user code. Another observation is that local history based predictors (e.g. SAg and SAs) contribute to the protection of branch history patterns for both kernel and user parts and hence yield the best prediction performance. For example, a SAg.8k scheme reduces kernel branch misprediction rate to less than 2%.
Table 4. Branch Predictor Configurations Branch (PC) bits used for Scheme size (i=1..6)
BHSR selection
BHT index
2bc.2iK GAg.2iK GAs.2iK Gshare.2iK
0 0 0 0
i+10 0 i+6 0 i+9-
BHSR Total bits used Size of for BHT scheme index (# of (path BHT length) entries) 0 2iK i+10 2iK 4 2iK i+10 2iK
SAg.2iK
i+8
log 2 ((i + 9)2 )
i+9
§�iK
SAs.2iK
i+8
i+5
4
2iK
Branch prediction schemes are represented by “name.size” (as illustrated in [7]), where “name” falls into the taxonomy proposed by Yeh and Patt [24] and “size” is number of 2-bit counter entries in the Branch History Table (BHT). The two-level adaptive schemes use Branch
Figure 3. Branch prediction performance of user and kernel codes (JIT: with JIT compiler, intr: with interpreter)
5. Indirect Branches in Java Processing The abundant usage of virtual methods to support the extension and reuse of classes (object oriented programming style) and the switch-case statements used to implement bytecode interpretation potentially cause high indirect branch frequency in Java processing. Virtual method calls in Java incur a performance penalty because the target of these calls can only be determined at run time. A JIT compiler typically maintains a virtual method table for each loaded class. A virtual method invocation is then translated into an indirect function call after two loads [14]. The switch-case statements, on the other hand, are transformed to indirect jumps specified by jump tables created at compiled time [4]. Figure 4 shows the branch frequency (expressed as instructions per branch) comparison between SPECjvm98 and SPECInt95 benchmarks. Further, instructions per branch is shown separately for both conditional and indirect branches. It is observed that the number of instructions per conditional branch of Java and SPECInt95 are not very much different. However, Java programs have much less number of instructions per indirect branch (50 with JIT and 37 with interpreter) than SPECInt95 (with an average of 180). For example, ijpeg and compress in SPECInt95 have 468 and 246 instructions per indirect
branch respectively. Perl and li have many indirect branches because these programs essentially perform interpretation, which is similar to the functionality of a Java interpreter. J:with a Just-In-Time Compiler,I:with an interpreter 150 140
Inst. per Cond. Branch Inst. per Indir. Branch
130
Instructions per Branch
Statistically, SAs and SAg outperform other prediction schemes in user space and SAg and Gshare are the favorite predictors for kernel code. Surprisingly, we find that kernel has better branch prediction accuracy than user applications on SAg, SAs, Gshare and GAg predictors in spite of lacking loop-based codes. Previous study [22, 19] shows that OS kernel behaves differently from user applications because: (1) Operating systems are huge programs that manage hardware resource and exception processing; (2) The OS may perform explicit cache and TLB invalidation, and other operations not common in user-mode codes. Our study further identifies the optimized branch prediction schemes in kernel space. The different JVM implementation styles are found to have negligible impact on kernel branch prediction performance due to their similarity in kernel execution behavior [15]. Figure 3 also shows that in user space, both JIT and interpreting modes favor the same prediction schemes although interpreting mode yields lower misprediction rates for conditional branches because of its smaller branch sites and algorithm that inherently leads to a simpler control flow graph. The different branch behavior inherent in user and kernel codes and the similarity of prediction behavior between various JVM implement styles suggest that a split branch prediction scheme can be applied to user and kernel code separately to achieve accurate branch prediction on each part, both with JIT and interpreting modes.
246
468
120 110 100 90 80
J
70 J
50 40
J
J J
60 I
I
I
I
I
J
I
30 20 10 0
compr jess
db
javac mtrt
jackm88k gcc
ijpeg
li
perlcompr95
Figure 4. Instruction per Branch in Java and SPECInt95 Benchmarks
5.1. Characterization of Indirect Branch Behavior As the percentage of indirect branches in a Java runtime system is high, it becomes imperative to examine the indirect branch behavior. Current processors predict indirect branches with a branch target buffer (BTB) which caches the most recent target address of a branch. Tables 5 shows the profile of (non-return) indirect branches in user mode in a Java runtime system. Indirect branches are further categorized as branches with only one target (monomorphic branches) and those with more than one target (polymorphic branches). Further, we divide polymorphic branches based on the number of targets. Table 5 gives the number of indirect branch sites for each category, percentage of static branch sites for that category, and their dynamic instance counterparts. For example, in benchmark mtrt with a JIT compiler, there are a total of 24.3 million executed indirect branches (17.4 million with one target and 6.9 million with multiple targets). The total number of dynamic instances comes from 6,865 indirect branch sites, of which there are 6,603 (96%) branch sites with one target and 262 (4%) branch sites with multiple targets. Considered statically, monomorphic branches constitute a dominant portion. When the dynamic frequency of these branches is considered, however, the importance of polymorphic branches is felt: polymorphic branches which constitute 4% of static branches in JIT mode and 5% in interpreter mode lead to 28% of all dynamic branches in JIT mode and 75% in interpreting mode. Compared with JIT implementation, interpretation has fewer number of indirect branch sites. On the average, the 6 studied benchmarks have 6,597 static indirect branch sites in JIT mode, while only 3,960 branch sites are found in interpreting mode.
Table 5. Indirect Branch Profiling (User Mode) in Java Runtime System (Num.: Number, Per.: Percentage, jit: with JIT Compiler, intr: with Interpreter)
Benchmarks
comp
jit intr
jess
jit intr
db
jit intr
javac
jit intr
mtrt
jit intr
jack
jit intr
Num. Per. Num. Per. Num. Per. Num. Per. Num. Per. Num. Per. Num. Per. Num. Per. Num. Per. Num. Per. Num. Per. Num. Per.
Single Target 5,358 96.07% 3,650 95.65% 6,722 94.68% 3,864 95.29% 5,424 96.15% 3,785 95.32% 6,757 95.57% 3,915 95.09% 6,603 96.18% 3,768 95.46% 7,071 96.45% 3,679 95.56%
Static Branch Sites Multiple Target >=2 >=4 >=16 >=64 219 74 9 1 3.93% 1.33% 0.16% 0.02% 166 56 8 1 4.35% 1.47% 0.21% 0.03% 378 119 13 3 5.32% 1.68% 0.18% 0.04% 191 63 8 2 4.71% 1.55% 0.20% 0.05% 217 73 10 1 3.85% 1.29% 0.18% 0.02% 186 61 8 1 4.68% 1.54% 0.20% 0.03% 313 121 13 1 4.43% 1.71% 0.18% 0.01% 202 62 8 2 4.91% 1.51% 0.19% 0.05% 262 92 12 1 3.82% 1.34% 0.17% 0.01% 179 62 8 1 4.54% 1.57% 0.20% 0.03% 260 88 15 3 3.55% 1.20% 0.20% 0.04% 171 59 8 1 4.44% 1.53% 0.21% 0.03%
Single Target 18,705,704 51.23% 1,131,814 2.77% 5,205,790 75.08% 4,924,628 46.51% 1,852,952 82.27% 1,715,960 67.01% 3,922,966 77.40% 3,455,111 69.86% 17,413,166 71.66% 13,476,212 24.79% 23,184,753 75.35% 14,806,299 48.42%
5.2. Target Transfer Patterns and Locality For monomorphic indirect branches, misprediction comes from aliasing between branches that map to the same BTB entry. For polymorphic indirect branches, misprediction also depends on multiple target transfer patterns. Multiple targets do not necessarily imply loss of prediction accuracy. For example, if one target address is accessed 1,000 times followed by the other executing 1,000 times, the loss due to interleaving is negligible. However, if the two targets alternate in trace order, then interleaving may cause significant misprediction in a simple, last seen target bookkeeping mechanism. To characterize multiple target transfer patterns, we uniquely number both branch sites and their corresponding targets for each polymorphic branch and show the results for 0.5 million dynamic branch instances in trace. We exclude return indirect branches which always use jump and link instructions (e.g. jal and jalr) and a specified architecture register (e.g. r31 on MIPS machines) because these call/return jumps can be efficiently predicted by a return address stack [13] in superscalar machines. As shown in Figure 5 and Figure 6, data are visualized in 3-D formats for both user and kernel executions. Both
Dynamic Instances Multiple Target >=2 >=4 >=16 17,804,658 13,242,308 73,021 48.77% 36.27% 0.20% 39,662,270 39,594,738 38,815,571 97.23% 97.06% 95.15% 1,728,210 1,173,233 283,601 24.92% 16.92% 4.09% 5,663,323 5,323,622 4,435,293 53.49% 50.28% 41.89% 399,448 264,882 84,015 17.73% 11.76% 3.73% 844,660 683,429 477,044 32.99% 26.69% 18.63% 1,145,661 677,169 288,405 22.60% 13.36% 5.69% 1,490,420 1,030,649 657,261 30.14% 20.84% 13.29% 6,885,721 5,267,999 925,788 28.34% 21.68% 3.81% 40,878,066 39,972,136 35,161,782 75.21% 73.54% 64.69% 7,584,478 5,603,077 1,283,077 24.65% 18.21% 4.17% 15,770,268 15,046,729 11,206,312 51.58% 49.21% 36.65%
>=64 58,417 0.16% 38,803,333 95.12% 177,510 2.56% 4,232,004 39.97% 58,112 2.58% 431,208 16.84% 223,020 4.40% 571,703 11.56% 92,336 0.38% 34,906,317 64.22% 261,538 0.85% 9,958,788 32.57%
JIT and interpreting modes are studied. Each dot plotted in 3-D space records an occurrence of the following event: at time X (represented by number of dynamic instances until then), a given branch Y (represented by branch ID) jumps to its target Z (represented by branch target ID). As shown in Figure 5, the studied benchmarks demonstrate target transfer patterns ranging from those in which the indirect branch execution is dominated by a small group of branches with highly biased targets such as compress and mtrt in interpreting mode, to those in which a wide range of branches with random target transfer patterns constitute most of the indirect branch execution as in db in JIT mode. For the same benchmark, the two JVM implementations affect the target transfer patterns drastically. In interpreting mode, branch sites are small and target transfer patterns are highly interleaved, whereas JIT mode usually has more active branch sites with random and sparse transfer patterns. Benchmarks compress, mtrt, and jack show interesting patterns in interpreting mode: the enlarged cut-out sections of these benchmarks (see Figure 6) show that the jumped target addresses of an indirect branch are interleaved regularly.
compress (JIT,User)
mtrt (JIT,User)
Z
javac (JIT,User)
Z
Y
Z
Y
X compress (Intr,User)
mtrt (Intr,User)
Z
Z
Y
X jack (JIT,User)
Z
Y
X
jess (Intr,User)
X
X db (Intr,User)
Z
Y
Y
X
jack (Intr,User)
Z
X db(JIT,User)
Z
Y
Y
X jess (JIT,User)
Z
X javac (Intr,User)
Z
Y
Y
X
Z
Y
X
Y
X
Figure 5. Visualization of branch targets transfer patterns for no-return polymorphic indirect branch invoked in Java runtime system (User mode, JIT: JIT compilation, Intr: interpretation, X: total number of indirect branch invoked, Y: static indirect branch ID, Z: static indirect branch target ID, cut-out sections are enlarged and shown in Figure 6)
We observe that the indirect branch execution exhibits a new kind of locality, the branch target address locality in interpreting mode, according to which a few target addresses appear very frequently in polymorphic indirect
branch instances. As depicted in Figure 6, in the interpreting mode, a polymorphic indirect branch can potentially jump to large set of targets, partially because of the large switch-case statements for interpretation (with
a misprediction rate of 96%) in a BTB where only the most recently transferred target is recorded.
more than 200 cases). But within a limited execution period, the actually invoked target set is usually constituted by a small size of heavily reused addresses and this observation holds true for the entire execution of the programs.
Current processors predict branch targets with a branch target buffer (BTB) which caches the most recently resolved target. An indirect branch can always be predicted “taken” by setting a corresponding “branch type” bit once it enters the BTB. However, its prediction performance is largely dependent on the efficiency of BTB, because the BTB is referred for obtaining the target address at the fetch cycle of a pipeline. Will the conventional BTB structure work well with the indirect branch rich Java runtime system? To answer this question, we perform a BTB miss rate study (4-way set associative, with table size varied from 256-entries to 8Kentries). The BTB performance is examined by executing each benchmark with both JIT compiler and interpreter. The results are plotted in Figure 7. We omit the kernel BTB miss behavior with interpreter because it is similar to that in JIT mode. The BTB miss rate shown in Figure 7 is further separated into tag miss caused by BTB entry absence and target miss caused by incorrect targets in the BTB entry. As shown in Figure 7, user code shows higher BTB miss than kernel code because it is more indirect branch intensive. The BTB performance is largely dependent on the JVM style as interpretation significantly increases BTB miss rate on most studied benchmarks. For example, the BTB miss rate in benchmark compress increases from 8% in JIT mode to 96% in interpreting mode. Tag miss rate becomes negligible as the BTB size increases, however, increasing BTB size does not reduce BTB target miss rate significantly. The high frequency of BTB misses in user code in the interpreting mode is due to the difficulty in predicting the targets of the indirect branch which implement the case by case interpretation.
jack (Intr,User) 160
140
140
120
120 Branch Target ID
160
100 80 60 40
100 80 60 40
20
20 25
50 75 100 125 150 175 200 Dynamic Branch Instances
25
50 75 100 125 150 175 200 Dynamic Branch Instances
mtrt (Intr,User) 180 160
Branch Target ID
140 120 100 80 60 40 20 25
50 75 100 125 150 175 200 Dynamic Branch Instances
Figure 6. Enlarged cut-out sections in Figure 5
The target locality, a characteristic similar to the temporal locality found in instruction and data references, implies that target addresses to which control flow has been transferred recently have high possibility of reuse in the very near future. The set of frequent targets remains quite small and stable over of the execution of some programs like compress, where branch instances repeatedly work through a body of 9 distinct address sites. Not surprisingly, this highly interleaved branch target transfer pattern almost always causes mispredictions (with Indirect Branch (User, with Interpreter)
BTB Miss Rate (%)
80
Tag-Miss
Target-Miss
Target-Miss
1024 512
60
256
2048 4096 8192
40 20 0
30
jess
javac
jack
mtrt compress
1024
20
2048 4096 8192
256
10
db
jess
Indirect Branch (Kernel, with JIT Compiler)
40
Tag-Miss
512
0
db
Indirect Branch (User, with JIT Compiler)
40
Tag-Miss
BTB Miss Rate (%)
100
javac
jack
BTB Miss Rate (%)
compress (Intr,User)
Branch Target ID
5.3. BTB Performance
Target-Miss
30
1024 2048 4096
512 256
20
8192
10
mtrt compress
0
db
jess
javac
jack
mtrt compress
Figure 7. BTB Performance on Java Processing
Our analysis shows that polymorphic branches lead to a high misprediction rate in conventional BTBs, as a simple, most recently used target bookkeeping and a static hashing mechanism employed in a BTB design is insufficient to
capture an interleaved but highly clustered target sequence. The use of two-level indirect branch predictors proposed by Driesen and Hölzle [6] may capture the more complex target access patterns and hence improve the prediction
accuracy. Unfortunately, the 2-level predictors potentially require larger BTB entries for accurate prediction. The clustered target sequence (with high locality as shown in Figure 6) yielded by few polymorphic indirect branches suggests that a mechanism that can capture multiple targets for a few branches may be effective for Java.
6. Conclusions and Future Research The popularity and wide adoption of Java has necessitated the development of efficient hardware and software for Java runtime systems. An in-depth look and understanding of the control flow transfer characteristics in Java processing can guide architects to design efficient speculation mechanisms for Java execution. This paper is a first step in characterizing control flow transfer and evaluating the impact of widely used branch prediction schemes on different JVM techniques. The major observations and contributions of this research are: • Kernel branches constitute a significant portion of total branch execution in Java processing. In JIT mode, kernel branches, which constitute 14% of static branch sites account for 29% of dynamic branch instances. Kernel and user code favor different prediction schemes: SAs and SAg outperforms other prediction schemes in user space and SAg and Gshare are favorite predictors for kernel code. •Compared with the 4.4K static branch sites found in SPECInt95 executions, Java processing involves a fairly larger number of static conditional branches with an average of 37K in JIT mode and 29K in interpreting mode, indicating its inherently larger control flow footprint. A small number of distinct branches contribute to the overwhelming majority of the branch instances, showing high locality. •The use of virtual method calls to support the extension and reuse of classes leads Java code to have much less number of instructions per indirect branch (50 with a JIT compiler) than that of SPECInt95 (an average of 180). The additional indirect jumps used to implement the switch-case statements for bytecode interpretation further reduce this number to 37 in the case of interpreting mode, implying the importance of accurate indirect branch prediction on ILP performance of Java. •A significant portion of indirect branches are polymorphic branches. Polymorphic branches constitute 28% of dynamic indirect branches in JIT mode and 75% of those in interpreting mode. Various JVM implementations affect branch target transfer patterns drastically. In interpreting mode, the number of active branch sites are small and target address transfers are highly interleaved, whereas JIT mode usually has more active branch sites with random and sparse target transfer patterns. •It is found that Java processing exhibits a new kind of locality in interpreting mode - branch target address
locality, according to which a few target addresses appear very frequently in polymorphic indirect branch instances. These results can provide insight towards designing architectural support for enhancing the ILP performance of Java processing. For example, a dedicated yet optimized branch prediction scheme can be applied to user and kernel code separately to achieve more accurate branch prediction because of the different branch behavior inherent in user and kernel code. A profile-based compiler “preoptimization” of the heavily executed JVM components can improve ILP performance of Java processing across different applications. The clustered target sequence (with high locality) generated by polymorphic indirect branches suggests that a BTB mechanism that captures multiple target information will be effective. We plan to apply these observations to design microarchitectural enhancements to improve ILP performance in Java processing.
Acknowledgements This research is supported in part by a State of Texas Advanced Technology program grant #403, the National Science Foundation under grants CCR-9796098 and EIA9807112, and by Dell, Intel, Microsoft, Tivoli, and IBM. We also thank Vijay Narayanan for his comments on this paper.
References [1] Delivering Real World Benefits with Client Side Java Technology, An Executive White Paper, Aberdeen Group, Inc., June 2000. [2] J. Bennett and M. Flynn, Performance Factors for Superscalar Processors, Technical Report CSL-TR-95-661, Computer Systems Laboratory, Stanford University, Feb. 1995. [3] B. Calder, D. Grunwald and A. Srivastava, The Predictability of Branches in Libraries, In Proceedings of the 28th Annual International Symposium on Microarchitecture, pages 24-34, 1995. [4] P.-Y. Chang, E. Hao. and Y. N. Patt, Target Prediction for Indirect Jumps, In Proceedings of the 24th International Symposium on Computer Architecture, pages 274-283, 1997. [5] T. Cramer, R. Friedman, T. Miller, D. Seberger, R. Wilson and M. Wolczko, Compiling Java just in time, IEEE Micro, vol. 17, pages 36-43, May 1997. [6] K. Driesen and U. Hölzle, Accurate Indirect Branch Prediction, In Proceedings of the 25th Annual International Symposium on Computer Architecture, pages 167-178, 1998. [7] N. Gloy, C. Young, J. B. Chen and M. D. Smith, An Analysis of Dynamic Branch Prediction Schemes on System Workloads, In Proceedings of the 23rd Annual International Symposium on Computer Architecture, pages 12-21, 1996. [8] T. H. Heil, Z. Smith and J. E. Smith, Improving Branch Predictors by Correlating on Data Values, In Proceedings of the 32nd Annual ACM/IEEE International Symposium on Microarchitecture, pages 28-37, 1999.
[9] S. Herrod, M. Rosenblum, E. Bugnion, S. Devine, R. Bosch, J. Chapin, K. Govil, D. Teodosiu, E. Witchel, and B. Verghese, The SimOS User Guide, http://simos.stanford.edu. [10] Sun Microsystems, Java2 Platform, Standard Edition Documentation, http://java.sun.com /docs/index.html. [11] C. -H. A. Hsieh, J. C. Gyllenhaal, and W.- M. W. Hwu, Java Bytecode to Native Code Translation: The Caffeine Prototype and Preliminary Results, In Proceedings of the 29th International Symposium on Microarchitecture, pages 90-99, 1996. [12] C.-H. A. Hsieh, M. T. Conte, T. L. Johnson, J. C. Gyllenhaal and W. W. Hwu, A Study of the Cache and Branch Performance Issues with Running Java on Current Hardware Platforms, In Proceedings of COMPCON, pages 211-216, 1997. [13] D. R. Kaeli, and P. G. Emma, Branch History Table Prediction of Moving Target Branches due to Subroutine Returns, In Proceedings of the 18th Annual International Symposium on Computer Architecture, pages 34-42, 1991. [14] J. Lee, B.-S. Yang, S. Kim, S. Lee, Y. C. Chung, H. Lee, J. H. Lee, S.-M. Moonm, K. Ebcioglu, and Erik Altman Reducing Virtual Call Overheads in a Java VM Just-In-Time Compiler, In Proceedings of the 4th Annual Workshop on Interaction between Compilers and Computer Architectures, 2000. [15] T. Li, L. K. John, N.Vijaykrishnan, A. Sivasubramaniam, J. Sabarinathan and A.Murthy, Using Complete System Simulation to Characterize SPECjvm98 Benchmarks, In Proceedings of ACM International Conference on Supercomputing, pages 22-33, 2000. [16] T. Lindholm and F. Yellin, The Java Virtual Machine Specification, Second Edition, Addison Wesley, 1999. [17] Overview of Java platform product family, http://www.javasoft.com/products/OV_ jdkProduct.html. [18] R. Radhakrishnan, N. Vijaykrishnan, L. K. John and A. Sivasubramaniam, Architectural Issue in Java Runtime Systems, In Proceedings of the 6th International Conference on High Performance Computer Architecture, pages 387-398, 2000. [19] J. Redstone, H. Levy and S. Eggers, An Analysis of Operating System Behavior on a Simultaneous Multithreaded Architecture, In Proceedings of 9th International Conference on Architectural Support for Programming Languages and Operating Systems, pages 245-256, 2000. [20] SPEC jvm98 Benchmarks, http://www.spec.org/osg/jvm98/. [21] N. Vijaykrishnan and N. Ranganathan, Tuning Branch Predictors to Support Virtual Method Invocation in Java, In Proceedings of the 5th USENIX Conference of Object-Oriented Technologies and Systems, pages. 217-228, 1999. [22] C. Xia and J. Torrellas, Comprehensive Hardware and Software Support for Operating Systems to Exploit MP Memory Hierarchies, IEEE Transactions on Computers, May 1999. [23] T. Yeh and Y. N. Patt, Two-Level Adaptive Branch Prediction, In Proceeding of 24th International Symposium on Microarchitecture, pages. 51-61, 1991. [24] T.-Y. Yeh and Y. N. Patt, A Comparison of Dynamic Branch Predictors that Use Two Levels of Branch History, In Proceedings of the 20th Annual International Symposium on Computer Architecture, pages 257-266, 1993.