Understanding Copepod Life History Patterns Through Inter-Regional Comparison of AZMP Zooplankton Data ‡ Catherine L. Johnson1, Andrew W. Leising 2, Jeffrey A. Runge 3, Erica J. H. Head1, Pierre Pepin 4, Stéphane Plourde 5, and Edward G. Durbin 6 1 Bedford Institute of Oceanography, Box 1006, Dartmouth, NS, B2Y 4A2 National Oceanographic and Atmospheric Administration, Southwest Fisheries Science Center, 1352 Lighthouse Avenue, Pacific Grove, CA, 93950-2097, USA 3 School of Marine Sciences, University of Maine, and Gulf of Maine Research Institute, 350 Commercial Street, Portland, ME, 04101, USA 4 Northwest Atlantic Fisheries Centre, Box 5667, St. John’s, NL, A1C 5X1 5 Institut Maurice-Lamontagne, CP 1000, Mont-Joli, QC, G5H 3Z4 6 Graduate School of Oceanography, University of Rhode Island, Narragansett, RI, 02882, USA
[email protected]
2
Sommaire Des séries temporelles de données démographiques provenant de quatre stations fixes dans l’Atlantique Nord-Ouest révèlent la variabilité dans le moment d’entrée et de sortie de la dormance, ou de la suspension du développement, chez des sous-populations du copépode Calanus finmarchicus. Afin de tester des hypothèses sur les signaux environnementaux contrôlant la dormance, des indicateurs basés sur les changements dans les proportions des stades de développement ont été développés. Aucun signal environnemental seul (la photopériode, la température en surface, ou la concentration de chlorophylle a moyenne en surface) n’a expliqué en totalité les dates d’entrée et de sortie pour toutes les stations. Parmi les hypothèses mises de l’avant pour expliquer la dormance chez les espèces de Calanus, nous ne pouvons éliminer l’hypothèse de la fenêtre d’accumulation de lipide pour l’initiation de la dormance ou de «l’horloge interne» modulée par les lipides contrôlant la durée de la dormance. La prémisse de base est que les individus peuvent entrer en dormance seulement si leur historique d’alimentation et de température leur permet d’accumuler suffisamment de lipides pour survivre la période hivernale, muer et initier les premiers stades de maturation et de développement des gonades. Une compréhension mécaniste de la dormance est cruciale afin de modéliser et de prédire l’effet du changement climatique sur les espèces dominantes de copépodes, ainsi que sur leurs prédateurs et leurs proies.
Introduction 1 In temperate and high-latitude ecosystems, several dominant oceanic copepods, including Calanus species, spend part of the year in a state of suspended development, or dormancy. Dormancy allows them to reduce their mortality during periods unfavourable for growth and reproduction (reviewed by Dahms 1995). Dormant copepods cease feeding and exhibit reduced metabolic rates. They also reside in deep water and are inactive, reducing mortality by both visual and non-visual predators. Emergence from dormancy and migration to the surface in winter or spring allows copepods to focus their reproductive efforts on the season when the spring diatom bloom supports high egg production rates (Dahms 1995). Calanus finmarchicus dominates the zooplankton biomass in the North Atlantic and has a key role in the marine ecosystem as a grazer of phytoplankton and as prey for planktivorous fish, fish larvae, seabirds, and right whales. They are dormant mainly as fifth copepodid stages (CVs), the last juvenile stage of development, and dormancy begins in summer or autumn and ends in winter or early spring (reviewed by Hirche 1996). The timing of dormancy influences C. finmarchicus population dynamics and abundance through interactions with seasonal changes in food availability and temperature, and it also influences their availability as food for their predators. Despite extensive research on C. finmarchicus, the factors that control entry into and exit from dormancy remain unknown, in part because it cannot be induced under experimental conditions. Nevertheless, these control factors are critical to the population dynamics of this species (Carlotti and Radach 1996, Speirs ‡ This article is adapted from Johnson, CL, AW Leising, JA Runge, EJH Head, P Pepin, S Plourde, and EG Durbin (2008) Characteristics of Calanus finmarchicus dormancy patterns in the northwest Atlantic. ICES J. Mar. Sci. 65. Advance access: doi:10.1093/icesjms/fsm171
et al. 2006). Understanding dormancy transitions is a major challenge for modelling copepod population dynamics, particularly when evaluating the role of climate forcing in driving interannual and longer term population variability. Seasonal cues like photoperiod and temperature, either alone or in combination, trigger the onset of dormancy in many insect species and in near-shore copepods that become dormant as “resting” eggs (Danks 1987, Dahms 1995), but photoperiod alone is not the trigger for C. finmarchicus (Hind et al. 2000). Warming or stratification, accompanied by declining primary production, may be a better predictor of impending unfavourable conditions. Alternatively, C. finmarchicus may be responding to an entirely direct cue, e.g., a decrease in food supply (Hind et al. 2000). However, C. finmarchicus need to achieve the CV stage and to accumulate a large quantity of wax ester, a storage lipid, before entering dormancy, so a direct cue may not result in optimal dormancy timing (Hirche 1996, Miller et al. 1998). Rey-Rassat et al. (2002) proposed that there is a threshold amount of wax ester needed to achieve moulting, gonad maturation, and the energetic requirements of dormancy. Accumulation of this threshold amount would trigger physiological responses, likely hormonally mediated (Irigoien 2004), to descend to deep water and enter dormancy. Individuals not attaining this threshold would remain at the surface, moult to adulthood, and reproduce, although their offspring may face less favourable conditions than those experienced by individuals that entered dormancy. For emergence from dormancy, photoperiod has been hypothesized as a control, but it probably does not provide a general cue since light does not penetrate to the depths occupied by many dormant C. finmarchicus populations (Miller et al. 1991). Energy consumption, particularly metabolism of 21
storage lipids, during dormancy could also influence emergence timing (Miller et al. 1991, Hirche 1996, Irigoien 2004, Saumweber and Durbin 2006) if C. finmarchicus must become active when they have depleted their lipid reserves to a certain level. Lipid must not be depleted below levels required for egg production or adult metabolism following emergence, especially in species that emerge before the spring bloom (Rey-Rassat et al. 2002, Irigoien 2004). A final suggestion is that the length of dormancy might be controlled by an endogenous developmental trigger, so that CVs emerge when they have developed to a given point in their prolonged moult cycle (Hind et al. 2000). Here we investigate the control of dormancy timing and duration in populations of C. finmarchicus by comparing demographic data with environmental data from four coastal Atlantic Zone Monitoring Program time-series (AZMP) stations, which span approximately 5 degrees of latitude.
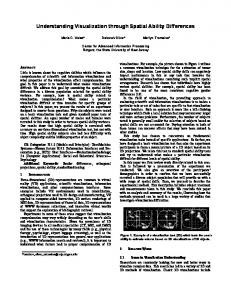
Methods Data from the AZMP fixed stations on the Newfoundland Shelf (station S27, 175 m deep), the Anticosti Gyre (300 m), the Lower St. Lawrence Estuary (station LSLE, 300 m), and the Scotian Shelf (station H2, 140 m) were used (Fig. 1). Stations have been sampled approximately every two weeks since 1999, except in the Lower St. Lawrence Estuary where sampling began in 1994, with less-frequent sampling in winter 54
I
00
10
SB
51
Latitude
0
50
48
LSLE
AG 20
0
GSL S27
45
200 100
Grand Bank / Grand Banc
lf / is She ossa tian -Éc Scou Néo a late
H2
0
GOM
10
42
P 0
10
GB
39
-70
-65
-60 Longitude
-55
-50
Fig. 1 Northwest Atlantic study region, including schematic surface currents and selected isobaths (in metres). Atlantic Zone Monitoring Program (AZMP) fixed stations: Anticosti Gyre (AG), Lower St. Lawrence Estuary (LSLE), Newfoundland Shelf (S27), and Scotian Shelf (H2). Other important locations include Georges Bank (GB), Gulf of Maine (GOM), Gulf of St. Lawrence (GSL), and the Strait of Belle Isle (SBI).
22
Région de l’étude dans l’Atlantique Nord-Ouest avec une illustration des courants de surface et quelques niveaux bathymétriques (en mètres). Les stations fixes du Programme de Monitorage de la Zone Atlantique (PMZA) : gyre Anticosti (AG), estuaire moyen du Saint-Laurent (LSLE), plateau de Terre-Neuve (S27), plateau Néo-Écossais (H2). Les autres lieux d’intérêt inclus sont le banc Georges (GB), le golfe du Maine (GOM), le golfe du Saint-Laurent (GSL) et le détroit de Belle Isle (SBI).
during periods of ice cover or bad weather. Zooplankton samples were collected using 0.75 m diameter ring nets equipped with 200 μm mesh. Nets were towed vertically from about 10 m above the bottom to the surface. Between 1994 and 2003 at the Lower St. Lawrence Estuary station, zooplankton was sampled on a weekly basis with a 1 m diameter 333 µm mesh net (for stages CIV–CVI) and a 1 m diameter 73 µm net (for CI–CIII and naupliar stages). Data collected up to and including 2005 were included in this analysis, except for the 2004 data at the Anticosti Gyre station. Temperature and salinity data were collected using CTD profiles, and chlorophyll a was measured from Niskin-bottle samples and averaged over the upper 50 m at all fixed stations (http://www.meds-sdmm.dfo-mpo.gc.ca/zmp/main_zmp_e. html). The 5 m value was used as an index of surface mixed layer temperature. Deep-water temperature indices were calculated by averaging temperatures over the estimated depth range of dormant copepods at each of the four stations (Newfoundland Shelf: 100–160 m; Anticosti Gyre: 150–250 m; Lower St. Lawrence Estuary: 150–240 m; Scotian Shelf: 100–140 m). Day lengths at each station were calculated as the time between sunrise and sunset, as a function of latitude and day of year (Jarmo Lammi photoperiod calculator; http://personal.inet.fi/cool/jjlammi/stuff.html). Proxies were developed to estimate dormancy entry and exit dates. The beginning of the dormancy onset period was defined as the date when the proportion of CVs in the population (i.e., CV/[CI-CVI]) rose to half its overall maximum, calculated as each year’s maximum CV proportion averaged over all years. The start of the emergence period was defined as the first date when adults made up more than 10% of the population of stages from copepodid stage 1 to adult. Emergence dates were also estimated by back-calculating the spawning dates of the first early copepodid stages to appear in spring. The development time from egg to CIII was estimated by running an individual-based model, starting eggs at each date of the year, and identifying the appropriate development time for CIIIs at the first appearance date. Spawning dates were calculated by subtracting the appropriate development time and 7 additional days—the time required for egg production to begin after moulting (Runge 1984, Plourde and Runge 1993). One-way analysis of variance (ANOVA) was used to test whether environmental factors at onset and emergence were different among stations. A pairwise t-test with Bonferroni adjustment was used to test for differences in environmental factors among particular stations.
Results The timing of onset of dormancy differed by up to three months among the four stations (F = 22.32, p < 0.001; Fig. 2). Onset of dormancy started earliest on the Scotian Shelf (mean date, 10 June) and latest on the Newfoundland Shelf (mean date, 24 September). There was also considerable interannual variability within regions (Figures 3–5). The appearance of adults and small peaks in early copepodid stages after the proxy onset date indicate that CVs enter dormancy over a broad range of times.
Stage / Stade
NS 1
C1 C2 C3 C4 C5 C6 M C6 F
0.5 0
Proportion
AG 1
C1 C2 C3 C4 C5 C6 M C6 F
0.5 0
LSLE 1
N3-6 C1-3 C4 C5 C6 M C6 F
0.5 0
SS 1
C1 C2 C3 C4 C5 C6 M C6 F
0.5
0 Jan99
Jan00
Jan01
Jan02
Jan03
Jan04
Jan05
Fig. 2 Time-series demography of C. finmarchicus at the AZMP fixed stations. Proportion of naupliar (Lower St. Lawrence Estuary station only) and copepodid stages for each year for which data are available. Red line: estimated time of onset into dormancy; solid green line: estimated time of exit from dormancy based on the proportion of females present; dashed green line: estimated time of exit based on back-calculation from presence of early copepodid stages (saturating food conditions). See text for details of the method used for determining timing of onset and exit. NS: Newfoundland Shelf; AG: Anticosti Gyre; LSLE: Lower St. Lawrence Estuary; SS: Scotian Shelf.
Séries temporelles démographiques de C. finmarchicus aux stations fixes du PMZA. Proportion des stades de nauplii (station de l’estuaire moyen du Saint-Laurent seulement) et de copépodites pour chaque année où les données sont disponibles. Ligne rouge : estimation du moment d’entrée en dormance; ligne verte pleine : estimation du moment de sortie basée sur la proportion de femelles; ligne verte brisée : estimation du moment de sortie basée sur le rétrocalcul à partir de la présence des premiers stades copépodites (conditions de nourriture non limitante). Se référer au texte pour les détails de la méthode de détermination du moment d’entrée ou de sortie. NS : plateau de Terre-Neuve; AG : gyre Anticosti; LSLE : estuaire moyen du Saint-Laurent; SS : plateau Néo-Écossais.
Emergence from dormancy began earliest on the Scotian Shelf (mean date, 10 January), Newfoundland Shelf (mean date, 19 February), and in the Anticosti Gyre (mean date, 23 February), and was latest in the Lower St. Lawrence Estuary (mean date, 8 May) (F = 54.68, p < 0.001), where emergence dates were nearly always on the first sampling date of the season. The proportion of adults in the population ramped up steadily after exceeding 10%, often to >50%. During this period, the total abundance of copepodid and adult stages was low: CVs are leaving dormancy, egg production has begun, and naupliar stages are appearing. Dormancy emergence dates estimated by back-calculation from the appearance of early copepodid stages corresponded well in most years with estimates from the stage-proportion-based proxy, except on the Newfoundland Shelf. There, the back-calculated emergence dates were considerably earlier, perhaps because early copepodid production persists sporadically through autumn and winter. The four stations span approximately 5 degrees of latitude, with maximum and minimum day lengths differing at most
by about 45 min. The day lengths at which CVs started to enter dormancy were different among the four sites (F = 18.38, p < 0.001; Fig. 3). Calanus finmarchicus began to enter dormancy close to the summer solstice on the Scotian Shelf and during a period of declining day length elsewhere. Emergence from dormancy was generally during periods of increasing day length but sometimes began before the winter solstice. The mean day length at emergence was longer at the Lower St. Lawrence Estuary station than at the three other stations (F = 119.2, p < 0.001; Fig. 3). Surface temperatures were very variable among stations, with minimum temperatures in February or March coinciding with strong vertical mixing and integrated heat loss through fall and winter, and maximum temperatures in late summer coinciding with strong stratification and shallow mixed layers (Loder et al. 1998). The amplitudes of the seasonal 5 m temperature cycles at the four sites were very different (Fig. 4). Minimum temperatures at 5 m in winter were lower at the more northerly stations, reaching about –1ºC in the 23
0
16 14 12 10 8
AG
16 14 12 10 8
LSLE
20
AG
10 0 20
LSLE
10 0 20
SS
10
SS
0 J
F
M
A
M
J
J
A
S
O
N
D
Month / Mois
J
F
M
A
M
J
J
A
S
O
N
D
Month / Mois
Fig. 3 Interannual variability in timing of dormancy onset and emergence superimposed on photoperiod cycles at each of the fixed stations. Large green circles: emergence date; small green circles: sampling dates before and after emergence; large red squares: onset date; small red squares: sampling dates before and after onset; solid line represents photoperiod. Abbreviations are as in Figure 2 Variabilité interannuelle du moment d’entrée et de sortie de la dormance superposée au cycle de la photopériode à chacune des stations fixes. Grands cercles verts : date de sortie; petits cercles verts : dates d’échantillonnage avant et après la sortie; grands carrés rouges : date d’entrée; petits carrés rouges : dates d’échantillonnage avant et après l’entrée. La ligne pleine représente la photopériode. Les abréviations sont les mêmes qu'à la figure 2.
St. Lawrence Estuary and on the Newfoundland Shelf. The Gulf of St. Lawrence is mostly covered with sea-ice from January to late March (Koutitonsky and Bugden 1991), while the Newfoundland Shelf is only ice-covered in some years. Minimum temperatures at 5 m generally dip to around 0.4°C on the Scotian Shelf. The highest maximum temperatures were observed on the Scotian Shelf in September and the lowest were in the lower St. Lawrence Estuary in August. The onset of dormancy began during different phases of the seasonal temperature cycle at the four stations. Onset started while the temperature was increasing on the Scotian Shelf, at around its peak in the Lower St. Lawrence Estuary, and after its peak on the Newfoundland Shelf and in the Anticosti Gyre. The temperature at onset was not significantly different on the Scotian Shelf, Newfoundland Shelf, and in the Anticosti Gyre, but was significantly lower in the Lower St. Lawrence Estuary (F = 8.059, p < 0.001; Fig. 4). Chlorophyll cycles on both the Newfoundland Shelf and the Scotian Shelf were dominated by a spring peak in late March or April, with a smaller peak in late summer or autumn (Fig. 5). The onset of dormancy began about a month after the spring bloom on the Scotian Shelf and not until after the small autumn bloom on the Newfoundland Shelf. Spring chlorophyll peaks were later in the Lower St. Lawrence Estuary and the Anticosti Gyre (May–June), 24
NS
10
16 14 12 10 8
20
NS
Temperature / Température (°C)
Day Length / Longueur de la journée (h)
16 14 12 10 8
Fig. 4 Interannual variability in timing of dormancy onset and emergence superimposed on average 5 m temperature cycles at each of the fixed stations. Symbols and abbreviations are as in Figure 2. The solid line represents a 20-day running mean of temperature.
Variabilité interannuelle du moment d’entrée et de sortie de la dormance superposée au cycle moyen de la température (5 m) à chacune des stations fixes. Les symboles et les abréviations sont les mêmes qu’à la figure 2. La ligne pleine représente une moyenne mobile de 20 jours de la température.
but chlorophyll concentrations remained relatively high during summer and early autumn. At the latter stations, the onset of dormancy began during periods when climatological chlorophyll concentrations remained relatively high but were lower than the annual maxima. Chlorophyll concentrations experienced by copepods at the onset of dormancy were not significantly different among stations (F = 2.427, p = 0.12; Fig. 5), and the overall mean chlorophyll concentration at onset was lower than the threshold for maximum growth and development rates (Runge et al. 2006, R. G. Campbell, University of Rhode Island, pers. comm.). Emergence always began either before the spring chlorophyll peak or when chlorophyll concentrations were increasing before the peak (Fig. 5). The duration of dormancy varied among regions (Fig. 6A). The longest duration, 8–9 months, was in the Lower St. Lawrence Estuary. Dormancy duration varied between 4 and 7 months in the Anticosti Gyre and on the Scotian Shelf. It was shortest, 3–6 months, at the Newfoundland Shelf station. There was no inverse relationship between deepwater temperature and dormancy duration (Fig. 6A), as would be expected if the initial lipid content was the same across regions and if there was a temperature-dependent endogenous timer. There was, however, a significant inverse relationship between the duration of dormancy and the surface layer temperature on the date of onset of dormancy, as would be expected if the quantity of stored lipid was temperature-dependent (Fig. 6B). Since Calanus finmarchicus grow larger at lower temperatures, their total lipid content is also likely to be larger at low temperatures, given adequate food concentrations (Miller et al. 2000, Saumweber and Durbin 2006).
NS AG LSLE SS
300
1 0.1
20 10
AG
1 0.1
20 10
LSLE
1 0.1
20 10
SS
1 0.1
J
F
M
A
M
J
J
A
S
O
N
D
Month / Mois
Fig. 5 Interannual variability in timing of dormancy onset and emergence superimposed on average cycles of the mean (0–50 m) chlorophyll a concentration at each of the fixed stations. Symbols and abbreviations are as in Figure 2. The solid line represents a 20-day running mean of chlorophyll a concentration. Dotted lines at 0.5 mg chl a m–3 represent approximate half-maxima for growth and egg production rates.
A
NS
Dormancy Duration (days) / Durée de la dormance (jours)
Mean Chlorophyll, 0-50 m / Chlorophylle, moyenne 0 - 50 m (mg chl a m-3)
350 20 10
Variabilité interannuelle du moment d’entrée et de sortie de la dormance superposée au cycle moyen de la concentration de chlorophylle a (0-50 m) à chacune des stations fixes. Les symboles et les abréviations sont les mêmes qu’à la figure 2. La ligne pleine représente une moyenne mobile de 20 jours de la concentration de chlorophylle a. La ligne pointillée à 0,5 mg chl a m-3 représente approximativement la moitié du maximum nécessaire pour la croissance et la production d’œufs.
Discussion The data collected at the AZMP fixed stations provide valuable time series of plankton and environmental conditions, but there are limitations to interpreting dormancy patterns from the observations. At all stations, advection could be a source of error if “new” individuals entering the sampling area have different environmental histories. The assumption here is that each station is representative of a broad regional area (Ouellet et al. 2003). Cross-shelf advection could bias results for the Newfoundland Shelf; however, springtime AZMP surveys in this region show little evidence of substantial differences in the relative stage composition of C. finmarchicus among the coastal areas, the continental slope, and the Labrador Sea (P. Pepin, unpublished data). The C. finmarchicus demographics at the Lower St. Lawrence Estuary station are likely a complex interaction of the dynamics of two subpopulations, one responding to the primary production cycle in the estuary and one responding to that in the northwest Gulf. Among the potential environmental triggers, chlorophyll a concentration at the onset of dormancy was the only one that was relatively constant across all four stations. Variability in chlorophyll a concentration during summer was low at all stations, however, so chlorophyll a concentration alone did not offer a strong signal for induction of dormancy. Day length, sea-surface temperature, and photoperiod at onset of dormancy differed among stations, and there was also considerable interannual variability in the timing of onset and
250 200 150 100 50 -2
400
0
2 4 6 Deep-Water Temperature / Température des eaux profondes (°C)
B
8
NS AG LSLE SS
300
200
y = 327 - 13x r 2 = 0.41
100
0
4
6
8
10
12
14
16
Surface Temperature / Température en surface (°C)
Fig. 6 Dormancy duration (difference between entry and emergence dates) as a function of (A) deep-water temperature representative of dormancy depth at each station, and (B) surface (5 m) temperature on the onset date. The regression relationship in (B) is significant (p < 0.05). Abbreviations are as in Figure 2.
Durée de la dormance (la différence entre les dates d’entrée et de sortie) en fonction (A) de la température des eaux profondes correspondant à la profondeur de la dormance pour chaque station, et (B) de la température en surface (5 m) à la date d’entrée. La régression en (B) est significative (p