take national privacy policies and laws into account as well as address user privacy ...... https://developer.apple.com/library/ios/documentation/UserExperience/ ...
Copyright IBM. A final version of this paper is published in the IBM Journal of Research and Development, vol. 58, no. 5/6, pp. 3:1-12, 2014.
Understanding customer behavior using indoor location analysis and visualization Authors: Yaeli, A.; Bak, P.; Feigenblat, G.; Nadler, S.; Roitman, H.; Saadoun, G.; Ship, H.;Cohen, D.; Fuchs, O.; Ofek-Koifman, S.; Sandbank, T. Abstract: Understanding customer behavior in brick-and-mortar stores and other physical indoor venues is essential for any business aiming to provide a more personal and compelling shopping experience, optimize store layout, and improve store operations. Achieving these goals ultimately leads to improved user experience, conversion rates, and increased revenue. Today’s mobile-based location technologies provide information about the user’s location that can be leveraged for advanced analytics and visualizations. This means retailers and enterprises can gain insight into customer behavior patterns and understand, for example, how much time customers spend in different areas of the store, what are the routes they take, how well they are serviced, and more. In this paper, we present a solution approach for better understanding customer behavior based on mobile indoor location data as well as the technologies developed by IBM Research for realizing this solution. We describe significant challenges considering data collection, curation, analysis, and visualization of indoor location-based data and illustrate its use for smarter commerce in a real-world use case.
Introduction Today’s mobile devices include many different technologies that enable the mobile device user’s location to be identified. Global Positioning System (GPS) and cellular triangulation are available in all modern smartphones; however, these technologies are not effective for providing location data when users are inside a roofed venue. The indoor location market is a convergence of a number of technologies used to determine the location of a person or an asset indoors, leveraging technologies like WiFi, Bluetooth, Radiofrequency identification (RFID), and location sensor technologies such as accelerometers and gyroscopes as alternative or complementary technologies to GPS. The extensive demand for location-based applications indoor and the research advancements in indoor location technologies have led to a very dynamic market. Analyst firms estimate this market to reach $5B by 2018, representing a compound annual growth rate (CAGR) of 42.1% [1][2]. Major vendors are making large investments in indoor positioning technologies [3] that
enable the development of location-based platforms, applications, and services across many industries. These technologies include: indoor mapping and navigation, real-time asset tracking in hospitals, self-reported location update via mobile application “check-in”, location-based triggering and notification based on predefined virtual geographic perimeter “geo-fence” in public safety, in-store 1-click payments in retail stores, and in-store location-based analytics and promotions.
Indoor location analytics in retail Understanding customers’ locations indoors is of special importance to retailers, mall owners, the travel and transportation industry (airports, train stations), banks, hospitals, security managers, and any enterprise that provides services to people who are indoors. The need to understand customer behavior in indoor venues is essential for any business aiming to provide a more personal and compelling shopping experience, optimize the physical store layout, improve store operations, and ultimately drive improved user experience, sales conversion rates, and increased revenue For comparison, eCommerce companies invest heavily in advanced analytics to understand customer behavior on their web sites. When a consumer visits an eCommerce site, he either visits anonymously or logs in to the site. Logging in enables the site owner to learn about him and thus provide more personalized services and offers. As he clicks on various links/pages, views information, puts items in the virtual basket, etc., the site is collecting valuable information about everything he does, how long it takes him to perform each action, when he abandons an action/path, etc. In addition to learning about individuals and providing better services and promotions to them, aggregate level analytics are also very valuable to the enterprise. They are used to improve product assortment, the supply chain, workforce management, and pricing, to name a few. Obviously any data collection and analysis need to take national privacy policies and laws into account as well as address user privacy concerns for example by providing an opt-in option for some of these services. When a customer visits a brick-and-mortar store, none of this information or analytics is available to the enterprise. For this reason, indoor location tracking technologies are on the rise. Systems such as IBM Presence Zones[4] have been developed to address this exact challenge, to collect the data about traffic patterns in indoor places such as stores, malls, or banks, and to generate the data, enabling advanced analytics for physical venues in much the same way it is done on eCommerce sites. In this paper, we present a solution approach for better understanding customer behavior indoors, and the technologies developed by IBM Research to realize such solutions for retailers. Our solution helps retailers to gain additional insight into customer in-store behavior and preferences. This insight can be used to deliver a unified experience across the digital and physical channels and enables the engagement of shoppers in real time to personalize and enhance their in-store shopping experiences. Our solution is based on the deployment of WiFi sensors in the physical venue that “listen” to (sniff) transmissions from WiFi-enabled devices such as smartphones and tablets. The heart of the solution includes advanced technologies and algorithms that enable the determination of the location of the WiFi-enabled devices. Since raw location data captured from WiFi signals is
noisy and contains errors, the algorithms curate the data and prepare it for subsequent processing. Advanced analytical processing, visualization, and reporting components deliver the insight needed to understand in-store customer behavior, such as customer segments and their paths within the physical venue. Finally, the solution integrates with enterprise marketing management products, such as IBM Interact[5] and IBM xTify [6], for delivering a unified and personalized shopping experience and promotions for shoppers who opt-in to this service. In the next sections, we provide a brief review of the common indoor positioning technologies. Then we describe in more details the technical components of our solution and present some of the significant technical challenges considering collection, curation, analysis, and visualization of indoor location-based data based on WiFi signals. We further exemplify the notion of customer behavior insight using several visualizations created based on anonymized data of a real-world deployment of a smarter commerce solution
Indoor positioning technologies The indoor location market is dynamic and rapidly evolving to enable a variety of applications, services, and solutions across many industries. The fundamental technology in all solutions is a positioning one. Many studies have been done in this field [7,8], and in this section, we briefly review some of the relevant technologies that have been studied and developed in research and by commercial vendors. Our goal here is not to be comprehensive but rather to provide the reader with sufficient background on concepts and technologies underlying indoor positioning solutions. Several technologies exist for determining an object’s position in an indoor environment (positioning). The positioning can be done by the object’s mobile device, or an external system can track objects and calculate their positions. Most of these technologies are based on radio frequency (RF) signaling; however, other technologies such as extracting location from video exist. RF positioning techniques can be further divided into two categories: triangulation and scene analysis such as fingerprinting [8]. Positioning technologies can be classified by additional dimensions such as the level of setup, calibration and training that is needed in order to reach accurate position measurements, and the level of battery usages in mobile and sensing devices. Radio frequency technology poses several challenges when used for indoor positioning. Buildings are made of a variety of construction materials. In general, these materials do not allow light or radio waves to propagate evenly. The line-of-sight problem occurs because signals do not reach receivers as they are blocked by internal walls. Another problem that can occur is reflection, when signals reflected by internal walls cause false detection of objects. A related aspect is the required accuracy (or resolution). The dimension of a room in a building is often measured at a resolution of a few meters. Consequently, several applications of indoor positioning, for example navigation, require an accuracy of a similar order. Global navigation satellite systems (GNSS), such as GPS, which provide inexpensive, reliable, accurate positioning have become commonplace since the late 2000s. However, despite consistent major improvements in the technology [9], GNSSs have not been able to overcome the interference caused to satellite signals by building materials. Therefore, they are rarely used for indoor positioning. [10]
Passive RFID tags work by initiating a transaction as they pass a sensor whose position is fixed and known. The position of the tag and the time of the transaction are then known. However, the sensors only detect when a tag enters or exits a radius of a few meters, and so is most often used to locate at the room level. A network of sensors can be set up to perform triangulation. On the other hand, active RFID tags send a constant signal that can be detected to accurately position the tag. These tags tend to be expensive and are not included in smartphones or other consumer devices, so their utility is limited. Location based on near field communication (NFC) works similarly to passive RFID, except that the maximum range of the sensors is only about five centimeters. It is similarly restricted to locating at the room level. Unlike RFID, NFC is included in hundreds of millions of smartphones and so has promise whenever room-level accuracy is sufficient. Bluetooth-enabled devices are even more common than NFC; most smartphones are Bluetoothenabled. However, the high power consumption of early Bluetooth devices has resulted in a low adoption rate of this technology. Bluetooth low energy (LE), part of the Bluetooth 4.0 standard, promises to encourage more consumer adoption and vendor adoption, such as Apple iBeacon specification [11]. The range of Class 2 Bluetooth devices found in most smartphones is around ten meters. Cellular telephone signals such as GSM can be received in many indoor environments. Triangulation using these signals can provide a rough estimate of an object’s position in many indoor environments, but only within several hundred meters. This is inadequate for the vast range of indoor positioning applications, and so cellular triangulation is not often used for this. WiFi positioning systems can be divided into two categories. WiFi triangulation measures the signal strength of nearby access points and approximates their respective distances. The receiver’s position is computed geometrically. In contrast, scene analysis such as fingerprinting compares the signal strength of nearby access points to reference values at known locations. Additional input, such as a smartphone’s compass, gyroscope, and accelerometer, can be integrated to increase both the range and accuracy of the positioning. The aforementioned techniques are preformed inside mobile client devices, however similar techniques can be used by systems that tracked WiFi transmitters and calculate their location inside a venue. Another important asepcts Indoor positioning technologies can be also classified
A solution for analyzing in-store customer behavior Our overall goal in this work was to develop a commercial solution that can help retailers gain additional insight into customer in-store behavior and preferences. Since retailers already use sophisticated tools to understand and appeal to shopper’s preferences in online stores, our solution needs to integrate with and complement existing marketing approaches and technology investments. The integrated solution therefore provides a 360 degree view of the customer and a unified experience across the digital and physical channels. To provide a 360 degree view of a customer, our solution needs to map concepts of indoor behavior to concepts and key performance indicators (KPIs) commonly used in online store analytics. Finally, to support a unified engagement and promotions to shoppers, our solution integrates with other marketing management products such as IBM Marketing Operations (formerly IBM Unica)[12], IBM
Digital Analytics (formerly IBM Coremetrics) [13], IBM WebSphere Commerce[14], and IBM xTify. Our solution is based on the deployment of WiFi sensors in the physical venue that “listen” to transmissions from WiFi-enabled devices such as smartphones and tablets. The location tracking and analytics technology opens a window into customers’ in-store behavior. This allows retailers to better segment customers, understand their preferences and what they are looking for, adjust store operations and promotions, and essentially serve customers better. For customers who optin, the technology can help retailers learn about distinct shopper profiles and respond to customers as individuals. This means appealing to them with timely, personalized offers and promotions on the spot, based on their in-store locations and past browsing and purchasing history, thus delivering a personal shopping experience that is all around them, based on realtime contextual mobile engagement. In the next sections, we describe some of the key constituents of the solution. We start with the overall architecture and how the technology integrates within the broader context of enterprise marketing management products. Next, we explain how the system is deployed and trained within indoor physical venues in a way that enables accurate computation of the locations of mobile devices. We discuss some of the technical challenges in dealing with WiFi signals and the curation of data to prepare it for subsequent analytical processing. We the describe how to gain behavioral insight from indoor location data and how this insight maps to analytical concepts used for online stores. Finally, we illustrate some of the visualizations used to communicate behavioral insights of individual and customer segments within a physical venue.
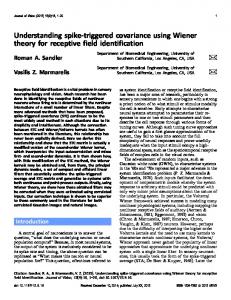
Architecture This section describes the architecture for building a indoor location analytics solution for retailers. We describe the key structural elements of the system, how they collaborate to realize common use cases, and how the system is deployed and tuned to perform well. Figure 1 depicts the main elements of the solution: (1) physical sensors and network infrastructure is deployed in the indoor venue to capture transmissions from WiFi-enabled devices; (2) a Presences Zones server is responsible to accurately compute devices’ locations as well as to extract insight into customer behavior indoors. In addition, the solution integrates with the broader IBM portfolio of Smarter Commerce products to deliver comprehensive marketing capabilities such as cross-channel marketing optimization, personalized promotions and more.
Figure 1 The solution architecture. The Presenze Zones server captures data collected from WIFI sensors and analyzes in-store customer behavior. The integration with the Smarter Commerce family of products enables to deliver a unified, cross-channel, personalized marketing solution.
Presence Zones sensors and network
The solution is based on the deployment of designated sensors that are able to “listen” to transmission from WiFi enabled devices. All WiFi enabled devices whose WiFi is turned on interact with WiFi network in the venue, whether they are logged on to the WiFi network or not. The Presence Zones sensors capture the unique identifier of the device and send information about the strength and number of packets transmitted to the Presence Zones Server. The media access control (MAC) address is used as the unique identifier of the device. The location of the device is then calculated based on the information about that device, which is received by multiple sensors in the venue. The deployment of the sensors in the physical venue needs to be planned in such a way that the sensors will provide sufficient “coverage” to accurately compute location. Presence Zones server
At its core the Presence Zones server includes a module for computing and tracking the location of devices in the indoor venue. The computation of location is based on the principle of the raw signal data being detected by multiple sensors in the venue, and that the system can be trained to
learn how specific analytical patterns over this data look at different areas within the venue. In addition, the server uses advanced algorithms to overcome challenges related to quality and accuracy of the raw captured data. The training of the system is performed as part of the deployment stage of the system. The administration and management module facilitate that stage by providing capabilities for planning, installing, registering, and monitoring sensors, as well as calibration and testing of the sensors for obtaining desired accuracy level. The administration and management module further includes capabilities for managing user preferences and privacy settings with respect to location tracking, analysis, and engagement. The system is configured to analyze only registered shoppers through the "opt-in" feature. When configured to analyze unregistered shoppers, no identifying information about the unregistered device or its user is stored in the system. It does not require shoppers to invoke an application or take any other action. Shoppers who want to register for an exceptional in-store experience can choose to do so through the retailer's mobile application, via a WiFi splash screen or other methods. Once location data has been calculated by the location tracking module, it is passed to a data warehouse via an extract transform load (ETL) process. The data warehouse accumulates historical information and organizes the data in a way that facilitates further processing, analytics, and reporting. The analytics and visualization components leverage the information captured in the data warehouse to further extract insight relating to customer behavior indoors. It applies various analytical techniques for identifying and explore special customer segments based on how they move across different areas within the physical venue. The results of the analysis and visualization are available through reports, dashboards, and interactive visualization. IBM Smarter Commerce platform
The IBM Smarter Commerce platform includes a portfolio of marketing products and capabilities. IBM Presence Zones integrates with these products to provide a comprehensive cross-channel marketing solution for retailers.
IBM WebSphere Commerce is used for delivering a consistent shopping experience across multiple channels, including mobile, social, and in-store.
IBM Interact and IBM Marketing Operations (formerly Unica) are used to deliver personalized marketing and promotions based on marketer-defined business logic. IBM Marketing maintains user profiles and segmentations and determines the most appropriate promotion for a particular user. IBM Interact enables those promotions to be sent in real time to customers.
IBM Digital Analytics (formerly Coremetrics and Tealeaf) is used to gain customer insight from web analytics.
IBM Xtify is responsible for delivering personalized mobile notifications at the right time, at the right location, and through the right channel.
Location data capturing and curation Two main architectural approaches must be considered when designing an indoor location system for the enterprise. The first one, which is also the more common one, is that the device senses the environment. In other words, the location inference is done on the device itself. This approach was adopted by many companies, including Google and Apple. In the second approach, the environment senses the device, and this is typically done by leveraging the public WiFi Access Points deployed in the venue. The downside of the first approach is that it involves installing software on a mobile device, which requires the customer to proactively take part in this process by installing an application and turning it on each time he enters the venue. This means that the customer is not guaranteed to ever be identified by the system. In addition, some tracking applications ping the network at a fixed rate to survey the environment, which drains the battery of the user’s mobile device very quickly. With the second approach, the customers do not have to do anything proactively, greatly increasing the percentage of the population tracked. In addition this approach doesn’t incur additional network communication from the mobile device, therefor it is much more batteryfriendly. The downside is the dependency on the WiFi provider. Moreover, tracking the devices can only be done on the access point or by integrating with it. With Presence Zones we adopt the second approach, but without dependening on the access points. Instead, the sensing is done utilizing off-the-shelf thin client computing devices acting as sensors. These sensors ”listen” to data going over the WiFi channel (known as “sniffing”) of devices that are in proximity to them and then send the collected data to the location tracking component for processing. Each sensor has two standard IEEE 802.11 WiFi adapters. One is dedicated to communication with the server and the other one for sniffing. The sniffing adapter works in “monitor” mode, which means that the driver passes all the radio frames sensed rather than just the ones targeted for it. The main input in runtime to the Presence Zones application is streams of updates coming from sensors, containing data from the devices intercepted. The data contains MAC addresses, statistical information of RSSI (Received Signal Strength), noise level, time-related data, the number of collected frames, and more. In addition, the data is aggregated on the sensor, based on the MAC address of the WiFi frames. At every pre-defined threshold (about a few seconds), it is sent to the Presence Zones location server for processing. The component responsible for receiving the data from the sensors is called the ''Updates Gateway''. Its main responsibility is to enrich the data with historical data and to inject it as additional input to the location algorithm. The algorithm calculates the location based on the enriched location data and stores it The system maintains a map for each floor of each monitored site. Initially, the calculated location record includes: (1) the identification of the monitored site; (2) the floor ID within the venue; and (3) the (x,y) coordinates within the floor map. At a later stage, the record is also enriched with the identification of zones of interest within the floor, for example a store section. This step can be thought of as a reverse geocoding process, however, it is possible to define overlapping zones and a device could be in more than a single zone. Presence Zones uses many different techniques and algorithms for calculating location. Some of these techniques are proprietary, while others such as fingerprinting are well-known in the
literature. With fingerprinting, characteristics of the WiFi channel measured during an offline site survey are compared to the same characteristics measured during the online phase. Since raw measurements from WiFi signals may contain noise and errors due to how radio wave are reflected or blocked within indoor venues, additional algorithms are applied to curate the data and overcome these challenges. This is essential for establishing a strong data foundation for online location awareness and subsequent offline analytical processing. Some of the challenges that have to be addressed are WiFi signal strength not being steady, signal reflection, spatial ambiguity, and more. The system needs to be trained upon initial setup or when the store layout changes significantly. During the offline training of the system, an engineer surveys the site by recording data every few meters. For each surveyed coordinate represented as (x,y), a sample P[x,y] is created from the data received from the device performing the training. The sample can be expressed as t vectors of N dimensions, where t is the number of characteristics recorded and N is the number of sensors. For instance, assuming the j'th characteristic (for 0 < j