Understanding Institutional Collaboration networks: Computer Science vs. Psychology 1
Jiadi Yao, Les Carr1 and Stevan Harnad2 1
[email protected] School of Electronic and Computer Science, University of Southampton, UK 2
Department of Psychology, Universitédu Québec àMontréal, Canada
Abstract Institutions assume that if they are more productive (i.e., publish more papers), they will produce more high quality research. They also assume that if they collaborate more, they will be more productive. We test these causal assumptions using nearly 30 years of worldwide publication and citation data in Computer Science and Psychology. Four quality metrics, three collaboration metrics and one productivity metric were used. Spearman’s Rank Order non-parametric correlation shows that these three groups of variables are highly inter-correlated. Regression analysis was used to partial out the effect of the third variable and reveal the independent correlation between each pair of the variables. In Computer Science, the more productive institutions publish higher quality research as measured by citation counts (including citation counts recursively weighted by the citation counts of the citing institution); the effect is the same, but not as strong, in Psychology. Higher average paper quality in both Computer Science and Psychology are more likely to be a result of greater institutional collaboration than of higher institutional productivity. The proportion of the institutional collaboration is closely linked to institutional quality and productivity. The more proportionally collaborated institutions in fact are less qualitative as well as less productive.
Introduction Institutions assume that if they are more productive (i.e., publish more papers), they will produce more high quality research. They also assume that if they collaborate more, they will be more productive. The trend for collaborative research has steadily increased over recent decades (Beaver and Rosen, 1978`; Newman, 2004; Choi, 2012), and research has shown the benefits of the collaboration (Katz and Hicks, 1997; Katz and Martin, 1997; Lariviere et al., 2006; Almendral et al., 2007). European Union research policies support collaboration, encourage creation of institutional networks, sharing of knowledge and promoting innovation. Research programs -- for example, the Framework Programme (FP) -- are established to fund research across the member states, encouraging cross institutional collaboration. In this paper, we exam some causal assumptions about the relations among productivity, quality and collaboration using nearly 30 years of worldwide publication and citation data in Computer Science and Psychology. As early as 1926, Lotka (1926) studied the relationship between the number of individuals at different productivity levels: the number of researchers who publish one paper per year is two orders of magnitude more than the number who publish 10 papers, and four orders of magnitude more than the number who publish 100 papers. This is referred to as Lotka’s Law of productivity. Price and Beaver (1966) showed that the number of collaborators is positively correlated with the number of articles published by the author. Through qualitative analysis, they also found that the most prolific researchers also collaborate most. A year later, Zuckerman (1967) interviewed 41 Nobel laureates in science disciplines and identified a strong relationship between collaboration and productivity. Laureates published more papers and also collaborated
more than a matched sample of scientists. Pravdić and Oluić-Vuković (1986), using collaboration and productivity data in Chemistry, found that research output is correlated with frequency of collaboration. After interviewing a sample of the authors, they also learned that collaborating with high productivity authors is positively correlated with personal productivity whereas collaborating with low productivity is negatively correlated. Glänzel and Schubert (2004) consider collaborations at three different levels: person level co-authorship, crosscountry co-authorship and multi-country co-authorship. For all three levels, co-authorship is positively correlated with productivity. The same positive correlation is found by Adams et al. (2005) between the size of collaboration groups and the scientific productivity. Lee and Bozeman appear to have found something subtler. In their 2003 research report (Bozeman and Lee, 2003), they used a regression model to determine whether the predictive power of collaboration depended on factors such as job satisfaction, rank, age, gender etc. They surveyed and interviewed 443 academics to obtain their data and then calculated the regression. Regardless of any further variables added to the regression, the number of collaborators of an author remained the strongest predictor of productivity. However, in their later paper on the same topic (Lee and Bozeman, 2005), they extended the article and book counting method in two ways: fractional counts (each author gets an equal fraction of the credits for collaborative papers) and full counts. While number of journal papers was still strongly and significantly correlated with number of collaborators, there was no significant correlation between number of collaborators and publication counts when using fractional counts. It seems that different counting methodology can potentially lead to very different results, however, the exact counting methodology is often omitted in the literature. More recently, Defazio et al. (2009), using the EU framework programme to study these variables in Chemistry, found that researchers tend to collaborate just to secure funding, the impact of funding on productivity is positive, but the impact of collaboration is weak. By splitting the period into pre-funding, during-funding and post-funding periods, they found that collaboration during funding does not correlate with productivity; post-funding, however, although collaboration decreases, it has a strong positive correlation with productivity. So it appears that the connections the researchers established pre-funding and during-funding went on to have a positive effect on subsequent research output. The research discussed so far was all based on cross sectional data, making cause-effect inferences untestable. He et al. (2009) constructed a longitudinal dataset of 65 New Zealand researchers for 14 years. Among other findings, they claimed that international collaborations are positively related with future research output. However, they could not find any significant correlation with future output for within-university collaboration and domestic collaboration. Data and Method Data Source and Descriptive Statistics The source data are from Thomson-Reuters Web of Science, covering Computer Science and Psychology papers published from 1973 to 2010. The papers are stored in a MySQL database in the format of four separate tables describing the article’s subject, author, institution and citation counts. There are 479,913 Computer Science papers, of which 164,553 (34%) are multiinstitution collaborative papers, 277,425 (58%) are single-institution papers and the remaining 37,935 (8%) do not have any institution specified. 267,666 papers have at least 1 citation, with
an overall nonzero citation rate of 56%. The total number of citations received by the Computer Science papers was 2,711,196. There are 208,066 Psychology papers, covering General Psychology, Clinical Psychology and Social Psychology, hence less than half the number of Computer Science papers published in the same period. Of these 68,141 (33%) papers are multi-institution collaborative papers, 130,891 (63%) single-institution papers, while the remaining 9,034 (4%) do not have institutional information. The percentage distribution of institutionally collaborated papers is very close to that of Computer Science. Psychology is a more highly cited discipline than Computer Science. Of all the Psychology papers, 156,992 received at least 1 citation, this accounts for 75% of total papers -- a much higher percentage than in Computer Science. Total citations for Psychology papers were 3,514,787: almost 1 million citations more than Computer Science on less than half the number of papers. 1,125 institutions published more than 100 Computer Science papers in the period of 1973 to 2010. Of these 8% are companies, 5% are research institutes, while the remaining 88% are universities. Of the 88% universities, 698 (71%) universities are identifiable through a matching name in Webometrics university ranking. Psychology is a less commercially applied discipline than Computer Science: no company is listed as the institutional affiliation for Psychology papers. Out of 542 institutions, 10% are research institutions, while 90% are universities. Among these universities, our algorithm was able to identify 414 (88%) universities. The analysis presented in this paper is based only on the identified universities. Description of Metrics Correlations were analysed for three institutional variables: collaboration, productivity and quality using the following metrics: Productivity (P) 1973-2010 was measured by total institutional papers output Collaboration (C) 1973-2010 was measured by:
Number of Collaborative Papers (CN) Size-weighted Collaboration(CS) Percentage Collaboration (CP)
CN, the total number of papers with at least two distinct institutional affiliations, is the number of cross institutional collaborative papers an institution has published according to WOS 19732010. CS is CN weighted by the size of the collaboration: Instead of treating every collaborative paper equally, papers with more authors contributing and more institutions participating are assigned a higher score. The formula to calculate CS is: 𝐶𝑆𝑖 = ∑ 𝐴𝑝𝑖 × (𝑇𝐴𝑝 − 𝐴𝑝𝑖 ) 𝑝
Where Api is the number of authors from institution i on paper p, TAp is the total number of authors for paper p. CP is the ratio of an institutions papers that are collaborative: the ratio of C to P, for institution i: 𝐶𝑖 𝐶𝑃𝑖 = 𝑃𝑖
Quality (Q) is estimated with four metrics, three citation based, 1973-2010, and one institutional ranking based: Citations per institution (QC) PageRanked citations per institution (QPR) (incoming citations weighted by the citation weight of the citing institution) Citations Per Paper (QCP) Institutional Webometrics Rank (QW), July-2010 version. The abbreviations for quality variables all start with Q. QC is the sum of all the citations received by the papers published by the institution 1973-2010. It measures overall institutional impact and quality. QPR is derived by applying PageRank algorithm. QPR recursively weights the cited institution’s citation count by the citing institution’s citation count. Both QC and QPR are measures of institutional quality in a given discipline. QCP is the institution’s average citation count per paper, calculated by dividing institution’s total citation QC by its total paper output P. This becomes an institutional size-normalised quality metric, or simply put, the institution’s average paper quality. This quality metric is, in general, closer to what institutions hope to increase with higher productivity. QW is the rank of the institution according to the July 2010 version of the Webometrics ranking. The Webometrics rank is itself a composite metric derived from some of the other quality, collaboration and productivity metrics used in this study. Hence QW is not an independent variable: a strong correlation is expected with productivity. To make the result easier to interpret, the rank ordering is inverted, so high rank indicates higher quality; this way, a positive correlation corresponds to positive relationships between quality and the other two variables. In the remaining sections, bold and italic variable names represent the raw, and un-filtered state, while italics-only represents the variable with the other effects partialled out. For example, P represents the original paper count for institutions, while P represents the paper count with either collaboration or quality effects removed. Method Spearman’s Rank Order correlation rho (ρ) is used to measure the associations between the pairs of variables. The value of ρ varies between -1 to 1, where -1 is a perfect negative correlation and 1 is a positive correlation. 0 means no correlation. No transformation of the original data is needed because this non-parametric metric makes no assumptions about distribution. Multiple regression was used to partial out the effect of the third variable: 𝑦 = 𝛽𝑿 + 𝜖 The dependent variable y is expressed as a vector of independent variables X with a linear transformation β, plus the residual ϵ, which is the unpredicted portion of the variance. This is the portion of y left after removing X. In order to apply ordinary partial correlation, both the dependent variable y and the independent variable X would have had to be normally distributed. However, the distribution of publication number, collaboration metrics and citations is generally not normal(Barabási and Albert, 1999; Newman, 2001). Instead, they are distributed according to a power law, with most institutions publishing a small number of papers and most papers published by a few institutions. A power transformation is needed to convert these skewed distributions into a normal distribution before applying the partial correlation. To determine the best λ value for the power transformation 𝑦 = 𝑥 𝜆 , the Box-Cox technique implemented in SPSS was applied. Box-Cox tests a series of λ values and plots the distribution
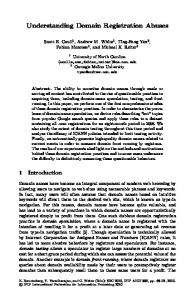
of the transformed variable. Q-Q plot histograms are drawn by the algorithm for manual selection of the transformation best approximating normality. Results and Discussion Productivity and Quality The institutional productivity (P) and institutional disciplinary research quality variables (QC and QPR) show statistically significant, positive and high correlations in both disciplines (Figure.1). These two pairs of correlation coefficients (P with QC and P with QPR) in both disciplines reach the high 0.8 range. When the collaboration effects indexed by institutional collaborative papers (CN), size-weighted collaboration (CS) and percentage collaboration (CP) are removed one by one completely from P and QPR using partial correlation, the correlation coefficient is reduced substantially in both disciplines, but is still statistically significant and positive. In Psychology, the correlation between P and QC dropped to 0.364 from 0.879 after the removal of collaboration effects, while the correlation between P and QPR dropped to 0.056 from 0.856. Computer Science had a similar major reduction after partialling out collaboration, from 0.905 to 0.438 between P and QC, and from 0.885 to 0.276 between P and QPR. In both disciplines average paper quality (QCP) per institution has a significant medium-sized positive correlation with the number of institutional papers published (P): 0.501 for Computer Science and a higher 0.537 for Psychology. However, in Computer Science the correlation disappears once collaboration effects are removed. In Psychology, a large reduction also occurs, but the correlation remains significantly positive. Productivity correlates with Quality (Collaboration effects removed)
Productivity Correlates with Quality .905 ** .879 **
P QC
.885 ** .856 **
P QPR
.438 ** .364 **
P QC
.276 **
P QPR
.056 **
P QCP
.501 ** .537 **
P QCP
-.006 .122 **
P QW
.490 ** .608 **
P QW
.124 ** .088 **
.000
.200
.400
Computer Science
.600
.800
Psychology
1.000
-.100
.000
.100
.200
Computer Science
.300
.400
.500
Psychology
Figure 1. Correlation between productivity P and quality (QC, QPR, QCP, QW). Left: pairwise correlations, without removing collaboration effects (CN, CS, CP). Right: correlations after partialling out collaboration effects. Large reductions are observed in all pairs of correlations. In both disciplines the correlations between P and QC, P and between QPR were significant, positive and high. Psychology has stronger correlations than Computer Science between P and QCP and between P and QW. In Computer Science, P and QCP are not correlated once the collaboration effects are removed, whereas in Psychology, the correlation is reduced to 0.122 from 0.537. ** indicates p