intricacies of the wireless portion of a congested network by inter- ... tion layer metrics on the wired portion of the network, and/or (2). SNMP and syslog ...
Understanding Link-Layer Behavior in Highly Congested IEEE 802.11b Wireless Networks Amit P. Jardosh, Krishna N. Ramachandran, Kevin C. Almeroth, Elizabeth M. Belding-Royer Department of Computer Science University of California, Santa Barbara {amitj,krishna,almeroth,ebelding}@cs.ucsb.edu Abstract The growing deployment and concomitant rise in wireless network usage necessitates the comprehensive understanding of its behavior. More importantly, as networks grow in size and number of users, congestion in the wireless portion of the network is likely to increase. We believe there is a strong need to understand the intricacies of the wireless portion of a congested network by interpreting information collected from the network. Congestion in a wireless network can be best analyzed by studying the transmission of frames at the link layer. To this end, we use vicinity sniffing techniques to analyze the link layer in an operational IEEE 802.11b wireless network. In this paper, we discuss how congestion in a network can be estimated using point-to-point link reliability. We then show how link reliability is correlated with the behavior of link-layer properties such as frame retransmissions, frame sizes, and data rates. Based on the results from these correlations, our hypothesis is that the performance of the link layer in congested networks can be improved by (1) sending smaller frames, and/or (2) using higher data rates with a fewer number of frames sent. Categories and Subject Descriptors: C.2.3 [Network Operations]: Network Monitoring, C.4 [Performance of Systems]: Measurement Techniques and Performance Attributes. General Terms: Measurement, Performance. Keywords: IEEE 802.11b, Network Congestion, Performance Analysis.
1.
INTRODUCTION
The growing deployment and concomitant rise in wireless network usage necessitates the comprehensive understanding of its behavior. To address this issue, researchers have computed models and statistics for aggregated traffic flow patterns [2, 5, 7, 8, 10], movement patterns [3, 4, 11], and wireless link quality measures [1]. In most cases, researchers have utilized: (1) aggregate flow analysis techniques to gain insight into transport and application layer metrics on the wired portion of the network, and/or (2) SNMP and syslog information from access points to model movement and association patterns.
Permission to make digital or hard copies of all or part of this work for personal or classroom use is granted without fee provided that copies are not made or distributed for profit or commercial advantage and that copies bear this notice and the full citation on the first page. To copy otherwise, to republish, to post on servers or to redistribute to lists, requires prior specific permission and/or a fee. SIGCOMM’05 Workshops, August 22–26, 2005, Philadelphia, PA, USA. Copyright 2005 ACM 1-59593-026-4/05/0008 ...$5.00.
Although previous work has contributed to the understanding of wireless networks, it is the RF (radio frequency) environment that is usually responsible for performance bottlenecks. The wired backhaul network is typically sufficiently provisioned to handle large traffic flows to and from the wireless network. Recent work has observed the performance of and detected anomalies in the MAC layer through measurement experiments in either controlled environments [12] or on small-scale wireless networks in environments free of ancillary interference [9]. However, the results derived from small-scale and controlled experiments are not representative of the variations in MAC layer properties that are axiomatic to large-scale congested networks. The study of MAC layer properties provides a good measure of the contention for channel occupancy in the wireless medium which can be used to estimate congestion in the network. As wireless networks become densely-populated and heavilyutilized, there arises a need to fully understand the intricacies of the wireless portion of these networks by interpreting collected MAC layer information. A large-scale, congested wireless network is characterized by extensive medium occupancy, high throughput, frequent bit errors, numerous retransmissions, and significant data rate variations. To fully understand the interplay of these properties, it is essential to monitor and study an operational congested network. To this end, we analyzed a wireless network deployed at a recently concluded 62nd Internet Engineering Task Force (IETF)1 meeting held in Minneapolis, MN. The meeting was held March 6–11, 2005 and was attended by 1138 participants. Almost all of the participants used laptops or other wireless devices. The wireless network at the meeting consisted of 38 IEEE 802.11b access points deployed on three adjacent floors of the venue. An analysis of the data shows that the large number of participants and access points resulted in heavy utilization of the wireless network along with multiple periods of congestion. The method adopted to collect information from the wireless portion of the IETF network is referred to as wireless network monitoring [12] or vicinity sniffing. In order to capture network frames that were transmitted by access points and user devices in the network, we chose to place three laptops (wireless network sniffers) at a single vantage point in the network. The location was strategically selected so that our sniffers could overhear and record the maximum possible information. One of the most interesting periods of network congestion during the week-long meeting was observed during a plenary session held between 19:30 hrs and 22:30 hrs on March 10, 2005. The session had a total of over 500 attendees in an open meeting room of size 30 × 25 meters. The data collected during this session shows that (1) 1
http://www.ietf.org/
at any given time during the meeting, there were 250 to 300 users out of the total attendees associated with the network on channels 1, 6, and 11; (2) the participants sent and received a total of over 9 million data frames; (3) the most active AP, as recorded in our data set, sent and received a total of 1.37 million data frames; and (4) the network throughput peaked at 5.5 Mbps, close to the theoretical optimum [6]. In this paper we focus on this plenary session. The network conditions at the plenary best satisfy both of our study criteria of being large and congested. Through analysis of the data, we make the following hypotheses: (1) as congestion in the network intensifies, smaller frames are more likely to be successfully received; and (2) in a congested network, the use of high data rates and the transmission of fewer frames reduces per-frame channel occupancy and decreases medium contention respectively. Following the recommendations suggested by these two hypotheses is likely to increase network throughput. The paper is organized as follows. Section 2 provides an overview of the data collection methodology and describes the challenges of vicinity sniffing in large-scale networks. Section 3 describes a method for estimating network congestion. The effects of congestion on data frame retransmissions, frame sizes, and data rates are discussed in Section 4. Section 5 discusses the conclusions from our study.
2.
MONITORING METHODOLOGY
This section describes the setup of the wireless network, our monitoring framework and a set of challenges of conducting vicinity sniffing in large-scale and congested networks.
2.1 The Network The IETF network was comprised of 38 Airespace2 1250 access points (APs) distributed on three adjacent floors. Each Airespace AP supported four virtual APs. A virtual AP is a logical AP that exists within a physical device and enables the wireless LAN to be segmented into multiple broadcast domains. This provides the ability to map multiple Extended Service Set Identifiers (ESSIDs) to multiple Basic Service Set Identifiers (BSSIDs). Thus, at the IETF, a total of 112 APs (38 physical APs × 4 ESSIDs per physical AP) were available for utilization. Based on our study, we found that during the plenary session, i.e., between 19:50 hrs and 21:50 hrs, at any given instant, approximately 250 to 300 users were associated with the APs on channels 1, 6, and 11. The majority of the users entered the meeting room between 19:30 hrs and 19:50 hrs and began leaving the meeting at around 21:50 hrs. In Section 3, this arrival and departure of users will be used to explain the increase and decrease in throughput in the network. In order to optimize network performance, the Airespace APs are designed to support dynamic channel assignment, client load balancing, and transmission power control. Unfortunately, technical details on the optimization algorithms are proprietary and are not known to us. Nevertheless, we observed that wireless network traffic during the plenary session was fairly well distributed between the three orthogonal channels 1, 6, and 11. Also, the APs were observed to switch channels dynamically during the plenary session to balance the number of users and traffic volumes between the three channels on all APs. The network users collectively sent over 9 million data frames during the three-hour session of the plenary, amounting to a total data log size of 15 gigabytes. In Section 3 we discuss the effect of this volume of frames on the throughput of the network on all three channels. 2
http://www.cisco.com/en/US/products/ps6306/index.html
2.2 The Collection Framework We performed vicinity sniffing using three IBM R32 Think Pad laptops. Each laptop was equipped with a Netgate 2511 PCMCIA 802.11b radio. The radios were configured to capture frames in a special operating mode called the RFMon mode. The RFMon mode enables the capture of regular data frames as well as IEEE management frames that are transmitted on a single channel. In addition, the RFMon mode records information for each captured frame. This information includes the send rate, the channel used for frame transmission, and the signal-to-noise ratio (SNR) of the frame as received by the sniffer. Because the Airespace APs were expected to switch between the 802.11b 1, 6, and 11 channels, our laptops were each configured to sniff on one of the three different channels for the duration of the session. The frames were captured using the sniffer utility, tethereal. The snap-length of the captured frames was set to 250 bytes in order to capture only the RFMon, MAC, IP, and TCP/UDP headers.
2.3 Vicinity Sniffing Challenges Yeo et al. [12] discuss some of the challenges involved in vicinity sniffing. It is through discussion of these challenges and how they relate to highly congested networks that we can gain better understanding of the effect on data analysis. The challenges are the following: Sniffer Location: The placement of sniffers in the network affects what data is captured. To maximize data collection in congested networks, it is helpful to have a priori information about the AP locations and their expected activity. Since the plenary session was held in a single large room, we decided to co-locate the three sniffers (on the three different channels) at a single point based on our knowledge of the AP topology and our aim of capturing critical and comprehensive sets of network information. Analysis in Section 3 indicates that traffic sent and received by the 10 most active APs in our data set contributed over 90% of the 9 million data frames. Uncaptured Frames: Our experience is that in large-scale wireless networks, sniffers are unable to record all frames due to either congestion in the network resulting in garbled frames, or the hardware limitations in capturing all frames from a high volume of frames. The accurate determination of the cause of an uncaptured frame from either of the two causes is a non-trivial problem. However, computing the total number of uncaptured frames can be utilized to determine the accuracy of the analysis presented in this paper. If the number of uncaptured frames is large, the analysis of network performance is inaccurate. In the next section we describe a method to estimate the total number of uncaptured data frames from each of the ten most active APs in the network. We believe that the estimates set a lower bound on the total uncaptured frame percentage. The total number of uncaptured management and control frames adds to the uncaptured frame percentage. Investigating the impact of uncaptured frames on our results is part of our future work. However, based on the calculation of the total number of uncaptured data frames, we believe that uncaptured frames do not significantly alter our results.
3. ESTIMATING CONGESTION The operation and behavior of large-scale congested wireless networks is significantly different from small-scale networks or controlled experiments. Consequently, we believe that behavioral patterns in networks cannot be extrapolated by using results from small-scale network measurements. Therefore, to fully understand behavioral patterns in congested environments it is important to first observe and then estimate congestion in wireless networks.
5
14
5 Channel 1 3
19:50
20:20
20:50
21:20
21:50
22:20
5 Channel 6 3
1 0 19:20
Channel 1 Channel 6 Channel 11
12
19:50
20:20
20:50
21:20
21:50
22:20
Number of Data Packets
Throughput in Mbps
1 0 19:20
x 10
10 8 6 4
5 Channel 11 3 1 0 19:20
2
19:50
20:20
20:50 Time of Day
21:20
21:50
22:20
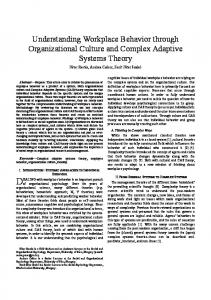
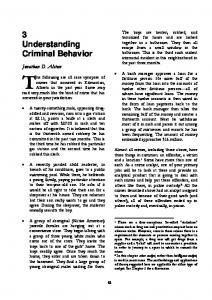
Figure 1: Throughput per channel averaged over 30-second intervals. This section describes various properties of a wireless network that are significant in estimating and evaluating congestion. Specifically, we discuss throughput of the IETF network over time, perAP frame reception and transmission, frame losses, and point-topoint link reliability between our sniffers and an AP. We then discuss the possibility of utilizing link reliability as a metric to estimate congestion and the use of congestion estimates to evaluate the properties of the MAC protocol. Throughput: To estimate congestion, we analyze the average throughput of the network during the entire plenary session. Figure 1 shows the throughput of the wireless network on channels 1, 6, and 11. Each point in the graph represents an average throughput over a 30-second interval. As users move into the meeting room between 19:30 hrs and 19:50 hrs there is an increase in throughput, for instance, from 1 Mbps to 3.7 Mbps on channel 6. As users leave the meeting room after 21:50 hrs, we observe a decline in throughput. At other times, the throughput of the network varied between 2 Mbps and 5.5 Mbps and peaked at 5.5 Mbps at 21:05 hrs on channel 6. This value is close to the optimum throughput that can be achieved over IEEE 802.11b-based wireless networks [6]. Access Point Activity: Figure 2 is a stacked bar graph that shows the number of frames transmitted and received by the 40 most active APs out of the 112 APs in the network, as recorded in our data set. The APs have been ranked in the order of the total number of frames sent and received by the AP. The data is broken down by channels. Figure 2 shows that the APs ranked 1 to 10 were the most active APs in the network, contributing to frame counts ranging from 1.37 million frames for AP1 to 370,816 frames for AP10. The total number of frames transmitted and received by these ten APs constitutes approximately 90% of the total 9 million data frames in our data set. These frame counts, along with the throughput observations during the plenary session, clearly show that there was concentrated utilization and congestion. Table 1 shows the number of data frames sent and received by each of the ten most active APs on each channel. While the total traffic for each channel is relatively well balanced, the balance of traffic for each AP is not. For instance, AP4 had an almost equal distribution of traffic between the three channels, while AP9 operated mainly on channels 1 and 6. This distribution occurs because of the load-balancing algorithms employed on each AP that results in the AP dynamically changing channels to balance user load among all APs.
0 0
5
10
15
20 25 Rank of AP
30
35
40
Figure 2: Observed data traffic on the 40 most active APs. Having observed the high throughput and heavy per-AP activity in the network during the plenary session, we now discuss the number of frames that the sniffers could not capture either due to congestion or due to the hardware inability to handle a large volume of successive frames. Uncaptured Frames: In Section 2 we discussed the two challenges in detecting uncaptured frames in congested networks. To calculate the number of frames uncaptured by the sniffers, we leverage the DATA-ACK frame arrival atomicity of the IEEE 802.11 Distributed Coordination Function (DCF) standard. The atomicity policy states that if a DATA frame is successfully received by a device in a network, that device should send an ACK after a Short Inter-Frame Space (SIFS). No other device in the reception range is allowed to transmit frames during this interval. In other words, when an ACK frame occurs in our traffic logs, we expect a DATA frame to precede it. The source of the DATA frame should be the receiver of the ACK. If this DATA frame is missing from our data set, it is assumed that the sniffer was unable to capture it. Table 1 shows the number of data frames received, acknowledged, and uncaptured during the period of the plenary using this method of calculation. The following equation is used to calculate the percentage of frames that our collection framework failed to capture, the Uncaptured Percentage of frames. U ncapt %age =
U ncapt DAT A × 100 (1) U ncapt DAT A + Captured DAT A
Using Equation 1 we calculate an uncaptured percentage range of 0.15 to 0.75% percent per AP for the 10 most active APs, as shown in Table 1. Table 1 also shows the number of ACKed DATA frames for each of the 10 most active APs. An ACKed DATA frame is a DATA frame for which an ACK frame was sent by the receiver of the DATA frame immediately following the transmission of the DATA frame. Uncaptured ACK frames cause a reduction in the number of ACKed frames computed for each AP. However, based on the results presented in Table 1, we believe that the computed uncaptured frame percentage, and the number of uncaptured ACK frames, if computed, will not significantly alter the analysis presented in this paper. Based on the number of data frames sent and received, and the uncaptured frame percentage computations, we choose to utilize the AP with the second-most traffic for further analysis. This AP offers the best balance of received and sent traffic (1,139,311 data frames) and a low number of estimated uncaptured frames (2131 data frames).
AP Rank 1 2 3 4 5 6 7 8 9 10 Total
Number of Captured DATA Frames Ch 1 Ch 6 Ch 11 Total 236,532 286,593 843,174 1,366,299 253,306 650,619 235,386 1,139,311 416,992 316,339 232,642 924,049 290,639 341,938 291,472 883,679 509,916 140,598 233,165 966,033 286,805 133,683 260,045 680,533 68,902 30,900 569,333 669,135 330,867 273,511 22,121 626,499 267,238 293,939 6,592 567,769 101,586 190,622 78,608 370,816 2,762,783 2,658,802 2,772,538 8,194,123
ACKed DATA Frames
Uncaptured DATA Frames
Uncaptured Percentage
546,424 410,077 339,990 300,013 336,465 277,273 228,578 252,806 200,544 72,756 2,964,926
7,609 2,131 2,955 1,824 2,616 1,705 5,009 1,845 2,495 569 28,758
0.55 0.18 0.31 0.21 0.27 0.25 0.75 0.29 0.44 0.15 0.35
Beacon Capture Reliability (Percentage)
Table 1: Estimated number of uncaptured frames from the 10 most active APs.
Channel 1 Channel 6 Channel 11
Level for 100% Link Reliability 100
80
60
40
20
0 19:20
19:50
20:20
20:50 21:20 Time of Day
21:50
22:20
Figure 3: Link reliability between the sniffers and AP2 (averaged over 30-second intervals). Link Reliability: To quantify link quality or link reliability between our sniffer and an AP, we make use of the periodic transmission of beacon management frames from the AP. The beacon frames are 88 bytes and are broadcast frames sent at 100 millisecond intervals. In an ideal environment, the sniffer should receive 10 beacons per second. In the worst case, an extremely congested environment may cause all of the beacons to be lost. Thus, an AP’s link reliability can be measured on a percentage scale from 0% to 100%. 0% link reliability denotes that no frames were received and hence the link is determined to be extremely unreliable or broken. On the other hand, 100% link reliability means that all 10 frames were received and hence the link is very reliable. Beacon frames are transmitted by each AP every 100 milliseconds. Therefore, the reception of beacons from an AP is a constant measure of the reliability of the link between the sniffer and the AP. Moreover, this technique can be extended to measure link reliability between any client device in the network and any AP in the network in the client’s vicinity. The link reliability percentage between a client-AP pair is a direct measure of congestion on the link between the client-AP pair. Section 4 shows how link reliability percentage can be used to extrapolate the effect of congestion on frame retransmissions, data frame sizes, and multirate adaptation for a link between a client-AP pair. One drawback to this approach is that the use of 88-byte beacon frame receptions as a measure of link reliability is not a good indicator of whether large data frames can be successfully received. As shown in the next section, larger data frames have a higher probability of being dropped than shorter frames. Nevertheless, the re-
ception measure of beacon frames from an AP determines a bestcase estimate on the condition of a link. If a device fails to receive short beacon frames, our hypothesis is that it will miss large data frames with greater probability. In this paper, we do not consider the possibility of uncaptured beacon frames due to limiting hardware capabilities (as we did previously for uncaptured data frames). Beacon frames neither carry sequence numbers and nor do they follow an atomicity policy (as in the case of data and acknowledgment frames). Thus, estimating the number of uncaptured beacon frames is a non-trivial problem and needs future investigation. However, based on the uncaptured frame percentage values for large DATA frames shown in Table 1, we believe that the loss of short beacon frames will be comparatively smaller. Therefore, the number of uncaptured beacons will not alter our results significantly. Figure 3 is a time-series plot of the reliability of the link between our sniffers and AP2 over all three channels. For the sake of visual clarity, each point on this graph represents an average link reliability measure over a 30-second interval. Each point denotes the reliability of the link. The reliability of the point-to-point link is inversely related to the congestion in the network. For instance, at 21:05 hrs, the link reliability is 95%, which means that on an average 9.5 out of 10 beacon frames were received per second. Thus, we can say that at 21:05 hrs the link between the sniffer and AP2 was reliable and the network was relatively devoid of congestion. The circled region represents a 40-minute time span between 20:45 hrs and 21:25 hrs during which the AP operated on channel 6. At approximately 21:10 hrs we observe a significant drop in the reliability of the link, i.e. from 95% to about 80%. At one point the instantaneous reliability drops to 55%. This event signifies a sharp increase in the congestion level of the network. In the next section, we evaluate the effects of link reliability and congestion on frame retransmissions, frame sizes and data rates by focusing on the time represented by the circled region.
4. EFFECT OF CONGESTION As stated earlier, congestion is inversely proportional to the pointto-point link reliability. Our hypothesis is that any variation in frame retransmissions, frame sizes, and multirate adaptation is a result of the link reliability measure shown in Figure 3. In this section, we discuss the variations of these network properties during the period of time represented by the circled region in Figure 3. Frame Retransmissions: Data frames are retransmitted by the IEEE 802.11 MAC layer when the sender does not receive an acknowledgment within a short time period after the transmission of a DATA frame. As the number of data frames in the wireless network increases, the congestion level increases, link reliability decreases (i.e., more beacon frames are lost during transmission), and thus the probability of lost frames during transmission increases. Figure 4 is a time-series plot that shows the number of data frames transmitted and retransmitted, both to and from AP2 on channel 6.
300 Total DATA frames Retransmitted DATA frames
Successful DATA frames Dropped DATA frames 11
Data Rates (in Mbps)
Number of Frames
250
200
150
100
50
5.5
2 1
0 19:20
19:50
20:20
20:50 21:20 Time of Day
21:50
22:20
Figure 4: Number of data frames transmitted and received by AP2. Successful DATA frames Dropped DATA frames
Frame Sizes (in Bytes)
1600 1400 1200 1000 800 600 400 200 0 19:20
19:50
20:20
20:50 21:20 Time of Day
21:50
22:20
Figure 5: Average data frame size for frames transmitted and received by AP2. Within the circled region in Figure 4, we observe an increase in the number of frames transmitted and received by AP2. This value peaks at 250 frames/second at 21:05 hrs. This is the same time during which link reliability falls (from 95% to 85%) due to the increased congestion in the network. At 21:10 hrs, the link reliability drops to 55%. This means that 45% of the transmitted beacons were dropped. If a large number of short beacon frames are dropped due to congestion, the drop rate will be much worse for larger data frames. Consequently, we observe a surge in the number of retransmitted data frames in the circled region in Figure 4. Therefore, the number of retransmissions in the network can be correlated with the link reliability metric. Our hypothesis is that the relationship between link reliability and frame retransmissions can be effectively utilized to predict, measure, and control frame transmissions and retransmissions in a congested wireless network. As part of our future work, we plan to investigate the utility of this relationship in curtailing congestion and improving throughput in wireless networks. Frame Sizes: Theoretically, as the MAC frame size increases, so does the probability of frame corruption due to a higher possibility of frame or bit errors. We expect this effect to be more pronounced
19:20
19:50
20:20
20:50 21:20 Time of Day
21:50
22:20
Figure 6: Average rates for data frames transmitted and received by AP2. in highly congested environments. Figure 5 shows the average frame sizes for successfully received and dropped data frames for AP2 on channel 6. Successfully received frames are data frames for which we received an acknowledgment from the intended receiver of the data frame immediately following the transmission of the data frame, while dropped data frames are frames for which we did not. The values are averaged over 30-second intervals. The circled region in the figure highlights the time interval during which the link reliability metric decreases due to congestion in the network. During any time instant, a frame has a possibility of both reception and loss. At times when the link reliability metric is 90%, for instance, at 20:20 hrs, the average size of frames that are successfully received lies between 200 to 800 bytes. Once the reliability metric drops to 55% at 21:20 hrs, the possibility of data frame loss increases and so the proportion of successfully received data frames decreases. In the circled region of Figure 5, we observe that the average frame size for dropped frames increases to about 1100 bytes, while the average frame size for successful frames is about 200 bytes. This result shows that larger frames are dropped due to congestion and the majority of successfully received data frames are short (i.e. about 200 bytes). This does not imply that longer frames cannot be received, only that the probability decreases such that the average frame size becomes 200 bytes. From the above observations, we believe that link reliability can be effectively used to estimate the size of MAC frames that can be successfully supported by the medium. The implication is that if link reliability is used to estimate congestion levels in the network, the sender can adapt to these levels and choose frame sizes that are likely to be successfully received by the receiver of the data frame. Multirate Adaptation: The IEEE 802.11b MAC protocol allows data frames to be sent at four different rates, 1, 2, 5.5, and 11 Mbps. The IEEE 802.11 PHY protocol suggests that modulation schemes, such as QPSK with Complimentary Code Keying, that are used for higher data rates (11 Mbps), can only tolerate lower bit error rates (BER), while modulation schemes, such as BPSK (used for the 1 Mbps rate) or QPSK (for the 2 Mbps rate), can conceal higher BERs in received frames. BER concealment depends on the number of bits per symbols transmitted at different rates, e.g. 1 bit for 1 Mbps, 2 bits for 2 Mbps, 4 bits for 5.5 Mbps, and 8 bits for 11 Mbps. Following this theory, an increase in the number of frame errors encourages the use of lower data rates. Inversely, as the number of successfully received frames increase, the data rates increase.
Data Rate 1 2 5.5 11
Ch 1 S D 9087 7870 4851 8757 8221 16664 74932 122205
Ch 6 S D 24782 24909 11838 33097 16297 47337 173513 317808
Ch 11 S D 9472 6712 4644 8370 6769 15596 65665 117771
Table 2: Data rates vs. data frames successfully (S) received and dropped (D) to and from AP2 during the plenary session. This increase and decrease in data rates is called Multirate Adaptation. The implementation of multirate adaptation algorithms is proprietary to the manufacturers of the wireless cards. Figure 6 shows the average data rate for successfully received and dropped data frames by AP2 on channel 6. Successfully received and dropped frames are frames for which an ACK frame occurs or does not occur immediately following the DATA frame, respectively. Table 2 shows the number of data frames successfully received and dropped at different rates on channels 1, 6, and 11. Each point on the graph is the average computed for all data frames over a 30-second interval. In Figure 6, the circled region denotes the time interval during which the reliability of the link between the sniffer and AP2 decreases due to increased congestion. We see that as the link reliability decreases, there is a reduction in the average data rate of both successfully received frames and dropped frames. Table 2 shows that the number of data frames dropped is significantly larger than the number of successful data frames. This difference is even more noticeable at 5.5 and 11 Mbps rates. Further, we see that the number of successfully received frames at 1 Mbps (24782 on channel 6) is more than those for each of the 2 and 5.5 Mbps rates (11838 and 16297, respectively). Our observation is that during congestion data frames sent at lower rates (1 or 2 Mbps) are more likely to be successfully received, whereas data frames sent at higher data rates are less likely to be successful. This argument clearly explains the significant decline in the average data rates to about 5.4 Mbps for successfully received data frames when link reliability reduces to 55%. To improve the reliability of transmission in congested environments, multirate adaptation algorithms suggest a decrease in data rates. However, a reduction in the sending rate causes the number of symbols transmitted per frame to increase. An increase in the number of symbols results in the frame spending more time on the medium than the time it would have spent had the frame been sent at a higher rate. The increase in per-frame channel occupancy time causes the congestion in the network to further increase and the overall throughput to decrease. Our hypothesis is that if point-to-point link reliability between a client device and an AP is known to decrease, the client should instead continue to use high data rates while reducing the number of frames transmitted per second in the network. The use of higher data rates will help maintain the overall throughput of the network, while the reduction in the number frames transmitted by each user will reduce the probability of frame errors caused due to collisions between frames. In this section we have examined the close coupling of congestion and point-to-point link reliability with the behavior of a wireless network. In particular, we have investigated the behavior of frame retransmissions, frame sizes and data rates during wireless network congestion. We have also shown that short data frames sent at lower data rates have a greater possibility of successful reception than longer frames sent at high data rates. We believe that if reliability information is available, the MAC layer at the client and at the APs can be optimized to improve the performance of the network as a whole.
5. CONCLUSIONS In this paper we have motivated the need to analyze the wireless portion of large-scale congested networks. We have shown the importance of understanding variations in link-layer properties in congested environments because it is the link-layer that is largely responsible for performance bottlenecks. We have discussed our experience in analyzing an active large network and we have shown how the reliability of a link between a client and an AP can be used to characterize the congestion in the network. We have also explained the effects of congestion on metrics such as retransmissions, data rates and frame sizes. By fully understanding congested wireless networks, it will be possible to design optimized wireless networks in which clients and APs collaborate in order to improve the throughput of the network as a whole. Some ideas for optimization have also been introduced in this paper, and their detailed investigation is part of our future work.
6. ACKNOWLEDGMENTS Funding for this work is in part through NSF Network Research Testbeds grant CNS–0335302 and a grant from Nokia Research through the UC Micro program. We would like to thank Jim Martin (Netzwert AG), Karen O’Donoghue (Naval Surface Warfare Center), Bill Jensen (University of Wisconsin), Jesse Lindeman (Airespace), and the IETF62 NOC Team for assisting us in the collection of the data used in this paper.
7. REFERENCES [1] D. Aguayo, J. Bicket, S. Biswas, G. Judd, and R. Morris. Link-level Measurements from an 802.11b Mesh Network. In Proceedings of ACM SIGCOMM, Portland, OR, August 2004. [2] A. Balachandran, G. M. Voelker, P. Bahl, and P. V. Rangan. Characterizing User Behavior and Network Performance in a Public Wireless LAN. In Proceedings of ACM SIGMETRICS, pages 195–205, Marina Del Rey, CA, June 2002. [3] M. Balazinska and P. Castro. Characterizing Mobility and Network Usage in a Corporate Wireless Local-area Network. In Proceedings of ACM MOBICOM, San Francisco, CA, May 2003. [4] F. Chinchilla, M. Lindsey, and M. Papadopouli. Analysis of Wireless Information Locality and Association Patterns in a Campus. In Proceedings of IEEE INFOCOM, Hong Kong, March 2004. [5] T. Henderson, D. Kotz, and I. Abyzov. The Changing Use of a Mature Campus-wide Wireless Network. In Proceedings of ACM MOBICOM, Philadelphia, PA, September 2004. [6] J. Jun, P. Peddabachagari, and M. Sichitiu. Theoretical Maximum Throughput of IEEE 802.11 and its Applications. In Proceedings of the IEEE International Symposium on Network Computing and Applications, pages 249–257, Cambridge, MA, April 2003. [7] D. Kotz and K. Essien. Analysis of a Campus-wide Wireless Network. In Proceedings of ACM MOBICOM, Atlanta, GA, September 2002. [8] X. Meng, S. Wong, Y. Yuan, and S. Lu. Characterizing Flows in Large Wireless Data Networks. In Proceedings of ACM MOBICOM, Philadelphia, PA, September 2004. [9] A. Mishra, M. Shin, and W. A. Arbaugh. An Empirical Analysis of the IEEE 802.11 MAC Layer Handoff Process. ACM SIGCOMM Computer Communication Review, 33(2):93–102, 2003. [10] D. Schwab and R. Bunt. Characterizing the Use of a Campus Wireless Network. In Proceedings of IEEE INFOCOM, Hong Kong, March 2004. [11] C. Tuduce and T. Gross. A Mobility Model Based on WLAN Traces and its Validation. In Proceedings of IEEE INFOCOM, Miami, FL, March 2005. [12] J. Yeo, M. Youssef, and A. Agrawala. A Framework for Wireless LAN Monitoring and its Applications. In Proceedings of the ACM Workshop on Wireless Security, pages 70–79, Philadelphia, PA, October 2004.