Orientador: Antonio Alfredo Ferreira Loureiro ... Antonio Loureiro e ao prof. Pedro Vaz de Melo ..... et al., 2010; Lu and Cao, 2003; Terroso-Sáenz et al., 2012).
UNDERSTANDING MOBILITY TO IMPROVE D2D COMMUNICATION
IVAN DE OLIVEIRA NUNES
UNDERSTANDING MOBILITY TO IMPROVE D2D COMMUNICATION Dissertação apresentada ao Programa de Pós-Graduação em Computer Science do Instituto de Ciências Exatas da Federal University of Minas Gerais como requisito parcial para a obtenção do grau de Mestre em Computer Science.
Orientador: Antonio Alfredo Ferreira Loureiro Co-Advisor: Pedro Olmo Stancioli Vaz de Melo
Belo Horizonte Agosto de 2016
IVAN DE OLIVEIRA NUNES
UNDERSTANDING MOBILITY TO IMPROVE D2D COMMUNICATION Dissertation presented to the Graduate Program in Computer Science of the Federal University of Minas Gerais in partial fulfillment of the requirements for the degree of Master in Computer Science.
Advisor: Antonio Alfredo Ferreira Loureiro Co-Advisor: Pedro Olmo Stancioli Vaz de Melo
Belo Horizonte August 2016
© 2016, Ivan de Oliveira Nunes. Todos os direitos reservados
Ficha catalográfica elaborada pela Biblioteca do ICEx - UFMG
Nunes, Ivan de Oliveira. N972u
Understanding mobility to improve D2D communication. / Ivan de Oliveira Nunes. – Belo Horizonte, 2016. xv, 87- f.: il.; 29 cm. Dissertação ( mestrado) - Universidade Federal de Minas Gerais – Departamento de Ciência da Computação. Orientador: Antônio Alfredo Ferreira Loureiro. Coorientador: Pedro Olmo Stancioli Vaz de Melo. 1. Computação - Teses. 2. Device-to-device. 3. Redes de computadores 4. Computação móvel. 5. Redes sociais online. I. Orientador. II. Coorientador. III. Título.
CDU 519.6*22(043)
Agradecimentos Meu caminho até aqui foi iluminado por uma série de pessoas especiais que tornaram essa jornada muito mais fácil e agradável de ser trilhada. Agradeço a Deus por ter me dado condição de seguir este caminho e por ter colocado nele as pessoas que cito nesses agradecimentos. Agradeço aos meus pais, João e Angélica e ao meu irmão Igor, por me darem amor incondicional e assistência em todos os momentos de dificuldade. À Renata, por estar sempre ao meu lado, por me dar amor e carinho e compartilhar comigo todas as alegrias e frustrações. A todos os familiares que mesmo distântes se fazem presentes em minha vida. Especialmente meus avós tios e primos. A todos os professores pelas valiosas lições dadas dentro e fora de sala. Agradeço especialmente ao prof. Antonio Loureiro e ao prof. Pedro Vaz de Melo pela orientação, pelas mais diversas lições e pela amizade contruída nesse processo. Agradeço também aos professores Magnos Martinello e Roberta Gomes, por me introduzirem ao mundo da pesquisa, ainda na graduação, e por me apoiarem até hoje. Aos colegas do laboratório Wisemap pela amizade, pela colaboração, pelas valiosas discussões e por fazerem o café. Agradeço especialmente a Clayson Celes e Igor de Oliveira Nunes, por participarem na autoria de parte deste trabalho. Aos amigos de infância e do intercâmbio, por tantos os momentos prazerosos, divertidos e revitalizantes. Aos colegas da turma 09: a melhor turma de Engenharia de Computação que já existiu. Enfim, a todos que de alguma forma me ajudaram a chegar até aqui. Muito obrigado! “Já dizia minha avó, antes mal acompanhada do que só!”
ix
Abstract Device-to-Device (D2D) communication is already considered a fundamental technology for the next generation mobile networks. This new type of communication enables the offloading of the base station download demands by directly transmitting the content when devices are sufficiently near to each other. In this work, we analyze the role of different human mobility features to improve the cost-effectiveness of opportunistic forwarding in multi-hop D2D communication networks. We propose two algorithms, SAMPLER, which combines individuals’ mobility patterns, points of interest, and social awareness, and GROUPS-NET, which employs the knowledge about the regularity of group mobility as a measure of social context, instead of detecting communities. The proposed algorithms use different strategies and were validated in real-world scenarios using publicly available data sources. Both algorithms achieved better cost-effectiveness in multi-hop D2D forwarding when compared to the state-ofart solution. In addition to these protocols, we also have proposed a group detection and tracking methodology and a novel mobility model, GRM, which accounts for the role of group meetings regularity in human mobility.
xi
Contents Agradecimentos
ix
Abstract
xi
1 Introduction
1
1.1
Overview . . . . . . . . . . . . . . . . . . . . . . . . . . . . . . . . . . .
1
1.2
Building Blocks and Related Work . . . . . . . . . . . . . . . . . . . .
5
1.2.1
Human Mobility . . . . . . . . . . . . . . . . . . . . . . . . . .
5
1.2.2
Communities Detection and Characterization . . . . . . . . . .
6
1.2.3
Opportunistic Forwarding in D2D Networks . . . . . . . . . . .
7
1.2.4
Mobility Modeling . . . . . . . . . . . . . . . . . . . . . . . . .
9
2 Group Mobility: Detection, Tracking and Characterization
13
2.1
Chapter Overview . . . . . . . . . . . . . . . . . . . . . . . . . . . . . .
13
2.2
Social Groups Identification and Tracking
. . . . . . . . . . . . . . . .
14
2.2.1
Modeling the Evolution of Proximity Traces With Graphs . . .
14
2.2.2
Telling Apart Social and Random Contacts to Create Social Graphs 15
2.2.3
Data Set Characterization . . . . . . . . . . . . . . . . . . . . .
16
2.2.4
Group Detection . . . . . . . . . . . . . . . . . . . . . . . . . .
17
2.2.5
Group Tracking . . . . . . . . . . . . . . . . . . . . . . . . . . .
19
Characterization of Group Dynamics . . . . . . . . . . . . . . . . . . .
20
2.3.1
Metrics
. . . . . . . . . . . . . . . . . . . . . . . . . . . . . . .
20
2.3.2
Results . . . . . . . . . . . . . . . . . . . . . . . . . . . . . . . .
22
2.4
A Discussion on Group Detection Application . . . . . . . . . . . . . .
24
2.5
Final Remarks . . . . . . . . . . . . . . . . . . . . . . . . . . . . . . . .
26
2.3
3 GROUPS-NET
27
3.1
Chapter Overview . . . . . . . . . . . . . . . . . . . . . . . . . . . . . .
27
3.2
Group Meetings Detection and Tracking . . . . . . . . . . . . . . . . .
29
xiii
3.3
Social Group Meetings Properties . . . . . . . . . . . . . . . . . . . . .
29
3.4
GROUPS-NET: Group Meetings Aware Routing . . . . . . . . . . . . .
31
3.5
Synthetic vs Real World Mobility . . . . . . . . . . . . . . . . . . . . .
36
3.6
Comparative Analysis
. . . . . . . . . . . . . . . . . . . . . . . . . . .
39
3.6.1
Bubble Rap Algorithm . . . . . . . . . . . . . . . . . . . . . . .
39
3.6.2
Performance Evaluation . . . . . . . . . . . . . . . . . . . . . .
40
3.6.3
Discussion . . . . . . . . . . . . . . . . . . . . . . . . . . . . . .
43
Final Remarks . . . . . . . . . . . . . . . . . . . . . . . . . . . . . . . .
44
3.7
4 SAMPLER: Combining Spatial and Social Awareness
47
4.1
Chapter Overview . . . . . . . . . . . . . . . . . . . . . . . . . . . . . .
47
4.2
NCCU Trace . . . . . . . . . . . . . . . . . . . . . . . . . . . . . . . .
48
4.3
SAMPLER Features . . . . . . . . . . . . . . . . . . . . . . . . . . . .
49
4.3.1
Social Awareness as Popularity . . . . . . . . . . . . . . . . . .
49
4.3.2
Social Communities . . . . . . . . . . . . . . . . . . . . . . . . .
51
4.3.3
Users’ Individual Mobility . . . . . . . . . . . . . . . . . . . . .
51
4.3.4
Points of Interest . . . . . . . . . . . . . . . . . . . . . . . . . .
52
Combining Features Toward Cost-Effective Forwarding . . . . . . . . .
53
4.4.1
SAMPLER . . . . . . . . . . . . . . . . . . . . . . . . . . . . .
54
Results . . . . . . . . . . . . . . . . . . . . . . . . . . . . . . . . . . . .
56
4.5.1
Experimental methodology . . . . . . . . . . . . . . . . . . . . .
56
4.5.2
Performance Evaluation . . . . . . . . . . . . . . . . . . . . . .
58
4.5.3
Discussion . . . . . . . . . . . . . . . . . . . . . . . . . . . . . .
58
Final Remarks . . . . . . . . . . . . . . . . . . . . . . . . . . . . . . . .
59
4.4 4.5
4.6
5 GRM: Group Regularity Mobility Model
61
5.1
Chapter Overview . . . . . . . . . . . . . . . . . . . . . . . . . . . . . .
61
5.2
Group Mobility: Real World vs Synthetic Models . . . . . . . . . . . .
63
5.3
The GRM Model . . . . . . . . . . . . . . . . . . . . . . . . . . . . . .
66
5.3.1
Group Meeting Times . . . . . . . . . . . . . . . . . . . . . . .
68
5.3.2
Group Meetings Durations . . . . . . . . . . . . . . . . . . . . .
70
5.3.3
Groups’ Structure and Social Context . . . . . . . . . . . . . . .
70
5.3.4
Mobility and Meeting Places . . . . . . . . . . . . . . . . . . . .
72
5.4
Evaluation . . . . . . . . . . . . . . . . . . . . . . . . . . . . . . . . . .
73
5.5
Opportunistic Forwarding in GRM . . . . . . . . . . . . . . . . . . . .
73
5.6
Final Remarks . . . . . . . . . . . . . . . . . . . . . . . . . . . . . . . .
77
6 Conclusion
79 xiv
Bibliography
81
xv
Chapter 1 Introduction 1.1
Overview
In recent years, high data rate applications such as videos, songs, games, and social media have become increasingly popular to users in cellular networks. Device-to-Device (D2D) communication has been proposed to facilitate high data rate transmissions among nearby users offering higher throughput, efficient spectral usage, extended network coverage, and improved energy efficiency. D2D refers to the direct transmission of content between devices without the need of sending all data through the base station, as in traditional cellular networks. The D2D transmission can be classified into two basic types: 1-hop transmission, in which a message goes directly from the source to the destination if both are close enough to each other; and multi-hop transmission, where the message must be opportunistically routed, device-by-device, from the source to the destination. This last solution is more complex, since it depends on the intermittent communication structure of a mobile network and is suited for communication in which a greater delivery time might be tolerated. This concept was firstly introduced in the context of Delay Tolerant Networks (DTNs), but it has many applications to D2D networks as discussed by Li et al. (2014). For example, opportunistic forwarding algorithms can be used to deliver contents such as video advertisements and non-critical updates of applications. In such cases, timely delivery is not strictly essential and the multi-hop D2D communication can act as a bandwidth offload for the download demands of the base stations. As discussed by Laya et al. (2014), the support for D2D communications affects the data and control planes of the current cellular network as follows: 1
2
Chapter 1. Introduction
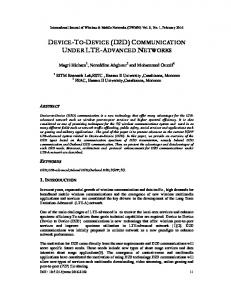
(a) Traditional centralized archi- (b) Distributed ad-hoc architectecture ture
(c) Hybrid D2D architecture
Figure 1.1. Possible architectures for mobile and cellular networks
• Data plane: D2D supports opportunistically routed messages, creating a new data path that significantly reduces the download demand from the base station. • Control plane: Signaling to control the forwarding policies can be achieved in two ways: from device-to-device or in a centralized way. In the latter case, control messages come directly from the base station, but the content data is forwarded from device-to-device. The combination of both control signaling policies is also possible. Figure 1.1 illustrates the types of possible architectures for data and control planes. In contrast with the purely centralized and the purely ad-hoc networks, illustrated in Figures 1.1(a) and 1.1(b), respectively, the new generation of cellular communication supports a centralized control plane and a distributed data plane, which together allow to lessen the base station workload with D2D data transmissions. The possibility of a centralized control plane, offered in D2D communication, is a fundamental difference from D2D to the traditional DTNs, in which forwarding algorithms must be completely distributed as in Figure 1.1(b). Forwarding algorithms in multi-hop D2D networks aim to achieve cost-effective delivery, i.e., the highest possible delivery ratio with the lowest possible network overhead. In this case, the delivery ratio is measured as the percentage of opportunistically routed messages successfully delivered to their destinations. Successfully delivered messages are those which the base station will not need to deliver itself, thus using less
1.1. Overview
3
bandwidth. The network overhead is measured by the average number of times the content needs to be D2D-transmitted for the message to get to its destination. A high number of transmissions may negatively impact the users’ experience by, for example, increasing devices’ energy expenditure. Considering these metrics, the most successful strategy for opportunistic costeffective forwarding, Bubble Rap (Hui et al., 2011), relies on information about static social communities and nodes’ centrality. The use of Bubble Rap in D2D Networks is proposed in (Li et al., 2014). However, detecting communities in a D2D scenario is a complex and expensive task. With that in mind, as one of the contributions of this work, we introduce GROUPS-NET (Group Routing in Pocket Switched-Networks), a D2D parameter-free forwarding algorithm that considers the dynamic social structure of the D2D communication without the need to detect communities. GROUPS-NET works by looking at social group meetings instead of social communities, i.e., it uses group mobility awareness as an alternative measure for social context. According to our experiments, GROUPS-NET outperforms Bubble Rap in terms of cost-effective content delivery in large-scale scenarios. We also have noticed that the existent social aware forwarding algorithms do not consider any geographic feature of the individuals’ mobility patterns nor the properties of the scenario in question, such as its Points of Interest (PoI). The recently released NCCU trace (Tsai and Chan, 2015) brings an unprecedented opportunity to investigate this open issue, since it is the first available real-world dataset to monitor not only users’ proximity contacts but also their geo-locations. In the literature, there are other real and synthetic traces, but none of them presents all these properties. In other words, based on the characterization of the NCCU trace we can get insights to design real-world protocols that take advantage and consider human mobility. With that in mind, we propose to combine spatial features and social awareness, recorded in the NCCU trace, with the goal of improving the cost-effectiveness of opportunistic forwarding. We describe two spatial and two social features and characterize them in the NCCU trace. As a proof of concept, we use such properties to design SAMPLER (Social-Aware, Mobility, and PoI Routing) that, to the best of our knowledge, is the first opportunistic routing strategy to combine mobility, PoIs, and social-awareness to provide cost-effective content delivery in intermittent connected networks. The explored properties of this strategy and the reasons for using each one of them are discussed in details. Specifically, SAMPLER works by forwarding messages to nodes of higher mobility, until the message reaches a static relay point. Static relay points are strategically deployed at the most popular PoIs and forward their received content to nodes that
4
Chapter 1. Introduction
belong to the social community whose destination node is also a member of this community. Within such community, the message is forwarded to the most popular nodes until it reaches the destination node. Our experiments show that by exploring the combination of spatial and social features, SAMPLER significantly increases the delivery ratio, reduces the network overhead, and enables faster delivery of messages, when compared to the state-of-the-art solution. These results reinforce our assumption that a better understanding of real mobility traces can provide valuable insights in the design of D2D routing. In addition to SAMPLER and GROUPS-NET, we have shown that the existent mobility models do not capture the regularity of human group meetings, which are present in real mobility traces. Next, we have characterized the statistical properties of such group meetings in real mobility traces and design the Group Regularity Mobility (GRM) Model accordingly. We show that GRM maintain typical characteristics of real traces such as contact-duration and inter-contact-times (ICT) probability distribution functions, while, in addition, accounting for the role of group mobility. Finally, we evaluate some of the state-of-the-art social-aware protocols for opportunistic routing using a synthetic contact trace generated by our model. The results show that the behavior of such protocols in our model is similar to their behavior in real mobility traces. In summary, we highlight the following main contributions of this work: • A methodology for detecting and tracking mobile groups from proximity traces and a characterization of such groups’ properties. Such part of this work is also available in (Nunes et al., 2016c). • GROUPS-NET, a group meetings aware algorithm for opportunistic forwarding in multi-hop D2D networks. GROUPS-NET does not need community detection and achieves better cost-effectiveness than the state-of-the-art solution, namely Bubble Rap. Such part of this work is also available in (Nunes et al., 2016b,d). • SAMPLER, an algorithm that combines spatial and social properties to leverage the cost-effectiveness of opportunistic message forwarding. SAMPLER is currently submitted for possible publication in (Nunes et al., 2016a). • GRM, a novel mobility model which is representative of real world mobility considering group mobility regularity, inter-contact time and contact duration distributions, social context, and human walks.
1.2. Building Blocks and Related Work
5
Throughout the rest of this chapter we introduce the main building blocks that were fundamental for providing the contributions listed above, pointing out the main related research efforts.
1.2 1.2.1
Building Blocks and Related Work Human Mobility
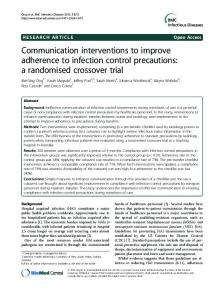
Some rules that govern human mobility have already been revealed. Studies have used diverse data sources to look into human mobility patterns in the perspective of both: individual behavior and collective dynamics. The work of Gonzalez et al. (2008) on individual human mobility has found that human trajectories show a high degree of temporal and spatial regularity. More recently, a dichotomy in individual mobility was revealed in (Song et al., 2010) and (Pappalardo et al., 2015a). Those studies suggest that two mobility profiles, called returners and explorers, govern people movements based on preferential returns and explorations of new places. In relation to collective dynamics, Candia et al. (2008) analyzed large-scale collective behavior from aggregated call detail records. Their work revealed that the spatio-temporal fluctuations of individuals in a city is highly dependent of activity patterns and routines. Yet, Isaacman et al. (2012) proposed an approach for modeling how people move in different metropolitan areas. All of the works above are concerned with identifying the intrinsic properties of human mobility in order to provide knowledge and models that capture underlying information for many applications such as: impact of large scale events in urban mobility (Calabrese et al., 2010), typical transitions between points of interest in a city (Silva et al., 2014), and characterization and prediction of traffic conditions (Bauza et al., 2010; Lu and Cao, 2003; Terroso-Sáenz et al., 2012). Some studies have investigated the importance of understanding the properties of human mobility for designing communication protocols based on opportunistic encounters among people (Chaintreau et al., 2007; Panisson et al., 2012; Sermpezis and Spyropoulos, 2015; Rao et al., 2015). These works explore pairwise contacts between users from the individual mobility perspective considering the following metrics: contact rate, inter-contact time, and contact duration. However, to the best of our knowledge, there is no such characterization related to group mobility and its applications to mobile networks, which is one of the contributions of this work. All the above-mentioned research efforts could be classified according to the taxonomy presented in the Figure 1.2. Indeed, throughout the rest of this work we explore
6
Chapter 1. Introduction
Figure 1.2. A taxonomy for human mobility properties. Pink boxes depict our categorization for mobility studies and purple boxes exemplify types of studies contemplated within such categories.
and combine the six classes of mobility features presented in the pink boxes of the Figure 1.2. In Chapter 2 we detect, track, and characterize group mobility, a social aspect of human mobility. In the GROUPS-NET algorithm, presented in Chapter 3, we combine the temporal and the social aspects of mobility by exploring the periodicity of group mobility to design a new forwarding strategy for D2D networks. Conversely, SAMPLER, presented in Chapter 4, combines points of interest, social context, and individual mobility patterns in its forwarding policy.
1.2.2
Communities Detection and Characterization
To perform group characterization from mobility traces’ analysis, we apply community detection methods. Since its introduction, community detection in complex networks have attracted a lot of attention. Algorithms for community detection can be classified according to two characteristics: overlapping versus non-overlapping, and static versus dynamic graphs. Among many proposed algorithms, the studies in (Palla et al., 2005) and (Gregory, 2010) have remarked themselves as the most popular and effective algorithms for community detection in static graphs. Studies such as (Nguyen et al., 2011a) aim to propose adaptations and new algorithms that are suited for dynamics graphs, considering computational efficiency issues. In our study, we use these developed methodologies, specifically Clique Percolation (Palla et al., 2005), to detect and
1.2. Building Blocks and Related Work
7
characterize social groups dynamics looking at proximity traces. There are also studies that characterize community evolution in other kinds of complex networks. For instance, Palla et al. (Palla et al., 2007) analyzed the evolution of communities in scientific collaboration networks and in phone call networks. Hui et al. (2011) used community structure in mobility networks to design a very successful message forwarding protocol for Disruption Tolerant Networks (DTN), namely Bubble Rap. Our work in group mobility detection is fundamentally different from (Hui et al., 2011) because it aims to detect groups of people who are in fact together, in space and time, socially interacting. In (Hui et al., 2011), the authors build a single static graph, of the whole trace time, and detect static communities in this single graph. The use of a single aggregated graph prevents accounting for changes of social behavior in time, i.e., social dynamics. For example, students who meet regularly because they attend the same class in a given semester may not be attending a class together in the next semester. The methodology we propose is capable of accounting for these changes in behavior through the detection and tracking of social groups who are together in space and time, instead of social communities in aggregated graphs. In Chapter 2, we aim to characterize the evolution of social groups by looking at properties such as group sizes, group meeting durations, periodicity in group meetings, and dynamics of groups’ evolution. Finally, we discuss group mobility application, providing a case study and some early results for opportunistic mobile networking.
1.2.3
Opportunistic Forwarding in D2D Networks
The most successful approaches for multi-hop forwarding are the probabilistic and social-aware strategies (Mota et al., 2014). The use of a probabilistic approach was firstly introduced by Lindgren et al. (2003) in the PROPHET algorithm. The main idea of PROPHET is to assign a higher importance to pairwise node contacts that happened more recently in an attempt to predict future pair contacts. The PROPHET algorithm achieved great success, being years later outperformed by social-aware strategies. In this direction, Hui et al. (2011) used the social community structure, detected from contact graphs of mobile networks, combined with network nodes’ centrality, to propose a forwarding algorithm named Bubble Rap. Although there are other routing protocols that exploit the social information from contacts between people (Daly and Haahr, 2007; Mtibaa et al., 2010; Hossmann et al., 2010), to the best of our knowledge, until now Bubble Rap was the most cost-effective forwarding algorithm in terms of high delivery ratio and low network overhead. The use of Bubble Rap in D2D networks is proposed in (Li et al., 2014).
8
Chapter 1. Introduction
The problem with Bubble Rap and other social-aware strategies is the dependence on information about static social communities. This dependence is harmful in several ways. First, communities are computationally expensive to detect (Nguyen et al., 2011b). Second, they are hard to detect in a distributed way, since individual nodes will not have information about the contact graph of the whole network. Existent distributed community detection algorithms have at most 85% precision (Hui et al., 2007). Another problem of community detection algorithms is the parameter calibration. The most successful community detection algorithms depend on parameters that must be calibrated for each specific scenario (Peel, 2010). In a real-time application, such as D2D communication, such calibration is not feasible. In addition to these problems, there is no established truth for community detection. Abrahao et al. (2012) evaluated community detection schemes and showed that, for the same scenarios, different community detection algorithms led to very different results for communities’ compositions. Finally, static communities’ detection does not account for the dynamism in humans’ social relationships, i.e., how they change over time.
Aiming to address these issues, we propose to look at social group meetings, instead of detecting communities. A social group meeting is defined as a group of people who are together, in space and time, for some social reason or common goal. People in a bus, for example, are together because they share the same goal of getting to a given destination. Students in the classroom share the objective of learning the class’ subject content. Friends hanging out at a bar share the social motivation of being together to relax and talk to each other. All of these are examples of social group meetings. As human beings have regular schedules and routines, it is reasonable to expect group meetings to present some regularity and predictability as well.
From the implementation point of view, a device can detect a group meeting it belongs to by simply looking at the list of devices that remained nearby for more than a threshold time, for example, 10 minutes. This way, groups meetings can be easily detected in a distributed fashion. Moreover, the group meeting detection method does not change depending on the scenario nor requires parameters’ calibration for each specific network, as in community detection schemes. All of these favorable characteristics motivated the introduction of group meetings in the design of an opportunistic routing scheme that is better suited for D2D Networks than the current social-aware proposals.
1.2. Building Blocks and Related Work
1.2.4
9
Mobility Modeling
Mobility models (Treurniet, 2014) have fundamental importance for mobile networking. They enable the generation of synthetic trajectories for mobile nodes in simulated environments, which can then be used to evaluate the performance of newly designed networking protocols. The validation of such protocols in real world large scale experiments is often unfeasible due to the financial and operational limitations. In this sense, synthetic models enable the rapid evaluation of the performance of networking protocols considering long periods of protocols’ deployment time, and large number of network nodes. Group mobility is considered a fundamental building block for mobility modeling (Treurniet, 2014). However, the existent group mobility models (Aung et al., 2015) focus on modeling groups which remain together throughout the whole simulation time. On the other hand, mobility models that aim to model the regularity of human contact patterns (Ekman et al., 2008; Mei and Stefa, 2009; Lee et al., 2009) only consider pairwise contacts, ignoring the fact that human social contacts often happen in groups, involving more than two entities, as recently revealed in (Nunes et al., 2016c). The research studies on group mobility models are restricted to represent nodes that move together as clusters. For example, Reference Point Group Mobility (RPGM) (Hong et al., 1999) and Reference Velocity Group Mobility (RVGM) (Wang and Li, 2002) are variants of random models for group mobility. In both models, people are organized by groups in agreement with their logical relationships. Each group contains one leader and the members of a group move according to their leader. These mobility models are based on certain properties of movement, such as speed, direction, and acceleration and do not exhibit the typical contact properties of human mobility. Therefore, such models are not able to reproduce the mobility behavior and statistical properties of real-world mobility traces (Karamshuk et al., 2011). In recent years, some studies have focused on modeling human mobility using statistical properties (e.g., displacements distribution, frequency for visiting different locations) obtained from spatial and temporal regularity patterns. Lee et al. (2009) present a mobility model, called Self-similar Least Action Walk (SLAW), that captures the following features: truncated power-law distributions of flights, pause-times and inter-contact times, attractive force to more popular places, and heterogeneously defined areas of individual mobility. The model uses these features to represent the mobility of people who share common gathering places, i.e., places that most people visit during their daily lives. The Small World in Motion (SWIM) model (Mei and Stefa, 2009) is based on
10
Chapter 1. Introduction
the intuition that people go more often to nearby or popular places. The intuition behind SWIM is supported by Gonzalez et al. (2008) who reveal spatial and temporal regularity patterns in the movement. Specifically, each node receives a home location and assigns a probability to each possible destination according to the popularity of that location and the distance of such place to home. SLAW and SWIM are able to produce inter-contact time and contact duration distributions that follow the ones found in the well-known mobility traces. However, both models consider only pairwise contacts, ignoring group mobility or any relationships between more than two nodes. Musolesi and Mascolo (2007) proposed the community based mobility model (CMM) founded on social network theory. The model receives a social network as input and applies a community detection algorithm to this social network to determine the nodes’ movements according to the social ties between them. The intuition is that nodes go to places with higher social attraction. Boldrini and Passarella (2010) present the Home Cell Mobility Model (HCMM), an evolution of the CMM, based on the idea of social and location attractions. Similarly to SWIM, HCMM adopted the concept of home location and the nodes’ movements are subjected to their social relationships. Moreover, nodes go to few places more often and these places are not far from their homes. In these models, the community structure is forced into the nodes’ mobility to generate a social context. In our model, on the other hand, the community structure emerges naturally from both the regularity of group meetings and the dynamic group composition, as it happens in real world. Ekman et al. (2008) introduced a mobility model called Working Day Movement Model (WDM) with the objective of modeling the daily behavior of people. WDM simulates daily routines of people considering their daily commutes between home and workplace. WDM expresses the regularity of human mobility, but, as we show in Sec. 5.2, it is not representative of real-world group mobility. In summary, Table 1.1 shows the main opportunistic networking properties of the mobility models discussed above. GRM is an evolution of the aforementioned models, including all of their properties and also group regularity.
11
1.2. Building Blocks and Related Work
Contact duration
Displacements
Social context
Group regularity
RPGM (Hong et al., 1999) RVGM (Wang and Li, 2002) CMM (Musolesi and Mascolo, 2007) WDM (Ekman et al., 2008) SLAW (Lee et al., 2009) HCMM (Boldrini and Passarella, 2010) SWIM (Mei and Stefa, 2009) GRM (our model)
Inter-contact time
❳❳ ❳❳❳ Property ❳❳❳ ❳❳❳ Model ❳
Groups of nodes
Table 1.1. Opportunistic networking properties in each mobility model
✓ ✓ — — — — — ✓
— — ✓ ✓ ✓ ✓ ✓ ✓
— — ✓ ✓ ✓ ✓ ✓ ✓
— — — ✓ ✓ ✓ ✓ ✓
— — ✓ — — ✓ ✓ ✓
— — — — — — — ✓
Note: "✓" if the model satisfies the property, "—" otherwise.
Chapter 2 Group Mobility: Detection, Tracking and Characterization 2.1
Chapter Overview
Many practical problems can benefit from the knowledge of the underneath dynamics that govern human mobility. For example, it can be applied to better plan urban infrastructure, forecast traffic, map the spread of biological viruses, or better design Mobile Ad-hoc Network (MANET) protocols. Specific network problems such as opportunistic routing and information diffusion in MANETs share a common interesting property: they are highly dependent on how humans interact with each other. In this context, we define a human group as set of people that, for some reason or goal, get together in space and time. It is clear that knowledge of regular group meetings can be explored to improve the current stateof-the-art of opportunistic information diffusion, routing or to increase the current understanding of how diseases spread. However, it remains a challenge how to define, detect, keep track, and analyze groups of humans and their dynamics. In the literature, there are several proposals dedicated to understanding and modeling human mobility considering diverse aspects, but group mobility is currently an untrodden field. The human species is pretty sociable and this sociability must be considered in order to better understand, model, and predict movement. The growing ubiquity of geo-localization sensors and the availability of data collected by them create a new opportunity to tackle the problem of group mobility. With this in mind, the present chapter focuses on characterization of groups’ dynamics through the analysis of proximity contact traces. Among the specific contribution of this chapter, we highlight: 13
Chapter 2. Group Mobility: Detection, Tracking and Characterization
14
• Definition of a methodology for telling apart random and social interactions in proximity traces using a time dependent social graph model; • Proposal of a systematic way for detecting and tracking human mobile groups; • Characterization of group mobility properties, including group evolution, periodicity, and meeting durations; • A discussion and some early results on how knowledge of group mobility could be applied to design opportunistic networking protocols.
This chapter is organized as follows. Section 2.2 formalizes our methodological steps to detect, track, and characterize human groups’ dynamics. Section 2.3 describes the experiments’ methodology and metrics, presenting results and the main groups’ characteristics detected. Section 2.4 discusses the application of group detection to information dissemination protocols. Finally, Section 2.5 brings the final remarks and future work.
2.2 2.2.1
Social Groups Identification and Tracking Modeling the Evolution of Proximity Traces With Graphs
To analyze group dynamics we propose a social graph model. Firstly, we slice the proximity data set in time windows tw (we discuss the ideal time size for tw in Section 2.2.3). Contacts within the same slice tw will be aggregated in a contact graph Gc(V, E[tw = i]), in which V is the set of vertices representing entities in the data set (i.e., people) and E is the set of edges that represent proximity contacts between a pair of entities in V . Thus, in our model, the trace processing will result in a set of subsequent, undirected, edge-weighted graphs: S = {Gc(V, E[tw = 0]), Gc(V, E[tw = 1]), ..., Gc(V, E[tw = n])}. The weight of an edge (v, w) ∈ E is given by (i) the number of contacts registered between v and w during the time slice tw; or (ii) the sum of (v, w) contacts durations, inside tw time slice, if contacts’ durations are available in the trace. In this chapter, we used a trace in which contact durations were not available, so we computed edge weights according to the option (i).
2.2. Social Groups Identification and Tracking
15
Figure 2.1. RECAST application to tell apart random and social relationships between peers in a contact trace
2.2.2
Telling Apart Social and Random Contacts to Create Social Graphs
To help separating random and social contacts, we apply RECAST algorithm (Vaz de Melo et al., 2013) to the contact trace. RECAST algorithm separates social from random relationships between peers (Fig. 2.1). It works comparing the edge persistence and topological overlap of randomly generated graphs to the actual contact graph obtained from the contact trace. As output, RECAST reveals which pairs of nodes meet each other in a social fashion and which pairs do not share social properties. We then remove from the trace, contacts between pairs classified by RECAST as random and proceed with the analysis in the trace containing only contacts between pairs that share social bonds. Considering a pre-defined tw size, for instance 30 minutes, a single contact within the whole time slice does not necessarily mean that the entities are socially interacting. Single contacts might be random encounters, even if nodes share a social bond. It might be caused by intersections between individual trajectories and should not necessarily mean a social interaction. We are interested in defining a threshold w th for the minimum edge weight, which should be enough to consider that the entities are in fact together inside the time slice tw. It is clear that to properly define both, the size of slice tw and the edge weight threshold wth , we need to analyze data set properties (e.g. sampling rate). In Section 2.2.3, we perform a characterization of the studied data set to be able to properly define tw and wth . The following methodology can be applied to other data sets as well.
16
2.2.3
Chapter 2. Group Mobility: Detection, Tracking and Characterization
Data Set Characterization
To be able to analyze the social groups’ dynamic properties, we need to understand the data set, avoiding potential biases (e.g., sampling bias, and inconsistencies) due to the data acquisition process. We perform this evaluation with the goal of defining tw size (the proper time slice to divide the data set) and wth (the threshold for the number of contacts, or contact duration that tell apart social and random contacts in the trace previously filtered by RECAST). In the present study, we used the MIT Reality Mining proximity trace (Eagle and Pentland, 2006), which is a contact trace containing 80 users who reside in two different university buildings. Users were monitored for one year and contacts were registered when two users were less than 10 meters apart. A contact entry in the trace is composed of the IDs of the pair of nodes and the date and time when the contact happened. It is worth mentioning that geo-location traces (such as GPS traces) can be converted to proximity traces by defining a minimum distance, which can be considered a contact between two entities. For this reason, this methodology can also be applied to those kinds of traces. Firstly, we analyze the time between pair re-encounters, i.e., once a pair has met, what is the distribution of the time until the next meeting. Fig. 2.3 shows that the re-encounter behavior is very periodical, with peaks around every five minutes (red dashed lines). This behavior indicates that the deployed system for data acquisition acts every five minutes most of the times, but for some reason it can also actuate in shorter periods. Looking at the CDF of the re-encounter probability, we see that approximately 95% of the re-encounters can be captured with a tw of one hour. For this reason, we set the duration of the time window tw to one hour. Next, we analyze the fraction of pairs contacts to define wth . Fig, 2.2 shows that 27% of pairs that meet in a given hour only meet once. We assume these one-time meetings as coincidence meetings. For meeting frequencies from 2 to 12, the graphic shows values between 5% and 10%. For frequencies higher than 12, the probability becomes very low, which is consistent to the assumption of data acquisition mostly in periods of five minutes, but rarely less than five. From 2 to 12 encounters per hour, we have similar values in the PDF when compared to P (X = 1). For this reason, w th = 2 for the MIT Reality Mining data set. To summarize, through the data set characterization, we were able to define that two or more contacts within an hour are enough to be considered social interaction (after RECAST filtering).
2.2. Social Groups Identification and Tracking
17
Figure 2.2. Probability distribution function of the number of pair contacts per hour.
2.2.4
Group Detection
After defining values for tw and wth , we define a social group as follows: • Definition of social group: A group is a community detected in Gc(V, E[tw = i]) , i.e., the graph generated from the ith time slice of the trace S, after eliminating contacts between pairs with no social bond and edges with weight bellow the threshold wth . So far, we have established a model to represent social interactions that consists of graphs generated from peer contacts in traces’ time slices. Following the above group definition, we must be able to detect communities (social groups represented by more densely interconnected parts within a graph of social links) in such graphs in order to track social groups. There are several community detection algorithms, such as (Xu et al., 2013; Nguyen et al., 2011a; Gregory, 2010). From the existing algorithms, we use the Clique Percolation Method (CPM) (Palla et al., 2005). The main reasons for using CPM are that their community members can be reached through well connected subsets of nodes and that the communities may overlap (share nodes with each other). This latter property is essential, as most social graphs are characterized by overlapping and nested communities (Palla et al., 2007). For each time-slice graph Gc(V, E[tw = i]) we compute CPM. In CPM, a community is defined as a union of all k-cliques (complete sub-graphs of size k) that can be reached from each other through a series of adjacent k-cliques (where adjacency means sharing k − 1 nodes). The CPM parameter k limits the minimum size of detected communities. CPM has remarked itself as one of the most effective methods once fed with correct parameters (Peel, 2010). To the purpose of detecting social groups, we set k = 3, thus, we consider groups of three or more people. Fig. 2.4
18
Chapter 2. Group Mobility: Detection, Tracking and Characterization
(a)
(b)
(c)
Figure 2.3. Probability function of the time x (in seconds) until the next meeting. Red dashed lines show a fixed inter-measurement time of 318 seconds in which re-encounter peaks happen. This means that most of the trace proximity records were acquired in fixed periods of 318 seconds. The probability of a pair of nodes meeting again has approximately exponential distribution and 95% of the re-encounters happen in less than one hour
shows groups detected with CPM in the MIT proximity trace (Eagle and Pentland, 2006) at February 5th of 2009, at 7, 8 and 9am, subsequent time slices of one hour size.
19
2.2. Social Groups Identification and Tracking
(a) 6AM
(b) 7AM
(d) 9AM
(c) 8AM
(e) 10AM
Figure 2.4. Group detection with CPM, in the MIT proximity trace, with tw =1h in three consecutive time windows, at February 5th of 2009. Only edges with wth ≥ 2 are represented
2.2.5
Group Tracking
Once groups are detected in different time slices, there must be a way of tracking them, i.e., a criterion for considering that two groups in consecutive time slices are in fact the same group. With that goal we introduce the Group Correlation Coefficient ρ(G1, G2): ρ(G1, G2) =
|V (G1) ∩ V (G2)| |V (G1) ∪ V (G2)|
(2.1)
where |V (G1) ∩ V (G2)| is the number of common nodes in groups G1 and G2 and |V (G1) ∪ V (G2)| is the total number of different nodes that compose both groups. The coefficient ρ assumes values from 0 to 1, where 0 means no correlation, i.e., no node that belongs to both groups and 1 means that G1 and G2 have the exact same node composition. Group correlation coefficient is a measurement of the stability in groups’ composition.
Chapter 2. Group Mobility: Detection, Tracking and Characterization
20
We consider a group to be the same in two consecutive time slices if ρ(G(tw = i), G(tw = i + 1)) > 0.5, i.e., if at least 50% of the group members remains the same. A ρ value greater than 0.5, is the condition to map each group in a single group in two different time slices. The value ρ < 0.5, would allow a single group to be mapped to two different groups with less than half of the original node composition in the next time window, adding complexity to the group tracking. At the same time a ρ threshold of 0.5 allows high volatility in group composition, making it possible to better analyze groups’ evolution.
2.3
Characterization of Group Dynamics
In this section we use the results of group detection and tracking methodology proposed in Section 2.2 to characterize groups’ dynamic evolution. Specifically, we analyze the following characteristics: • Groups’ sizes throughout day hours. • Groups’ evolution considering possibilities of no change, growth, contraction, birth and death. • Groups’ meetings inter-contact times and periodicity. • Groups’ meetings durations and its correlation with group stability and with group’s social bonds strength.
2.3.1
Metrics
One of the interests of the experiments to be presented in this section, is to reveal what factors impact the duration of a group meeting. Specifically, we plan to investigate the impact of the stability of group members and the impact of the strength of social bonds shared by group members. To measure the stability of group members we use the previously defined Group Correlation Coefficient ρ. Since we consider a group to remain the same if ρ > 0.5, the value for ρ throughout the duration of a group may vary from 0.5 to 1.0. For measuring the strength of groups’ social bonds we define Groups SelfContainment Factor (GSCF) as: GSCF (G) = �
�
win (G) � win (G) + wout (G)
(2.2)
2.3. Characterization of Group Dynamics
21
(a) Distribution of group sizes over day hours (0 (b) Considered events in group evolution (Palla to 23h) et al., 2007)
(c) Dynamics of group evolution throughout day periods
Figure 2.5. Analysis of groups’ evolution, i.e., groups’ sizes and groups’ transformations, over different days times.
� where win (G) is the sum of edge-weights between members of Group G, and � wout (G) is the sum of edge-weights between members of group G and outsiders (non-members). A GSCF (G) value close to one means that G members share strong social bonds while a value close to zero means a group with weak social links.
Chapter 2. Group Mobility: Detection, Tracking and Characterization
22
Figure 2.6. Probability of a group re-meeting in t hours after meeting for the first time at t = 0. Red lines represent 24-hour periods and green lines represent 7-day periods
2.3.2
Results
After applying the methodology for group detection and tracking, proposed in Section 2.2, we here analyze characteristics from detected groups. In Fig. 2.5(a), box-plots for groups sizes are presented for each day hour (outliers omitted for better presentation). It shows that in night hours (10pm to 7am), groups’ sizes are similar and distributed around the average size of six. During day hours (8am to 9pm), groups’ sizes are more heterogeneous and have lower sizes. This behavior indicates that, in hours with higher mobility, groups tend to be less stable and have reduced number of members. According to the considered possibilities of evolution in groups, displayed in Fig. 2.5(b), Fig. 2.5(c) presents the average group dynamics throughout hours of the day. In late hours and early morning, the number of births and deaths decreases and the number of unchanged groups, i.e., groups that maintain the same number of nodes in consecutive hours, increases. This behavior is explained by the fact that, at night, roommates and dorm neighbors probably form groups. Although few group members may leave or join, it is more probable that groups remain until the next working hours, when students leave dorms.
2.3. Characterization of Group Dynamics
23
Figure 2.7. Pearson’s correlation between group meeting durations, GSCF and members stability ρ.
Fig. 2.6 presents a very important result, which measures the frequency of group re-encounters, i.e., given the fact that a group first met at time t = 0, how group re-meetings are distributed along the next hours (t hours after the first meeting). The result reveals that the mass of probability is concentrated around peaks in periods of 24 hours (represented by red dashed lines). This means that group meetings are highly periodical in a daily fashion. One may also notice higher peaks marked with green dashed lines. Green dashed lines represent periods of 7 days, meaning that groups meetings also present weekly periodicity. This periodicity makes sense since people have schedules and routines. This result motivated our discussion in Section 2.4, which tries to answer the question: Is it possible to use past group meetings to predict future ones? To measure the impact of the strength of social bonds (GSCF - Eq. 2, Section 2.3.1) and groups’ stability (ρ, Eq. 1, Section 2.2.5) to the group meetings durations we compute Pearson’s Correlation. Fig. 2.7 shows that group meetings durations present moderate positive correlation with both, GSCF and ρ, indicating that long group life times is related with group composition remaining mostly unchanged and with the existence of strong social bonds between group members. The presented correlations were obtained with a p-value of 2.2 × 10⁻¹⁶ .
Chapter 2. Group Mobility: Detection, Tracking and Characterization
24
(a) Nov.2008
(d) Feb.2009
(g) May 2009
(b) Dec.2008
(e) Mar.2009
(c) Jan.2009
(f) Apr.2009
(h) Jun.2009
Figure 2.8. Delivery ratios for nodes that have been in groups with the origin node (in blue) and for nodes that have not been (in red). Numbers in the x-axis represent IDs of origin nodes
2.4
A Discussion on Group Detection Application
There are several applications that can benefit from the knowledge of intrinsic characteristics governing social groups’ behavior, for example, DTN protocols. In DTNs, two very important properties are high message delivery ratio and low message delivery times. With the purpose of illustrating how the knowledge about previous group meetings could be used to improve DTN protocols, we here analyze the difference in
2.4. A Discussion on Group Detection Application
25
Figure 2.9. Average delivery ratios, for the different origin nodes, from November-2008 to June-2009
delivery ratios of nodes that have been in the same group with the source of a given message and of nodes which have not been in the same group of the source. In our experiment, we select a node as the origin of a message and simulate an epidemic transmission, i.e., at every time that a node which has the message meets a node that does not have it yet, the message is propagated. We simulate the message propagation selecting each node of the data set as origin and divide the rest of the nodes in two classes: nodes that have belonged to a group together with the origin in the past 30 days and nodes that have not. Then, we compute the delivery ratios of the two classes of nodes. We consider that the message is delivered to node N if node N receives the message within seven days after the start of the dissemination. As presented in Fig. 2.8, for different months, delivery ratios to nodes that had been in group with the origins are more than two times higher. Around 90% of them receive the message sent by the origin within one week. On the other hand, the delivery ratio for nodes that have not been in a group together with the origin is around 40%. This result conforms with the periodical behavior discussed in Section 2.3 (a group that have met in recent past is likely to meet again soon) and is a key insight on how group detection could and should be used to better design opportunistic routing protocols,
26
Chapter 2. Group Mobility: Detection, Tracking and Characterization
as discussed in future works. One may notice that, throughout different months, for some node IDs there are some blank spaces in the graphs of Fig. 2.8. These are origin nodes that were not active in the data set during that given month, and for this reason present 0% delivery ratios to both classes of nodes. In June of 2009 for example, there are several nodes with 0% delivery ratios, which makes sense since many of the students start to leave the campus for summer vacation. Figure 2.9 depicts the average delivery ratios, with different origins, from November of 2008 to June of 2009.
2.5
Final Remarks
In this chapter, we go over a sequence of methodological steps to detect and track social groups in mobility traces. We perform a characterization of groups’ evolution over time considering (i) size; (ii) structure change rates of growth, contraction, birth and death; (iii) group meeting periodicity, and (iv) group meeting durations and its correlation with the strength of group’s bonds and group’s composition stability. Our results show that social groups’ characteristics are highly dependent on day time. Moreover, group contacts happen periodically fashion, presenting not only daily periodicity, but also a portion of weekly periodicity. It is also noteworthy that groups re-encounter probability decreases over time, meaning that groups that have not met in a while are less likely to meet again soon. Finally, the duration of group meetings is moderately correlated with the stability of it’s members (ρ) and with the strength of their social bonds (GSCF ). In the Chapter 3, we use the unraveled characteristics to design a social-groupsaware opportunistic routing protocol that improves delivery ratio decreasing message duplication and network overhead.
Chapter 3 GROUPS-NET 3.1
Chapter Overview
As discussed in Chapter 1, forwarding algorithms in multi-hop D2D networks have the goal of achieving cost-effective delivery, i.e., the highest possible delivery ratio with the lowest possible network overhead. In this case, the delivery ratio is measured as the percentage of the opportunistically routed messages that are successfully delivered to the destination. Successfully delivered messages are the ones that the base station will not need to deliver itself, enabling bandwidth offload. The network overhead is measured by the average number of times that the content will need to be D2Dtransmitted for the message to get to its destination. A high number of transmissions may negatively impact the users’ experience by, for example, increasing the devices’ energy expenditure. Considering these metrics, the most successful strategy for opportunistic costeffective forwarding, Bubble Rap (Hui et al., 2011), relies on information about static social communities and nodes’ centrality (which can be approximated by the node popularity within the mobile network). The use of Bubble Rap in D2D Networks is proposed in (Li et al., 2014). However, communities have some problems. First, they are computationally expensive to detect (Nguyen et al., 2011b). Second, they are hard to detect in a distributed way since the individual nodes will not have information about the contact graph of the whole network. Existent distributed community detection algorithms have at most 85% precision in detected communities, as reported in (Hui et al., 2007). Another problem of community detection algorithms is the parameter calibration. The most successful community detection algorithms depend on parameters that must be calibrated for each specific scenario (Peel, 2010). In a real-time application, such as D2D communication, such calibration is not feasible. In addition 27
28
Chapter 3. GROUPS-NET
to these mentioned problems, there is no established truth for community detection. Abrahao et al. (2012) evaluate community detection schemes and show that, for the same scenarios, different community detection algorithms yielded very different results for communities’ compositions. Finally, static communities detection does not account for the dynamism in humans’ social relationships, i.e., how they change over time. Aiming to address these issues, we propose to look at social groups’ meetings, instead of detecting communities. A social group meeting is defined as a group of people who are together, in space and time, for some social reason or common goal. People in a bus, for example, are together because they share the same goal of getting to a given point of interest. Students in the classroom share the objective of learning the class’ subject content. Friends hanging out at a bar share the social motivation of being together to relax and talk to each other. All of these are examples of social group meetings. As human beings have regular schedules and routines, it is reasonable to expect social group meetings to present some regularity as well. From the implementation point of view, a device can detect a group meeting of which it is part of by simply looking at the list of devices that remained nearby for more than a threshold time, for example, 10 minutes. This way, groups meetings can be easily detected in a distributed fashion. Moreover, the group meeting detection method does not change depending on the scenario nor requires parameters calibration for each specific network, as in community detection schemes. In addition to those desirable characteristics, by looking only at recent group meetings or by giving higher importance to more recent meetings, it is possible to account for the dynamic nature of social relationships. All of these favorable characteristics motivated the study of group meetings to propose an opportunistic routing scheme that is better suited for D2D networks than the current social aware proposals. Therefore, the specific contributions of this chapter are the following: • A characterization of group meetings regularity properties and its modeling as a Poisson process, which enables to predict future meetings using the information about the most recent ones; • An analysis of the state-of-the-art synthetic mobility models which allows us to conclude that group meetings’ properties are not well captured by the synthetic traces generated from such models. • An opportunistic forwarding algorithm for D2D networks, aware of group meetings, which does not need to detect communities nor calibrate parameters, and achieves better cost-effectiveness than the state-of-the-art solution in real large scale scenarios. This chapter is organized as follows. Section 3.2 formalizes our methodology to detect and track group meetings from pairwise contact traces. Section 3.3 describes the
3.2. Group Meetings Detection and Tracking
29
main properties of group meetings that make them interesting in the design of a new forwarding strategy. Section 3.4 introduces GROUPS-NET, a group meetings-aware routing protocol. Section 3.5 presents a comparison of real and synthetic mobility traces with respect to the presence of group mobility. Section 3.6 comparatively evaluates GROUPS-NET, contrasting its performance with the state-of-the-art solution, Bubble Rap, in different network scales. Finally, Section 3.7 presents the final remarks and future work.
3.2
Group Meetings Detection and Tracking
Group meetings may be easily detected in a real scenario by looking at the list of near devices, for instance. However, to study group meetings properties it is necessary to detect group meetings from pairwise contacts traces, which are the typically available data sources to study social-aware forwarding algorithms. In such traces, each pairwise contact is registered with the two nodes involved and the time when the contact happened. Therefore we have used the group detection methodology proposed in Chapter 2. Notice that in a real distributed scenario these steps would not be necessary since group meetings detection is simple to perform distributively. However, this methodology must be applied to enable such study using pairwise contact traces. In the present study, we used the MIT Reality Mining (Eagle and Pentland, 2006) and Dartmouth (Henderson et al., 2008) traces, which are contact traces containing 80 and 1200 users respectively. In the MIT Reality Mining the monitored users reside in two university buildings and were monitored for several months. Contacts were registered when two users were less than 10 meters apart. Although the MIT Reality Mining trace consists of a specific and small scale scenario, we considered this trace because it is the original trace used to validate Bubble Rap in (Hui et al., 2011). The Dartmouth trace registered contacts of all of the students in a university campus for two months. To the best of our knowledge, Dartmouth is the largest scale and publicly available contact dataset. Due to its scale and generality, the Dartmouth trace is a better representation of a real D2D cellular network environment.
3.3
Social Group Meetings Properties
In the previous section, we showed how we are able to detect group meetings from proximity traces. This section reviews the main properties of group meetings, presented in Chapter 2, that make it interesting to use them to perform D2D Routing.
30
Chapter 3. GROUPS-NET
(a)
(b)
Figure 3.1. a) Probability of a given group re-meeting t hours after its first meeting. Red dotted lines represent 24-hour periods and green dashed lines 7-day periods. b) Average delivery ratio, for different origin nodes, from November of 2008 to June of 2009
Figure 3.1(a) presents the frequency of group re-encounters for the MIT Reality Mining, i.e., given the fact that a group first met at time t = 0, how group re-meetings are distributed along the next hours (t hours after the first meeting). The result reveals that the probability mass is concentrated around peaks of 24-hour periods (represented by red dotted lines). This means that group meetings are highly periodical in a daily fashion. One may also notice higher peaks marked with green dashed lines. Green dashed lines represent periods of seven days, meaning that groups meetings also present weekly periodicity. This periodicity makes sense since people have schedules and routines. This result motivated our next experiment, which tries to answer the question: is it possible to use past group meetings to predict future ones? In our next experiment, we select a node as the origin of a message and simulate an epidemic message transmission, i.e., every time a node with a message meets a node that does not have it yet, the message is propagated. We simulate the message propagation selecting each node of the MIT dataset as origin and divide the rest of the nodes into two classes: nodes that have belonged to a group together with the origin in the past 30 days and nodes that have not. Then, we compute the delivery ratios of the two classes of nodes. We consider that the message is delivered to node N if node N receives the message within seven days after the start of the dissemination.
3.4. GROUPS-NET: Group Meetings Aware Routing
31
As presented in Figure 3.1(b), for different months, the delivery ratios to nodes that have been in group meetings with the origin are over two times higher than of the other nodes. Around 90% of the nodes that were in group meetings together with the origin received the message within one week. On the other hand, the delivery ratio to nodes that had not been in a group together with the origin is around 40%. This result conforms with the periodical behavior presented in Figure 3.1(a) (a group that has met in recent past is likely to meet again soon) and is a key insight on how group meetings could and should be used to better design opportunistic routing protocols. One may notice that in June the delivery ratios for both classes significantly drop. This behavior is explained by the fact that the trace was collected in a university campus and, in June, most students in the US start to leave the campus for summer vacation. To use group meetings to design a forwarding policy, there must be a representative statistical model for group meetings regularity. Due to group meetings’ periodicity, presented in Figure 3.1, it makes sense to model such behavior as a Poisson process. In a Poisson process, the accumulated number of occurrences along the time must be well approximated by a straight line with slope λ. To verify the goodness of fit of group meetings to a Poisson process, for each group in the trace, we perform a linear regression of the number of meetings over time. Then, we compute the R 2 value of each group, which measures how well the linear model fits to the number of meetings. Figure 3.2 exemplifies such regression for different values of R 2 . Figure 3.3, which presents the frequency distribution of R2 for all groups in the trace, shows that group meetings have a good fit to a Poisson process, most of them with R 2 values of 0.85 or higher. We use this Poisson process model to design our forwarding algorithm, as discussed in Section 3.4.
3.4
GROUPS-NET: Group Meetings Aware Routing
Considering the group meetings properties revealed in Section 3.3, our algorithm, GROUPS-NET (Group ROUting in Pocket Swiched-NETworks), works by forwarding the messages from the origin node to the destination node through the most probable group-to-group route. To model the probability of group-to-group paths, GROUPSNET uses a probabilistic graph model in which each group detected in the recent past is represented as node and the edges between two nodes represent the probability of a message being propagated from one group to another. To assign a probability for an edge that links two groups, for instance groups A and B, GROUPS-NET considers
32
Chapter 3. GROUPS-NET
(a)
(b)
(c)
(d)
Figure 3.2. Poisson process fit for different values of R2
Figure 3.3. R-squared distribution for Poisson distribution fits of each group of the trace
3.4. GROUPS-NET: Group Meetings Aware Routing
33
(i) the probability of groups A and B meeting again in the near future, and (ii) the probability of a message being carried from a group A to a group B by a person who is member of both groups. To compute such probability, GROUPS-NET relies on two main properties: • Meetings regularity: Each group is assigned with a probability of meeting again soon, which is based on the number of times that the group has met in the recent past. We show, in Section 3.3, that it follows a Poisson process. The regularity property comes from the group meetings periodical behavior, depicted in Figure 3.1(a). The key insight is that the higher the number of meetings of a group in the recent past, the higher the probability of that group meeting again in the near future. By only considering meetings in the recent past, the meetings regularity property accounts for the social dynamism of human relationships. • Shared group members: In a group meeting, a message can be propagated for all nodes involved in the meeting. However, the message must be propagated forward to the next group and so on, until it reaches a group that the destination node is member of. This group-to-group propagation is made by nodes that belong to both groups linked by an edge. If two groups have a higher number of member nodes in common, there is a greater probability for the message to be carried from group A to group B, for instance. Thus, higher probabilities should be assigned to edges between groups that have more shared members. To combine both of the aforementioned properties, GROUPS-NET assign edges’ probabilities as the product of the probabilities of each of the groups A and B meeting again (meetings regularity property) weighted by the similarity in A and B of member compositions (shared group members property). Figure 3.4 illustrates the GROUPSNET algorithm. The λ value of a group in the Poisson process is the inverse of the group’s average inter-meeting time. Thus, given a fixed-time window size of length L, which is the considered time to look back in past (e.g., 3 weeks), the λ of a group can be estimated by: number_of _meetings . (3.1) λ= L Since group meetings follow a Poisson process (as we show in Section 3.3), the probability of a given group to meet K times in the t-time interval is given by the expression: e−λt (λt)K P [N (t) = K] = . (3.2) K! For our opportunistic routing algorithm, we are interested in the chance of a
34
Chapter 3. GROUPS-NET
Figure 3.4. Example of a GROUPS-NET scenario. The base station assembles the groups graph. Nodes’ weights are the number of meetings of each group during the last week and edge weights are the number of members shared by each pair of groups. Nodes and edges weights are then used to generate a probabilistic graph according to the Meetings Regularity and Shared Group Members properties
group to meet again at least one time during the considered time interval t: P [N (t) � 1] = 1 − P [N (t) = 0] = 1 − e−λt .
(3.3)
Equation 3.3 shows that the frequency in group meetings can be used to compute the probability of a group meeting to happen at least once in the near future time t. Thus, GROUPS-NET sets nodes’ probabilities according to Equation 3.3. The time t should be set according to the messages’ TTLs of the network. To consider the probability of the message being propagated between two different groups by common members of both, the algorithm computes the overlap in groups’
3.4. GROUPS-NET: Group Meetings Aware Routing
35
members composition as: P (m : G1 → G2) =
|V (G1) ∩ V (G2)| . |V (G1) ∪ V (G2)|
(3.4)
After setting the edges probabilities, the algorithm re-computes each edge weight as the product of each of the groups’ re-meeting probabilities (computed with Equation 3.3) multiplied by the groups’ composition overlap, as in Equation 3.5. W (EG1,G2 ) = P (G1 → G2) × PG1 [N (t) � 1] × PG2 [N (t) � 1]
(3.5)
Therefore, with edges’ probabilities set, the most probable group-to-group probability can be computed by the product of each edge in its path (Equation 3.6). By exploiting the logarithm-likelihood property described in Equation 3.7, the most probable path can be simply computed by a shortest path algorithm, such as Dijkstra, after setting each edge weight W (Ei,j ) to −log(W (Ei,j )). P (R) =
arg_max(
R �
�
W (Ei,j ), Ei,j ∈ R.
R � W (Ei,j )) = arg_max(log( W (Ei,j )))
= arg_max(
R �
(3.6)
(3.7)
log(W (Ei,j ))).
Using this modeling, we propose GROUPS-NET to compute the most probable group-to-group path and forward a message opportunistically to nodes that belong to such route. GROUPS-NET is formalized in Algorithm 1. The GROUPS-NET algorithm has an upper bound defined by the computation of the shortest path in a graph, which has time complexity of O(V 2 log(V )), where V is the number of different groups in the network, i.e., vertexes in the groups graph G[V, E] of Algorithm 1. Notice that to compute the most probable group-to-group path, it is necessary to centralize the information about recent group meetings at some point. Such computation is made possible by the D2D architecture, which defines a centralized control plane and a decentralized data plane. This is the reason why GROUPS-NET properly fits applications in the D2D networks, but it is not necessarily feasible in purely distributed DTNs. To centralize the information about groups meetings, each device must periodically (e.g., once a day) update the base station with its recent group meetings.
36
Chapter 3. GROUPS-NET Data: The past time window: T ; The list of groups detected within T : L; The number of meetings of each group Gi in L; D2D network messages‘ time to live: TTL; Origin: o; Destination: d; Result: The list of devices to forward the message to forall Gi in L do λi = M eetings(Gi) T P (Gi) = 1 − e−λi ×T T L end G[V,E] = ∅ forall pairs (Gi,Gj) in L do W (Gi, Gj) = devices(Gi)∩devices(Gj) devices(Gj)∪devices(Gi) G[V,E].add_edge(Gi,Gj) G.E(Gi,Gj).weight = −log(W (Gi, Gj) × P (Gi) × P (Gj)) end R = shortestPath(G[V,E],o,d) ForwardingList = ∅ forall Network Devices Di do if Di ∈ R then ForwardingList.add(Di) end end return ForwardingList; Algorithm 1: GROUPS-NET route selection algorithm.
When a given origin device wishes to send a content to a destination, it sends a request to the base station, which computes the most probable group-to-group path and sends it back to the origin device. Next, the forwarding policy proceeds as follows: starting by the origin device, each device will make the decision of forwarding or not the content to a new encountered device based on the condition that the encountered device must be a member of at least one of the groups that belong to the most probable group-to-group path.
3.5
Synthetic vs Real World Mobility
Before proceeding to the evaluation of GROUPS-NET, in this section, we compare some of the state-of-the-art synthetic mobility models with real mobility traces, with the goal of verifying if group meetings’ regularity properties are captured by such synthetic
37
3.5. Synthetic vs Real World Mobility
(a) MIT (Real Trace)
(b) Dartmouth (Real Trace)
(c) SWIM (Synthetic Trace)
(d) WDM (Synthetic Trace)
Figure 3.5. Comparison of group meetings periodicity in real and synthetic mobility traces
models. Specifically, we want to see if such models capture group re-encounters and their evolution over time to be able to decide if they are representative, considering the group mobility feature and if they should or not be used in the validation of opportunistic networking protocols based on group meetings and social context. Firstly, we apply the methodology for detecting and tracking groups, defined in Section 3.2 to both real mobility traces, MIT and Dartmouth. Figures 3.5(a) and
38
Chapter 3. GROUPS-NET
3.5(b) show the P.D.F. of group re-meetings along the time for the real world traces. In both of the real mobility traces we can verify the presence of periodicity in groups’ re-encounters. By looking at both of them we see that the mass of probability is concentrated in peaks aroud the red dotted lines, which represent periods of 24 hours. We also observe in both Figures 3.5(a) and 3.5(b) that higher peaks are presented around the green dashed lines, which represent periods of seven days. As discussed in Section 3.3, this pattern in the group re-meetings’ P.D.F. shows that group meetings present daily and weekly periodicity. It is noteworthy that such pattern is observed in both of the real traces, even though they are from different places, have different number of nodes, and used different data collection methods. Next, we leverage three widely used state-of-the-art synthetic mobility models to verify if they represent well the role of social groups to mobility. The SWIM mobility model was introduced by Mei and Stefa (2009) as a model to generate synthetic small worlds which preserve the pairwise contact duration and inter-contact times statistical distributions as they are observed in real mobility traces. The SLAW mobility model (Lee et al., 2009) was designed to capture several significant statistical patterns of human mobility, including truncated power-law distributions of human displacements, pause-times and pairwise inter-contact times, fractal way-points, and heterogeneously defined areas of individual mobility. The Working Day Movement (WDM) synthetic model (Ekman et al., 2008) is a model designed to capture these same statical properties of contact durations and inter-contact times as SWIM and SLAW. In addition to those properties, WDM aims to capture the daily regularity of human movements, i.e., how human routines after their mobility. As we did for the real traces, MIT and Dartmouth, we have applied our group detection and tracking methodology to the contact traces generated by these three synthetic models. Figures 3.5(c) and 3.5(d) present the results for the SWIM and WDM models, respectively. The contact trace generated by the SWIM model (figure 3.5(c)) do not present any regularity in group meetings. Out of the detected groups only three group remeetings were registered in a period of 15 days. The result for the contact trace generated by the SLAW model presented an analogous behavior, i.e., no regularity in group meetings. This behavior is explained by the fact that such models were designed to be representative of the statistical properties of pairwise contacts only, without considering that human contacts often involve more than two peers. These models look only at pairwise contacts, disregarding group meetings. In the WDM trace (figure 3.5(d)) we can observe that group re-meetings happen precisely in periods of 24 hours and with much higher frequencies than in real mobility
3.6. Comparative Analysis
39
traces. This behavior is observed because WDM firstly defines a set of places, called offices, and than distribute nodes to transition between pre-defined subsets of offices with daily periodicity. Therefore, nodes with intersections in their lists of offices will always form groups with exaggerated meeting regularity. By analysing the group meetings regularity of the synthetic models, we conclude that none of them represent well the group mobility patterns. For this reason, none of the synthetic models fits for evaluating GROUPS-NET which is based on the group meetings regularity. Therefore, in Section 3.6, we evaluate GROUPS-NET using only real mobility traces, which do not suffer from such biases. We also highlight the need for designing mobility models which better represent role of social groups and their regularity in human mobility.
3.6
Comparative Analysis
To validate the performance of GROUPS-NET, we compare it to the forwarding algorithm that achieved the most cost-effective performance for D2D networks: Bubble Rap (Hui et al., 2011).
3.6.1
Bubble Rap Algorithm
The Bubble Rap algorithm identifies static social communities by looking at densely interconnected nodes in the aggregated contact graph during the whole trace using the Clique Percolation Method (Palla et al., 2005). Therefore, each node in the network must belong to at least one community. Nodes that do not belong to any community are assigned to a pseudo-community of one node. This is necessary for the forwarding algorithm operation. Moreover, each node gets a measure of its global popularity in the network (GlobalRank ) and a local measurement of popularity, which is valid within that node’s community (LocalRank ). Using these parameters, the forwarding strategy works as follows: • At each encounter, a given node transmits its content if the encountered node has a higher GlobalRank, or if the encountered node belongs to a community of which the final destination is a member. • Once the message is inside the final destination’s community, the forwarding process occurs if the LocalRank of the encountered node is higher than the LocalRank of the node that has the message. This procedure goes on until the message reaches the final destination.
40
Chapter 3. GROUPS-NET
With the purpose of having a fair comparison, we have implemented Bubble Rap using the community detection pre-calibrated parameters reported in (Hui et al., 2011), which provided the best results in terms of cost-effective content delivery. Also, the GlobalRank and the LocalRank were calculated using the C-Window technique that better approximated the node centrality metric in their experiments (Hui et al., 2011).
3.6.2
Performance Evaluation
With the goal of evaluating GROUPS-NET and Bubble Rap, we used the following metrics: • Delivery ratio: Evaluates the percentage of successfully delivered messages along the time. • Number of transmissions: Measures the network overhead, i.e., the number of D2D transmissions that each algorithm performs along the time. For each evaluated trace (MIT and Dartmouth), an (origin, destination) pair is randomly selected among the users of the trace with uniform probability. Moreover, the time t in which the message transmission starts at the origin node is also randomly selected within the trace duration. Both protocols were executed with 500 randomly generated (origin, destination, time). This process was repeated 8 times with different seeds for random number generation, to obtain 95% confidence intervals. This way, we aim to capture diversified behavior patterns throughout the trace, conferring generality to the tests. Together with GROUPS-NET’s and Bubble Rap’s results, we also plot the results for a flooding transmission. In the flooding scheme, the message is always propagated whenever a node that has a message encounters a node that does not have it yet. The flooding establishes the upper bound for the delivery ratio and for the network overhead. In our tests, the recent past period used by GROUPS-NET to predict future group meetings was of three weeks, since it is enough to capture both, daily and weekly periodicity. Figure 3.6 presents the comparative results in terms of delivery ratio and network transmissions overhead along the time. The results for the MIT Reality Mining trace, presented in Figures 3.6(a) and 3.6(b), show that in the first hours, after the beginning of a transmission, GROUPS-NET has a slightly higher delivery ratio and, in the final hours, Bubble Rap overcomes it, successfully delivering a small percentage more. Throughout the whole message propagation time, GROUPS-NET presented a slightly higher network overhead. This happens because the MIT Reality Mining trace is a very particular, since all monitored users reside in the same university buildings. For this reason, they are expected to have stronger social bonds than regular nodes in
41
3.6. Comparative Analysis
(a) Delivery (MIT)
(b) Transmissions (MIT)
(c) Delivery (Dartmouth)
(d) Transmissions (Dartmouth)
Figure 3.6. Delivery ratio and network overhead of Bubble Rap and GROUPSNET
D2D scenarios. This characteristic benefits an algorithm such as Bubble Rap, which uses the static social structure in its forwarding policy. This fact motivated the study of a large scale and more general trace, such as Dartmouth, to evaluate the forwarding tests. However, notice that even in this specific scenario, GROUPS-NET presented a competitive result when compared to Bubble Rap, with the advantage of not requiring community detection and parameters’ calibration, which are hard or unfeasible in a
42
Chapter 3. GROUPS-NET
(a) Benefit-cost in log time scale (Dartmouth)
(b) Benefit-cost in regular time scale (Dartmouth)
Figure 3.7. Cost-effectiveness comparison of Bubble Rap and GROUPS-NET
practical real-time scenario. Figures 3.6(c) and 3.6(d) present the results for the same experiment performed in the Dartmouth trace, which is more general and has a larger scale. In this scenario, GROUPS-NET achieved a considerably better performance than Bubble Rap. In the period from 24 to 96 hours after the start of the message propagation, Bubble Rap obtains higher delivery ratio, but, after that, being outperformed by GROUPS-NET until the end of the three weeks’ transmission period. With respect to the network overhead, after the sixth hour, Bubble Rap starts to transmit much more messages than GROUPS-NET, presenting an average overhead 50% higher in the following hours. For 1000 different (origin, destination) messages, this represents an economy of 60000 D2D-transmissions in the network. Defining a benefit-cost metric as the ratio between successful delivery and network overhead, throughout the duration of the transmissions, GROUPS-NET presents a better benefit-cost than Bubble Rap. As depicted in Figures 3.7(a) (in log-scale) and 3.7(b) (in regular-scale), after the first hours of transmission, GROUPS-NET reaches two times Bubble Rap’s benefit-cost. As mentioned before, GROUPS-NET also has the advantage of not depending on community detection schemes nor needing parameter calibration, being for these reasons a viable practical solution.
43
3.6. Comparative Analysis
(a)
(b)
(c)
Figure 3.8. (a) Distribution of sizes of the most probable group-to-group paths in the MIT Reality Mining and Dartmouth traces; (b) Average network overhead for different scale scenarios; (c) Boxplots of the network overhead for 1000 transmissions in different trace scales
3.6.3
Discussion
By forwarding messages through the most probable group-to-group path, GROUPSNET achieves a high delivery ratio, which is comparable to the flooding upper bound and to Bubble Rap in both, small-scale and large-scale scenarios. This conforms to the result presented in Figure 3.1(b). However, by looking at the results presented in Figure 3.6, one question that arises is: Why does GROUPS-NET present a much lower overhead in large-scale scenarios, but not in small-scale ones? The answer to this question rests in the nature of each algorithm. Bubble Rap works by forwarding messages to nodes that have a higher popularity. Therefore, the maximum number of transmissions is limited by the nodes in the network that have higher popularity than the origin. When the origin is randomly selected, the expected number of nodes that are more popular than the origin is directly proportional to the total number of nodes in the trace. For this reason, when the number of nodes in the network is increased 15 times, from 80 (in MIT) to 1200 (in Dartmouth) Bubble Rap’s overhead also increases by approximately 15 times, as presented in Figures 3.6(b) and 3.6(d). GROUPS-NET maximum overhead, on the other hand, is limited by the size of the most probable group-to-group path (in number of groups) multiplied by the average number of members in the groups of such path. Figure 3.8(a) shows the distribution of (for most probable group-to-group) path sizes in terms of the number of groups involved in the path. In both traces, for randomly selected (origin, destination) pairs the distribution of the paths’ sizes is not proportional to the number of nodes involved
44
Chapter 3. GROUPS-NET
in the network. In fact, the average size does not change for different scales. Since the addition of each new group to the route involves a multiplication by the probability of a new edge (which can significantly reduce a path probability), the most probable paths tend to have few hops. For this reason, GROUPS-NET presents significantly lower overhead in large scales. To investigate how the network overhead evolves with the increase of the number of nodes in the network, we generate subsets of 200, 400, 600, 800 and 1000 nodes from the original Dartmouth dataset. This subset generation happens using a Snowball algorithm, which firstly assembles a social-contact graph and selects the node with the highest centrality. Next, it adds to the subset of nodes the neighbors of the central node. Then, it adds the neighbors of such neighbors and so on, until the desired number of nodes for the subset is reached. This way, the social structure of the network is preserved even for small subsets of 200 and 400 nodes, considering a total of 1200 nodes. Using these subsets, we evaluate the overhead of both algorithms with the goal of analyzing their evolution with the increase of the number of nodes in the network. Figure 3.8(b) shows the average overhead per message with different network sizes for both algorithms. Figure 3.8(c) presents the statistical distribution of such messages’ overheads for 1000 transmissions in each scenario. These experiments confirm the expected behavior for the overhead. Bubble Rap overhead presents a linear increase with the size of the network. GROUPS-NET overhead, on the other hand, remains stable for networks with 400 nodes or more. Since real cellular networks often have thousands (or even millions) of nodes, we claim that GROUPS-NET is better suited for such applications.
3.7
Final Remarks
In this chapter, we introduce the use of social group meetings awareness to leverage cost-effective message transmissions in multi-hop D2D Networks. Firstly, we propose a methodology for detecting group meetings from contact traces. Using the detected groups, we build a probabilistic graph, which is used to compute the most probable group-to-group path for a message to be forwarded. Our approach has the advantage of not requiring community detection and of being parameter-calibration free. Our experiments show that, in large-scale scenarios, this strategy is more cost-effective than previous state-of-the-art strategy (which is based on static social communities) with respect to delivery ratio and network overhead.
3.7. Final Remarks
45
The results show that the group meetings approach is a promising strategy. Based on this idea, one can propose forwarding strategies for several different applications. For example, GROUPS-NET can be modified to consider different types of forwarding such as Single-Source-Multiple-Destinations or Multiple-Source-MultipleDestinations. This could be simply achieved by computing the union of all pairwise most probable group-to-group paths in the groups graph. Examples of applications that could benefit from Single-Source-Multiple-Destinations and Multiple-Source-MultipleDestinations are those with high download demand and in which timely delivery is not essential, such as smartphones’ system updates or video advertisement. In the GROUPS-NET strategy, described in Section 3.4, only the most probable path is considered for forwarding the message. However, more than one path can be considered for forwarding a message. An interesting future work would be to propose an overhead constrained version of GROUPS-NET, which would add a maximumoverhead parameter to the algorithm. This way, GROUPS-NET would forward a message through the N most probable redundant group-to-group paths that involve at most the maximum tolerated number of nodes. The higher the maximum-overhead parameter is, the more similar to a flooding the forwarding will behave, since the flooding strategy forwards messages through all possible paths. In the case that the single most probable path involves more nodes than the maximum tolerated overhead, then the most probable path with less nodes than the maximum overhead would be chosen instead. This strategy would allow to decrease the base station bandwidth demand and, at the same time, control the D2D network overhead, a feature that is not possible in previous forwarding strategies. In addition to the aforementioned results, we show in Section 3.5 that an interesting open issue is on how to correctly model the role of social group meetings in the human mobility in order to synthesise better artificial mobility traces. Finally, our results reveal the need for evaluating D2D algorithms’ scalability, because previous state-of-the-art solutions seem to not fit well to large-scale networks.
Chapter 4 SAMPLER: Combining Spatial and Social Awareness 4.1
Chapter Overview
In the past decade, Delay Tolerant Networks (DTNs) have attracted a lot of attention and several algorithms have been proposed to enable cost-effective and timely delivery of data in such scenarios (Mota et al., 2014). In a DTN, a given content is forwarded device by device, from the source to the destination, using the intermittently connected structure of mobile networks. As aforementioned, with the increasing use of high data rate applications in cellular networks, which rely in heavy multimedia content such as videos, music, games, and social media, the use of the DTN paradigm has been proposed to facilitate high data rate transmissions among nearby users, offering the possibility of offloading the base station traffic demands through D2D Multi-Hop Communication. However, as presented in Table 4.1, previous social-aware strategies do not account for any geographic feature of the individuals’ mobility patterns and also of the scenario in question, e.g., its Points of Interest (PoI). The recently released NCCU trace (Tsai and Chan, 2015) brings an unprecedented opportunity to investigate this open issue, since it is the first available real world dataset to monitor not only users proximity contacts but also their geo-locations. With that in mind, in this chapter we propose SAMPLER (Social-Aware, Mobility, and PoI Routing) that, to the best of our knowledge, is the first opportunistic routing strategy to combine mobility, PoIs, and social-awareness to provide cost-effective content delivery in intermittently connected networks. SAMPLER works by forwarding messages to 47
48
Chapter 4. SAMPLER: Combining Spatial and Social Awareness
nodes of higher mobility, until the message reaches a static relay-point. Static relay points are strategically deployed at the most popular PoIs and forward their received content to nodes that belong to the social communities that the destination node also belongs to. Within such communities, the message is forwarded to the most popular nodes until it reaches the destination node. The explored properties of this strategy and the reasons for using each one of them are discussed in details in this chapter. Our experiments show that with the deployment of a few static relay points in a wide area, SAMPLER significantly increases the delivery ratio, reduces the network overhead, and enables faster delivery of messages, when compared to the state-of-the-art solution. ❵❵❵ ❵❵❵
❵❵❵
Property
❵❵❵
Algorithm ❵❵❵ Flooding Spray and Wait (Spyropoulos et al., 2005) Prophet (Lindgren et al., 2003) Bubble Rap (Hui et al., 2011) GROUPS-Net (Nunes et al., 2016d) SAMPLER
Probabilistic Model � �
Social
PoI
Individual Mobility
� � �
�
�
Table 4.1. Properties considered in the main DTN forwarding protocols
To the best of our knowledge, this is the first work to propose an algorithm that combines users’ mobility, points of interest and social awareness to improve forwarding cost-effectiveness. Moreover, this work is an empirical proof of concept that it is worth considering such properties together in the design of DTN protocols, serving as a reference baseline for such strategies. This chapter is organized as follows. Section 4.2 introduces the NCCU dataset. Section 4.3 explains the properties that we used to incorporate individual mobility patterns, social awareness, and PoIs to our algorithm. Section 4.4 describes the SAMPLER algorithm. In Section 4.5, SAMPLER is quantitatively evaluated and compared to Bubble Rap. Finally, Section 4.6 brings the final remarks and future work.
4.2
NCCU Trace
A people’s mobility trace consists of data collected from a monitoring system that records the people’s movements. The information contained in a trace is usually obtained from devices with geo-positioning capacity (e.g., smartphones) or by connectivity logs in wireless networks (e.g., Bluetooth, Wi-Fi). The usual goal of using mobility
4.3. SAMPLER Features
49
traces in the evaluation of communication protocols is to capture the performance of such protocols in real-world scenarios, allowing more reliable analysis. As extensively discussed in (Treurniet, 2014), synthetic mobility models cannot capture all properties of human mobility and, therefore, may lead to biased results. In the case of DTNs, this is especially harmful, because existent mobility models do not capture the impact of human social bonds in mobility. In this study, we combine multiple mobility and social properties, based on the characteristics we were able to capture from a real-world mobility trace. The NCCU trace registered 115 users moving on a campus throughout a 15 days period. An Android application collected their GPS data, application usage, Wi-Fi access points, and Bluetooth devices proximity information. These data were registered once every 10 minutes and contacts were detected when two users were less than 10 meters apart. To the best our knowledge, NCCU is the first public available dataset that registers pairwise contacts information and users’ geo-locations within a dense mobility scenario. The NCCU trace provides a new opportunity to combine multiple features in several types of mobility studies. Hence, we are especially interested in using geo-location and social features to design an opportunistic forwarding algorithm for cost-effective routing in DTNs. With that goal, we extract NCCU users’ mobility, popularity, PoIs, and social bonds. Below, we discuss each one of these properties and how they can be explored.
4.3
SAMPLER Features
The main contribution of this chapter is to show that it is worth combining information extracted from the user’s geo-locations with social context to improve the state-of-theart of forwarding strategies in DTNs. In this section, we individually explain the features we explore to design SAMPLER. Such features are also characterized using real data from the NCCU trace.
4.3.1
Social Awareness as Popularity
Currently, the most successful approaches for opportunistic forwarding are the socialaware strategies (Li et al., 2014). These strategies aim to identify the most popular nodes in order to use them to forward messages. In summary, most popular nodes are those who meet others more often. Hui et al. have proposed the C-Window metric (Hui et al., 2011), which measures nodes popularity as the average number of different encountered nodes throughout time windows of fixed length, e.g., 24 hours. The authors
50
Chapter 4. SAMPLER: Combining Spatial and Social Awareness
(a) Heat-map of NCCU mobility (b) Strategic deployment of four (c) Trajectories of users with difdepicting most popular places relay points with reach radius of ferent radius of gyrations 30m (red circles)
(d) Users’ radius of gyration (e) Nine social communities (f) Popularity of network users P.D.F. detected from NCCU contacts graph using the clique percolation method (each color represents a different community)
Figure 4.1. Mobility, PoIs and social features computed from the NCCU trace
have used diverse data sources to show that C-Window is highly correlated (up to 0.95 correlation) with the node betweenness centrality in the DTN network. Nodes’ betweenness centrality in DTNs is defined as the number of times that a given node belongs to the shortest path (the one with fewer re-transmissions) between two nodes. Thus, it makes perfect sense to use such information to decide whether to forward or not a message to an encountered node, i.e., a message should be preferentially forwarded to more popular nodes. In human society, people have different levels of popularity (Hui and Crowcroft, 2008). Thus, the main idea here is to use such heterogeneity to design more efficient forwarding schemes. For instance, Figure 4.1(f) presents the NCCU trace users’ popularities measured with the C-Window technique. It is possible to notice that few nodes have very high popularities, which means that a message forwarded to these strategi-
4.3. SAMPLER Features
51
cally selected nodes have high probability of reaching a given destination rapidly and with lower network overhead.
4.3.2
Social Communities
A second interesting approach to consider in the design of social-aware applications is the use of social communities. Communities in graphs are defined as groups of more densely interconnected nodes. By using social graphs, in which nodes are the network users and edges’ weights are the number of meetings between the pairs of nodes, it is possible to detect social communities. Among the algorithms for community detection in graphs, the Clique Percolation Method (CPM) (Palla et al., 2005) has remarked itself as one of the most effective methods once fed with correct parameters (Peel, 2010). Figure 4.1(e) depicts nine social communities detected from the NCCU social contact graph using the CPM. The use of social communities in DTN forwarding is interesting because a given message has a much higher probability to be delivered to the destination once it gets to any member of a community that the destination belongs to. As we observe in Figure 4.1(e), nodes within communities are more densely interconnected, as intuitively expected, and as a consequence of the definition of communities in graphs.
4.3.3
Users’ Individual Mobility
Several studies about human mobility show that people have different mobility patterns, which are mostly influenced by their daily routines. In this regard, a more detailed understanding of people mobility can provide significant insights towards the design of routing solutions to DTNs. There are studies in the literature that propose a single parameter to characterize the individual mobility of people. Gonzalez et al. (2008) have proposed the concept of radius of gyration, which quantifies the dynamic mobility of a person in relation to the center of mass of its movements. Radius of gyration of a given person (rg ) is computed as in Equation 4.1, where n is the total number of recorded positions for a given user, pi represents the ith position recorded for the user, and pcenter is the center of mass of the user’s recorded displacements, obtained as in Equation 4.2. � � n �1 � rg = � (pi − pcenter )2 n i=1
(4.1)
52
Chapter 4. SAMPLER: Combining Spatial and Social Awareness
(a) Delivery ratio
(b) Delivery time distributions as boxplots
Figure 4.2. Effect of relay points deployment in the flooding forwarding
n
pcenter
1� = pi n i=1
(4.2)
Figure 4.1(d) depicts the (Probability Distribution Function) P.D.F. of users’ radius of gyrations in the NCCU trace. We can see that most of the users have small radius of gyration (between 100 and 250 meters) and a few of them much higher mobility (above 400 meters). The radius of gyration is associated with the user’s displacement, therefore, it makes sense to forward messages to nodes with higher radius of gyration to increase the geographical coverage of a message in the network without needing to transmit copies of the messages to many nodes. Figure 4.1(c) presents the trajectories of three different users of the NCCU trace. The user 50 exemplifies a user with high radius of gyration, covering a considerable region. Conversely, user 43 has a low radius of gyration, covering a limited region.
4.3.4
Points of Interest
Although people have different behaviors, their mobility have some spatio-temporal intersections. For instance, it is common to see very distinct people (e.g. students, executives, retirees etc) being attracted constantly to the same geographical location (e.g. train station). Such locations, called Point of Interest (PoI), may be used for the deployment of static relay nodes. Each static relay node consists of a low-computational power device with communication and storage capabilities, similar to access points, but with no need for Internet connection. Its role in the network is to store and forward messages according to a given forwarding policy. Due to these characteristics, they have
4.4. Combining Features Toward Cost-Effective Forwarding
53
low financial cost. Figure 4.1(a) shows the heatmap of the frequency of visitations in the NCCU campus. Considering this frequency, Figure 4.1(b) depicts the strategic deployment of four relay points with communication radius of 30m (red circles). As we can observe, they were deployed at the most visited PoIs in the NCCU campus. As motivation, in Figure 4.2 we evaluate the performance of the flooding forwarding strategy when different numbers of relay points are added. The performance is measured by the delivery ratio (Figure 4.2(a)) and delivery time (Figures 4.2(b)). In a flooding forwarding, every time a node holding a message meets another node that does not have it, the message is propagated. Flooding represents the upper bound for the delivery ratio, but drastically increases the network overhead. Nevertheless, notice that even in this simple strategy the deployment of static relay points has its benefits. Below, we discuss more sophisticated ways to use static relay points to improve the delivery ratio without increasing the network overhead. In D2D multi-hop cellular communication scenarios, the mobile network operators would be responsible for deploying such infrastructure. The deployment of dedicated hardware to improve cellular communication is already considered in the context of small and femtocell networks (Andrews et al., 2012). The main difference here is that static relays are typically designed with a simpler and cheaper technology, not having the role of providing direct cellular connections to devices, but only the role of storing and forwarding messages. By using SAMPLER, we show that static relays enable traffic offloading, better network efficiency, and improved user’s experience. It is worth to mention that the use of static relay point in DTNs have been previously evaluated through the use of synthetic mobility models in (Shahbazi et al., 2012). However, as aforementioned, synthetic mobility models do not fully capture human sociability and, therefore, (Shahbazi et al., 2012) could not consider the combination of PoIs with social awareness, which is one of the contributions of this chapter.
4.4
Combining Features Toward Cost-Effective Forwarding
This section presents the SAMPLER algorithm. SAMPLER uses social communities and social popularity, as introduced in the original Bubble Rap scheme (Hui et al., 2011), but adding the individual mobility and PoI properties to them in way to increase the delivery ratio and reduce the network overhead.
54
Chapter 4. SAMPLER: Combining Spatial and Social Awareness
4.4.1
SAMPLER
SAMPLER adds PoIs and Individual Mobility awareness to the original Bubble Rap scheme. To explore the information about PoIs, we deploy static relay points at the most frequently visited points within the region of interest; in this case, the NCCU campus. As discussed above, such relay points consist of low-cost hardware, which work by storing and forwarding messages. We assume a 30-meter transmission radius for them. However, the addition of the relay points by itself does not increase the costeffectiveness of the forwarding strategy, since it could drastically increase the number of transmissions, generating more overhead. Because of that, SAMPLER combines PoIs and communities awareness to define the relay points forwarding policy. Instead of forwarding a message to any node that gets inside their range of transmission, relay points only forward messages to nodes that belong to the destination community, i.e., to a community that the destination node is part of. Since relay points are placed in the most popular areas, they will probably be in contact range with many different network nodes. Thus, the idea is for them to assume the role of extremely popular nodes that accelerate the message path towards the destination community. Moreover, relay points have higher popularity, and, thus, every mobile node always forward a message when it meets a relay point. An obvious shortcoming of static relay points is their static location. To address this issue, SAMPLER adds Individual Mobility awareness to the forwarding scheme. Instead of setting the nodes’ GlobalRank as the nodes’ popularity, SAMPLER uses the nodes radius of gyration, which measures their average displacements. Thus, a message is forwarded to nodes that have higher mobility until it gets to a relay point. Once the message is inside the destination community, the forwarding policy works as in Bubble Rap, transmitting the message to nodes with higher popularity within that community until the message gets to the destination. In summary, SAMPLER works as follows: 1. GlobalRank is set to the nodes’ radius of gyration; 2. LocalRank is set to the nodes’ popularity (C-Window metric) within the destination community; 3. The message is always forwarded if the encountered node is the destination; 4. Every time a mobile node encounters a static relay point that doesn’t have the message yet, the message is forwarded;
4.4. Combining Features Toward Cost-Effective Forwarding
Figure 4.3. SAMPLER algorithm functioning
55
56
Chapter 4. SAMPLER: Combining Spatial and Social Awareness
5. Upon encountering a node that belongs to the destination community, the relay point forwards the message; 6. Outside the destination community the message is forwarded if the GlobalRank of the encountered node is higher than the GlobalRank of the node that has the message; 7. Inside the destination community the message is forwarded if the LocalRank of the encountered node is higher than the LocalRank of the node that has the message. SAMPLER’s key ideas are quite intuitive. Nodes with higher mobility help the messages to get at relay points through a mobility-based forwarding strategy. Since relay points are placed in very popular areas, they meet many nodes, helping the message to get inside the destination’s community faster and with less overhead. Finally, a popularity-based forwarding scheme is used within the destination community to deliver a message to its destination node. Figure 4.3 illustrates these principles. In the following, we comparatively evaluate SAMPLER and Bubble Rap.
4.5 4.5.1
Results Experimental methodology
With the goal of comparatively evaluating SAMPLER and Bubble Rap, we used the following traditional DTN metrics: • Delivery ratio: Evaluates the percentage of successfully delivered messages for different values of Time To Live (TTL). • Number of transmissions: Measures the network overhead, i.e., the number of device-to-device transmissions that each algorithm performs for different TTLs. • Delivery Time: Measures the average time a message takes to get from the source node to its destination node. The algorithms were tested for different numbers of relay points by emulating their forwarding policies in the NCCU trace. In each test campaign, we consider every possible (origin, destination) pair 1 , i.e., 115 × 114 forwarding emulations were done for each algorithm, for each number of relay points. 1
Since all possible (origin, destination) pairs were emulated, the experiments results are deterministic. Therefore, confidence intervals are not presented
57
4.5. Results
(a) Delivery – 5 Relay Points
(b) Transmissions – 5 Relay Points
(c) Delay – 5 Relay Points
(d) Delivery – 10 Relay Points (e) Transmissions – 10 Relay Points
(f) Delay – 10 Relay Points
(g) Delivery – 20 Relay Points (h) Transmissions – 20 Relay Points
(i) Delay – 20 Relay Points
Figure 4.4. Performance comparison of Bubble Rap, Relay-Bubble and SAMPLER in the NCCU dataset
We also have the goal of separately evaluating the contribution of the relay points and of the combination of relay points with the use of the radius of gyration in the GlobalRank parameter. With that purpose, in addition to SAMPLER, we propose
58
Chapter 4. SAMPLER: Combining Spatial and Social Awareness
Relay-Bubble that only accounts for PoIs. We compute each of the aforementioned metrics for three variations of the algorithms: • The original Bubble Rap without using relay points (PoI awareness) and without using the node’s radius of gyration (mobility awareness). • Relay-Bubble in which we add the relay points (PoI awareness) to get a message inside the destination community, but use both GlobalRank and LocalRank as the node’s popularity. • SAMPLER which uses the relay points (PoI awareness) to get a message inside the destination community and uses the radius of gyration as the GlobalRank (mobility awareness) and the LocalRank as the node’s popularity (C-Window metric).
4.5.2
Performance Evaluation
The algorithms were evaluated with several different numbers of relay points covering the k most popular PoIs. The results for k = 5, 10, 20 are presented in Figure 4.4. The experiments in the NCCU trace show that SAMPLER, even with a few relay points, reaches higher delivery ratio than Bubble Rap for different message TTLs (Figure 4.4(a)). As the number of relay points increases (Figures 4.4(d) and 4.4(g)), the delivery ratio of SAMPLER becomes significantly higher. As expected, similar improvement is observed with respect to the average delivery time (Figures 4.4(c), 4.4(f) and 4.4(i)). Considering the delivery ratio and the delay, Relay-Bubble has a performance similar to SAMPLER, having slightly better results in cases with few relay points. However, the most significant contrast is observed in the network overhead (Figures 4.4(b), 4.4(e) and 4.4(h)). When comparing the number of transmissions that each algorithm performs over time, we notice that, for all considered numbers of relay points, RelayBubble is the most expensive strategy, followed by Bubble Rap. On the other hand, SAMPLER incorporates mobility awareness to achieve up to 70% lower overhead than the other strategies. Considering the three metrics, SAMPLER remarks itself as the most cost-effective strategy among the three evaluated algorithms.
4.5.3
Discussion
The first observation that stands out from the presented results is the relevance of the usage of PoIs in DTN/D2D routing. While both strategies based on PoIs perform better
4.6. Final Remarks
59
with enough relay points, Relay-Bubble overcomes Bubble Rap’s in both, delivery ratio and delay, even with a few relay points, despite being based only on the popularity as Bubble Rap. Since both algorithms forward messages based only on node’s popularity, the usage of relay points deployed at PoIs, enhances the chances of a message to get to the target community faster. SAMPLER also takes advantage of PoIs awareness. As described before, once the message gets to a relay point, SAMPLER works just like Relay-Bubble and, therefore, the difference in the results is only due to the usage of the node’s radius of gyration at the“outside-community” forwarding policy. Since nodes with higher radius of gyration have better geographical coverage, using them increase the chances of delivering the messages to a relay point with few re-transmissions, what reduces the network overhead without compromising delivery ratio and messages’ average delay. Finally, the overall results show that SAMPLER performs significantly better than Bubble Rap and Relay-Bubble. In fact, SAMPLER is a promising approach for improving DTN/D2D routing, since it takes advantage of social awareness, PoIs and individual mobility patterns.
4.6
Final Remarks
In this chapter, we have introduced the use of spatial information together with social awareness to improve the cost-effectiveness in multi-hop D2D opportunistic routing. We have discussed spatial and social properties of mobility and how these properties can be retrieved from mobility traces and used in opportunistic routing. As a proof of concept, we proposed the SAMPLER forwarding algorithm. A scheme that combines four different features: nodes’ popularity, individual mobility patterns, PoIs, and social communities. SAMPLER exemplifies how the combination of such features is able to provide significant improvements enabling higher content delivery ratio while reducing the network overhead and the average delivery time of messages. SAMPLER remarks itself not only as a proof of concept that it is worth considering such properties when designing opportunistic forwarding protocols, but also as a novel reference protocol for cost-effective forwarding in D2D multi-hop networks. When designing SAMPLER, we have focused on providing a simple algorithm, in order to illustrate how the combination of the spatial and the social features can result in huge improvements. From this initial idea, one can propose several different sophisticated combinations for these two worlds. When considering the combination of such domains several limitations and open issues arise.
60
Chapter 4. SAMPLER: Combining Spatial and Social Awareness
Social mobility is still an open issue for mobility modeling. Since real mobility data collection is a hard and expensive process, the validation of ad-hoc networks’ protocols often rely on synthetic traces generated following mobility models which try to reproduce patterns observed in real traces. As we mentioned before, SAMPLER could not be validated by using synthetic models because mobility and social modeling evolve through separate paths. Although there are several mobility and social models, there is no model that captures the statistical properties of both aspects, mobility and social, and mimic how the two aspects influence each other. Currently, the NCCU trace is the only available tool for validating these approaches. If such models exist, it would be possible, for example, to evaluate proposals to combine spatial and social features in larger scale networks, with a higher number of users, which is not possible yet. There is plenty of opportunities for exploring different spatial and social features in addition to those considered here. For instance, several studies indicate the presence of strong regularity patterns in human displacements. Prediction models can be derived from such regularity and applied to opportunistic forwarding. Moreover, recent work has shown the existence of a dichotomy in human mobility patterns. More specifically, results in Pappalardo et al. (2015b) indicate that human beings can be separated into two classes: returners and explorers. It would be interesting to consider the role of such dichotomy in the forwarding process of mobile networks. As for social features there are studies that investigate different social aspects which might have advantages in relation to communities. In (Nunes et al., 2016d), for instance, the use of group meetings awareness is proposed as an alternative measure of social context, since community detection is a hard task to perform in real-world distributed networks. As another future direction we highlight the further exploitation of the PoIs’ semantics, i.e., the motivation behind users transitions between PoIs and their regularity.
Chapter 5 GRM: Group Regularity Mobility Model 5.1
Chapter Overview
In this chapter we propose, implement and evaluate GRM, a novel mobility model that accounts for the role of group meeting dynamics and regularity in human mobility. Specifically, we show that the existent mobility models do not capture the regularity of human group meetings which is present in real mobility traces. Next, we characterize the statistical properties of such group meetings in real mobility traces and design GRM accordingly. We show that GRM maintains the typical pairwise contact properties of real traces such as contact duration and inter-contact time (ICT) distributions. In addition, GRM accounts for the role of group mobility, presenting group meetings regularity and social communities structure. Finally, we evaluate the state-of-the-art social-ware protocols for opportunistic routing using a synthetic contact trace generated by our model. The results show that the behavior of such protocols in our model is similar to their behavior in real mobility traces. In the past years, several mobility models were proposed with the goal of reproducing one or more statistical properties of the human mobility. Examples of such properties include human walks and displacements (Gonzalez et al., 2008; Rhee et al., 2011), the spatial regularity of human mobility (Pappalardo et al., 2015a; Ekman et al., 2008), human trajectories and transportation (Silveira et al., 2016; Silva et al., 2015), pairwise encounter patterns (Mei and Stefa, 2009; Lee et al., 2009), and group mobility (Hong et al., 1999; Blakely and Lowekamp, 2004; Musolesi and Mascolo, 2006). Among those, the group mobility property is already considered a fundamental 61
62
Chapter 5. GRM: Group Regularity Mobility Model
building block for mobility modeling (Treurniet, 2014). However, the existent group mobility models focus on modeling groups that remain together throughout the whole simulation time. Therefore, such models are not representative of the statistical regularity of human interactions, i.e., groups of people that meet regularly. Although earlier works on mobility modeling have focused on reproducing the regularity of human contacts (Lee et al., 2009; Mei and Stefa, 2009), these models only focus on reproducing the regularity of pairwise interactions, i.e., they only model contacts between two people, disregarding collective social interaction. In other words, they do not account for the role of group meetings. This limitation is specially harmful to the validation of opportunistic forwarding protocols (e.g., DTN (Zhu et al., 2013) and D2D (Asadi et al., 2014) protocols), because the social-aware strategies (Hui et al., 2011; Li et al., 2014) have remarked themselves as the most effective for this types of protocols. As a direct consequence, none of the existent mobility models fit for evaluating the sociallly aware approaches for opportunistic routing, since they do not completely capture the social regularity presented by human mobility. Aiming to address the aforementioned issues, in this work, we propose the Group Regularity Mobility (GRM) Model. According to our experiments (in Sec. 5.2), performed in the widely used state-of-the-art mobility models, GRM is the first mobility model to consider the role of group meetings and their regularity to simulate human mobility. We show that the social community structure of the mobile network, the group meetings regularity, and the statistical patterns of inter-contact times and contact durations, which are present in real world contact traces are also present in GRM. Moreover, we evaluate two state-of-the-art opportunistic forwarding protocols and show that their performance in a synthetic trace generated by GRM is similar to their performance in real world traces. In summary, the contributions of the present chapter are threefold: • We empirically show that the existent mobility models for opportunistic networking do not present group meetings regularity. • We use the two publicly available data-sources with largest scale, in time duration and number of nodes, to leverage and characterize the group meetings properties and design GRM, the first mobility model to capture the role of group mobility and its regularity. • We evaluate GRM and show that it has the same statistical properties of real mobility traces, considering inter-contact times, contact durations, social community structure, and group mobility regularity. More importantly, we show that
5.2. Group Mobility: Real World vs Synthetic Models
63
the state-of-the-art socially aware opportunistic forwarding protocols present the same performance in GRM as they do in real mobility traces. This chapter is organized as follows. In Sec. 5.2 we evaluate the state-of-theart mobility models and show that they are not representative of the group mobility regularity which is present in real world mobility traces. In Sec. 5.3 we describe the GRM model, providing an in depth discussion of each one of the building blocks used in the model design. In Sec. 5.4 GRM is statistically characterized and compared to real world traces. The results confirm that GRM performs accordingly.Sec. 5.5 evaluates the performances of forwarding algorithms in GRM. Finally, Sec. 5.6 brings the final remarks and future work.
5.2
Group Mobility: Real World vs Synthetic Models
In this section, we compare some of the state-of-the-art and widely used synthetic mobility models with real mobility traces, with the goal of verifying if group meetings’ regularity properties are captured by such models. More specifically, we show that such models are not able to capture group encounters and their regularity over time. This opens the opportunity for the development of a model aware of such properties, so that network protocols may be validated in scenarios with group mobility. First, we apply the temporal-graph based methodology for detecting and tracking groups, described in Nunes et al. (2016c), to two real mobility traces, MIT and Dartmouth. Figures 5.1(a) and 5.1(b) show the Probability Density Function (PDF) of group meetings over time for the real-world traces. In both real mobility traces, we can verify the presence of periodicity in groups’ encounters. By looking at both of them, we see that the mass of probability is concentrated in peaks around the red dotted lines, which represent periods of 24 hours. We also observe in Figures 5.1(a) and 5.1(b) that higher peaks happen around the green dashed lines, which mark periods of seven days. This pattern in the group meetings’ PDF shows that group meetings present daily and weekly periodicity. It is noteworthy that such pattern is observed in both real traces, even though they are from different places, have different number of nodes, and used different data collection methods. Next, we leverage three widely used state-of-the-art synthetic mobility models to verify how well they are able to represent the role of social groups in human mobility.
64
Chapter 5. GRM: Group Regularity Mobility Model
(a) MIT (Real)
(b) Dartmouth (Real)
(c) SWIM (Synthetic)
(d) WDM (Synthetic)
Figure 5.1. Comparison of group meetings regularity in real and synthetic mobility traces
The SWIM mobility model (Mei and Stefa, 2009) generates synthetic small worlds that preserve the pairwise contact duration and inter-contact times statistical distributions as they are observed in real mobility traces. The SLAW mobility model (Lee et al., 2009) was designed to capture several significant statistical patterns of human mobility, including truncated power-law distributions of human displacements, pause-times and pairwise inter-contact times, fractal way-points, and heterogeneously defined areas of
5.2. Group Mobility: Real World vs Synthetic Models
65
Figure 5.2. Group meetings regularity in our model
individual mobility. The Working Day Movement (WDM) synthetic model (Ekman et al., 2008) was designed to capture the same statical properties of contact durations and inter-contact times as in SWIM and SLAW. In addition to those properties, WDM aims to capture the daily regularity of human movements, i.e., how human routines alter their mobility. As we did for the real traces, MIT and Dartmouth, we have applied the same group detection and tracking methodology to the contact traces generated by these three synthetic models. Figures 5.1(c) and 5.1(d) present the results for the SWIM and WDM models, respectively. Observe that the contact trace generated by the SWIM model (Fig. 5.1(c)) does not present any regularity in group meetings. Out of the detected groups, only three group re-meetings were registered in a period of 15 days. The same behavior was presented by the contact trace generated by the SLAW model (figure omitted), i.e., no regularity in group meetings. This result is explained by the fact that such models were designed to represent the statistical properties of pairwise contacts only, without considering that human contacts often involve more than two peers during the same time. Thus, these models only consider pairwise contacts, disregarding group meetings. Regarding the WDM trace (Fig. 5.1(d)), we observe that group re-meetings happen precisely in periods of 24 hours and with much higher frequencies than in real mobility traces. This behavior is observed because WDM first defines a set of places, called offices, and then distributes the nodes to transit among pre-defined subsets of offices with daily periodicity. Therefore, nodes with intersections in their lists of offices
66
Chapter 5. GRM: Group Regularity Mobility Model
will always form groups with exaggerated and caricatured meeting regularity. By analysing the group meetings’ regularity of the synthetic models, we conclude that none of them represent well the group mobility patterns observed in real traces. Therefore, in Sec. 5.3, we propose GRM, a group dynamics aware mobility model that comprises the statistical properties of group meetings regularity. In contrast with the existent mobility models, GRM is able to produce mobility traces that present group meetings regularity, as shown in Fig. 5.2.
5.3
The GRM Model
In this section, we describe GRM in details. We go over each of the building blocks that are contained within the model. Fig. 5.3 presents the GRM functioning framework. GRM receives as input a social network, which can be a real social network, provided by the user, or generated by a synthetic social network model. This social network is simply an undirected graph, where each node is a person and there is an edge between two nodes if they share a social relationship (e.g., friendship). The implementation of GRM presents native support for several social network models including Barabasi-Albert (Barabási and Albert, 1999), Gaussian Clustering (Brandes et al., 2003), Caveman (Watts, 1999), and Random Partition Graph (Fortunato, 2010) models. The social network is used to define which nodes will be present at each group meeting event, i.e., the groups’ structures, as discussed later in this section. The idea of having the social network as input for the model is to provide flexibility for the mobility modeling and allow the social network modeling to evolve separately. GRM adapts to any social network given as input. Fig. 5.4 exemplifies social networks that are supported by GRM. In addition to the social network, GRM also receives as input a set of simulation parameters, which comprise, for instance, the size of the simulated area, the simulation duration, the number of nodes, and the number of groups. Finally, it also receives a set of statistical parameters, which are the parameters for the statistical distributions contained in the model. Such statistical parameters may vary depending on the scenario, thus it is wise to let the user decide their values. The synthetic traces generated by GRM are fully compatible and are ready to run on the ONE simulator (Keränen et al., 2009). From now on, please refer to Table 5.1 for a summary of the notation we will use through the description of our proposed model.
67
5.3. The GRM Model
Table 5.1. Notation summary
Notation
Description
T
The trace duration
N odesSet
The set of all network nodes
Gi
The ith group of nodes in the trace
||Gi ||
The number of group members of Gi
T Gi
The existence period of group Gi
µG i
The average inter-meeting time for Gi
M eetingGi (t)
The time for the tth meeting of Gi
DurGi
The duration of Gi group meetings
u ∼ U (a, b)
u ∈ R is a value randomly selected with uniform probability in the interval [a, b]
η ∼ N (µ, σ 2 )
η ∈ R is a value randomly selected with a Gaussian distribution of mean µ and variance σ 2
ρ ∼ P L(α, β)
ρ ∈ R is a value randomly selected with a truncated Power Law distribution with exponent α and the exponential cut-off value β
Patt [Uj , Gi ]
The probability of user Uj attending to a meeting of group Gi
Pplace (Cj , Gi )
The probability of a meeting of group Gi to happen at the Cj cell
68
Chapter 5. GRM: Group Regularity Mobility Model
Figure 5.3. GRM Model Framework
5.3.1
Group Meeting Times
To properly design a group regularity mobility model, there must be a representative statistical model for group meeting times. Due to group meetings’ periodicity, presented in Fig. 5.1, we model group meeting times as follows. Each group Gi in the model receives an average inter-meeting time, µGi . The value of µGi is randomly generated according to a power-law distribution with exponential cut-off. This way of generating µGi is based on the fact that inter-contact times of real mobility traces follow this distribution (as discussed in Sec. 5.1). The power-law exponent (αgmt ) and the exponential cut-off value (βgmt ) are statistical parameters given as input to the model. Then, a series of meeting times for group Gi is recursively generated with Gaussian inter-meeting times, as in Eq. 5.1:
M eetingGi (t) =
µGi ∼ P L(αgmt , βgmt ) u ∼ U (0, T )
if t = 0
(5.1)
M eeting (t − 1) + η ∼ N (K × µ , σ 2 ) if t > 0 Gi Gi
Here, each group Gi has its own µGi . The variance σ 2 , however, is a single simulation parameter for all groups. This parameter allows higher of lower variation on the group meetings’ punctuality, according to the Gaussian distribution variance properties. Following the recursive Eq. 5.1, for group meetings generation, each group will then have its set of meetings determined as: TG
� K×µi
�Gi
j=0
�
M eetingGi (j)
(5.2)
69
5.3. The GRM Model
(a) Dartmouth (Real Trace)
(b) Barabasi-Albert (Synthetic Network Model)
(c) Ex1 of Gaussian Clustering Model (Synthetic (d) Ex2 of Gaussian Clustering Model (SynNetwork Model) thetic Network Model)
Figure 5.4. Examples of social network models which can be given as input to GRM. Different colors denote communities detected in such networks
where TGi denotes the period of time throughout which the group Gi will exist. GRM considers that each group Gi has its own regularity factor, which is represented by the scale factor K in Eq. 5.1. For instance, most of the groups with K = 24h will usually meet at every 24, 48, or 72 hours, following the power-law probability function for generating µGi values. K is a multiplier that will generate the periodical behavior of real traces, depicted in Fig. 5.1, while the value of µGi , generated by a truncated
70
Chapter 5. GRM: Group Regularity Mobility Model
power law, will generate statistically representative inter-contact times. Since each group has its own K value, the distribution for the values of K is given to the model as a simulation parameter. An example would be: “The simulation will have 500 groups; 70% of these groups will have K = 24h, 15% will have K = 7days, and 15% K = 6h”. In Sec. 5.4, we show that this example of configuration for the K distribution generates group re-meetings that are very similar to the ones observed in the MIT and Dartmouth traces.
5.3.2
Group Meetings Durations
Since we have generated the group meeting times, we now must define the duration of a group meeting, i.e., the time that the involved nodes will spend together. To do so, we inherit the findings of previous studies (as discussed in Sec. 5.1), which show that contact durations follow truncated power laws. Therefore, as we did for µGi in Eq. 5.1, we define the meeting durations as: DurGi ∼ P L(αdur , βdur )
(5.3)
where αdur and βdur are statistical parameters of GRM.
5.3.3
Groups’ Structure and Social Context
So far we have defined how to generate group meeting times and their durations. Now we discuss how we define which nodes will be at each meeting, i.e., the groups’ compositions. The first step to define group structures is to verify the group sizes in real mobility traces. In Fig. 5.5, we show that group sizes in the MIT and the Dartmouth traces follow power laws with exponential cuts with different parameters. Therefore, the number of group members in Gi is defined as: ||Gi || ∼ P L(αsize , βsize )
(5.4)
where αsize and βsize are the last couple of statistical parameters of GRM. GRM defines the network nodes that will compose a given group Gi using the size ||Gi ||, defined by Eq. 5.4, and a probabilistic snowball sampling algorithm (Berg, 1988). To do so, a node n is randomly selected, with uniform probability, from the set of network nodes. The snowball algorithm randomly selects a set of neighbors of n. Next, it selects a random set of neighbors of neighbors of n, and so on, until the set of selected nodes reach the predetermined size ||Gi ||. The selected set of nodes
71
5.3. The GRM Model
(a) α = 2.24; β = 30.4. Average group size of (b) α = 2.42; β = 54.6. Average group size of 6.06 6.96
Figure 5.5. Group sizes: empirical data from the MIT and Dartmouth traces and their fitting to data generated by power laws of exponents α and exponential cuts β.
will compose the group Gi . The snowball sampling is performed in the inputted social network (see Fig. 5.4 for examples), thus the snowball sampling preserves the social context of such network. In summary, the structural composition of a group is defined as: N oden = U (N odesSet) (5.5) M embersGi = Snowball(N oden , ||Gi ||, SocialGraph) At this point, it is worth emphasizing that, as it happens in reality, one node may participate of several social groups. In addition, the number of possible group structures is combinatorial in relation to the number of nodes. In practice, the number of groups detected in a real mobility trace is larger than the number of nodes. For instance, five thousand different groups were detected in the Dartmouth trace, which only monitors 1200 nodes. Also, in reality, it is not reasonable to expect every node to always attend to every meeting of a given group. In GRM, each user Uj , that is a member of group Gi , receives a probability Patt [Uj , Gi ] of attending to a Gi meeting as: Patt [Uj , Gi ] =
Known(U serj , Gi , SocialGraph) ||Gi ||
(5.6)
The intuition behind the Patt probability is that people have higher probability
72
Chapter 5. GRM: Group Regularity Mobility Model
to attend to meetings of social groups in which they know more nodes. The Known function returns the number of nodes in Gi that have social edges with Uj in the input social network SocialGraph. Using such modeling, each social group in the trace will have a different composition at each meeting, but, at the same time, maintaining most of its structure throughout all of its meetings. Such behavior is also presented in social relationships of real life (Nunes et al., 2016c).
5.3.4
Mobility and Meeting Places
The final step of GRM is to generate the network nodes’ mobility based on the group meetings defined in the previous sections. GRM mobility is inspired by the SWIM mobility model (Mei and Stefa, 2009). However, instead of defining the nodes’ trajectories based on individual decisions, the group defines its meeting places to provide a common benefit to its members. As in SWIM, GRM defines a home for each node with uniform probability. Then the simulation space is divided in equally sized square cells, and each group G i assigns to each cell Cj a weight W (Cj , Gi ), which is proportional to the average distance of that cell to the homes of each of the members of Gi : U� k ∈Ga 1 W (Cj , Gi ) = dist(Home(Uk ), Cj ) ||Gi ||
(5.7)
Similarly to the SWIM model, in GRM the dist function has a power-law decay with the euclidean distance, which enables the generation of truncated power-law flights in the users displacements (Gonzalez et al., 2008). Finally, each cell C j receives a probability of hosting the group Gi meeting as: W (Cj , Ga ) Pplace (Cj , Gi ) = �Ncells i=0 W (Ci , Ga )
(5.8)
where Ncells denotes the total number of cells in the model space. In GRM, the nodes transition between their homes and their group meetings. If the next group meeting is to happen before the necessary time for a node to arrive at home, the nodes transition directly between the two meeting places.
5.4. Evaluation
5.4
73
Evaluation
A mobility model must represent well the properties it aims to capture. In this section we show that the mobility traces generated by GRM maintain typical characteristics of real mobility that are fundamental for mobile opportunistic networking protocols. The first property that we evaluate in GRM is the pairwise inter-contact time. The inter-contact time is an important metric because it measures the time between the contacts of pairs of nodes, which are the opportunities to forward messages in real networks. Several studies (Mei and Stefa, 2009; Chaintreau et al., 2007; Leguay et al., 2006) have used a wide number of real-world traces to show that the inter-contact time and contact duration distributions follow truncated power laws. Fig. 5.6(a) compares the distribution of inter-contact times for the GRM and the Dartmouth traces. We see that the inter-contact time distribution of GRM conforms with the one presented in the Dartmouth trace. Both of them follow power laws with exponential cut-offs, conforming with the results for the real-world mobility reported in previous studies. In Fig. 5.6(b), we see that the contact duration distribution also follows a power law, conforming with the distributions shown in real human mobility. The contact duration is important because it determines the amount of data that can be transferred during a given contact. Fig. 5.6(c) shows that GRM indeed simulates well the regularity of group meetings. We see that the distribution of group re-meeting times is very similar to the ones of real mobility traces (Figs. 5.1(a) and 5.1(b)). It presents peaks at periods of 24 hours and seven days, remarking the presence of daily and weekly periodicity. This result confirms that GRM fulfills its purpose of properly modeling the role of group meetings regularity in human mobility. Finally, Fig. 5.6(d) presents a very important result. It illustrates communities detected in the GRM trace using the Clique Percolation Method (Palla et al., 2005). Such result confirms that, by generating regular group meetings composed of members that share social bonds (defined in the social network input), the social community structure emerges naturally in the mobile network. Therefore, the traces generated by GRM are representative of the social context involved in human mobility.
5.5
Opportunistic Forwarding in GRM
One of the most important characteristics of a mobility model is to mimic well the behavior of networking protocols. Hence, in this section, we evaluate how some of
74
Chapter 5. GRM: Group Regularity Mobility Model
(a) Inter-contact time CCDF
(b) Contact Duration CCDF
(c) Group Meetings Regularity
(d) Community structure (each collor represents a different community)
Figure 5.6. Important properties for opportunistic forwarding extracted from GRM.
the state-of-the-art protocols for opportunistic networking perform on GRM. Since the social-aware strategies are remarkably the most successful for this type of network, we focus our analysis on them. Namely, we evaluate the performance of Flooding, Bubble Rap (Hui et al., 2011), and Groups-Net (Nunes et al., 2016d) strategies. In the evaluation we consider the following traditional metrics: • Delivery ratio: Evaluates the percentage of successfully delivered messages for
75
5.5. Opportunistic Forwarding in GRM
Table 5.2. Simulation parameters
Parameter
Scenarios GRM-100
GRM-1000
#Nodes
100
1000
#Groups
500
5000
Sim. duration
60 days
Groups duration
30 days
Grid
30 x 30
Cell size
50
αgmt
2
βgmt
30 days
αdur
2
βdur
30 days
αsize
2.24
2.42
βsize
30
50
K Social Network
70%-24h; 15%-7days; 15%-6h Gaussian Random Partition (Brandes et al., 2003)
different values of Time To Live (TTL). • Number of transmissions: Measures the network overhead, i.e., the number of device-to-device transmissions that each algorithm performs for different TTLs. Opportunistic forwarding algorithms usually have the goal of providing costeffective message delivery, i.e., the highest possible delivery ratio with the lowest possible network overhead. To evaluate the algorithms in GRM, we have generated two experimental simulation scenarios containing 100 and 1000 nodes. The simulation parameters for each scenario is specified in Table 5.2. Each of the protocols were executed with 10000 randomly generated (origin,destination) pairs. The start time for each message propagation is also randomly selected within the trace duration time. Fig. 5.7 presents the performance of the three considered protocols in synthetic traces generated by the GRM model. The result shows that the performances of such algorithms in GRM conforms with their performances in real mobility traces, as reported in the original works (Hui et al., 2011; Nunes et al., 2016d). They present
76
Chapter 5. GRM: Group Regularity Mobility Model
(a) Delivery (100 nodes)
(b) Overhead (100 nodes)
(c) Delivery (1000 nodes)
(d) Overhead (1000 nodes)
Figure 5.7. Flooding and Bubble Rap performances in GRM synthetic trace with 100 nodes
high delivery ratios which are comparable to the flooding delivery. On the other hand, by exploring the social context, in the form of communities in Bubble Rap, and in the form of group meetings awareness in Groups-Net, such protocols provide low network overhead, since they only forward messages to the appropriate nodes. With the increase in the number of nodes in the network, from 100 to 1000, we see that the flooding overhead grows extremely fast, as expected due to its promiscuous forwarding policy. In the trace with 100 nodes, Bubble Rap presents lower overhead
5.6. Final Remarks
77
than Groups-Net. When the number of network nodes increases, the overhead of Groups-Net becomes smaller than the Bubble Rap’s overhead. As discussed in (Nunes et al., 2016d), the Bubble Rap’s overhead presents linear increase with the number of nodes in the network. This behavior is explained by the greedy nature of Bubble Rap’s algorithm. On the other hand, Groups-Net’s overhead remains stable, improving its performance in large scale scenarios.
5.6
Final Remarks
In this chapter we have designed and evaluated GRM, a novel mobility model to represent group meetings regularity and its impact on human mobility. We show that GRM preserves the properties of human mobility that are fundamental for opportunistic networking, namely, ICT and Contact Duration distributions, social community structures, and group meetings regularity. Moreover, we show that GRM mimics well the performance of opportunistic forwarding protocols in real mobility traces, including group meetings based forwarding. Mobility traces generated by GRM and its source code are publicly available. The existence of a representative social mobility model, such as GRM, enables several opportunities for future research in social aware forwarding in D2D Network. For instance, it would be interesting to evaluate how the existent forwarding schemes for D2D networks perform in larger scale networks with thousands of network nodes. Finally, we emphasize the possibility of extending GRM to incorporate other mobility features, such as realistic trajectories and different popularities for different regions in the trace.
Chapter 6 Conclusion Throughout this work we have addressed important aspects related to mobility and multihop D2D communications. Firstly, we discuss the use of mobile opportunistic networking for providing data offloading in the next generation cellular networks. After surveying the field we verified that the state-of-the-art solutions for this type of communication involve social awareness. We have leveraged the practical problems of using community detection in social aware forwarding schemes and proposed the use of group meetings awareness as an alternative measure for social context. As a first step, we have proposed a group meetings detection scheme and we characterize the properties of such group meetings. We verified that some properties, such as group meetings regularity make it interesting to use them for opportunistic forwarding. Therefore we propose GROUPS-NET, a forwarding algorithm that uses group meetings awareness to cost-effectively deliver content in multi-hop D2D networks. Later on, aiming to verify if it is worth to consider the combination of spatial and social properties in the design of forwarding protocols we propose SAMPLER, the first forwarding protocol to combine PoIs, individuals’ mobility patterns, and social awareness. We show that, though the combination of such properties, SAMPLER achieves better cost effectiveness in D2D forwarding. The proposed protocols were validated in real world traces, because the existent synthetic traces, generated by mobility models, do not capture important features of human mobility, i.e., social context and group meetings regularity. With that in mind, as a final contribution, we have proposed GRM, the first human mobility model to properly capture group meetings regularity and social context, as they appear in the real world, together with the ICT and contact duration patterns. The contributions of each part of this work are described in details in the previous chapters. At the end of each chapter we also provide discussions of interesting 79
80
Chapter 6. Conclusion
possibilities for future work related to the contribution presented in that chapter.
Bibliography Abrahao, B., Soundarajan, S., Hopcroft, J., and Kleinberg, R. (2012). On the separability of structural classes of communities. In Proceedings of the 18th ACM SIGKDD international conference on Knowledge discovery and data mining, pages 624–632. ACM. Andrews, J. G., Claussen, H., Dohler, M., Rangan, S., and Reed, M. C. (2012). Femtocells: Past, present, and future. Selected Areas in Communications, IEEE Journal on, 30(3):497–508. Asadi, A., Wang, Q., and Mancuso, V. (2014). A survey on device-to-device communication in cellular networks. IEEE Communications Surveys & Tutorials, 16(4):1801– 1819. Aung, C. Y., Seet, B. C., Zhang, M., Xie, L. F., and Chong, P. H. J. (2015). A review of group mobility models for mobile ad hoc networks. Wireless Personal Communications, 85(3):1317–1331. Barabási, A.-L. and Albert, R. (1999). Emergence of scaling in random networks. science, 286(5439):509–512. Bauza, R., Gozalvez, J., and Sanchez-Soriano, J. (2010). Road traffic congestion detection through cooperative vehicle-to-vehicle communications. In Local Computer Networks (LCN), 2010 IEEE 35th Conference on, pages 606–612. IEEE. Berg, S. (1988). Snowball sampling—i. Encyclopedia of statistical sciences. Blakely, K. and Lowekamp, B. (2004). A structured group mobility model for the simulation of mobile ad hoc networks. In Proceedings of the second international workshop on Mobility management & wireless access protocols, pages 111–118. ACM. Boldrini, C. and Passarella, A. (2010). Hcmm: Modelling spatial and temporal properties of human mobility driven by users’ social relationships. Computer Communications, 33(9):1056–1074. 81
82
BIBLIOGRAPHY
Brandes, U., Gaertler, M., and Wagner, D. (2003). Experiments on graph clustering algorithms. In European Symposium on Algorithms, pages 568–579. Springer. Calabrese, F., Pereira, F. C., Di Lorenzo, G., Liu, L., and Ratti, C. (2010). The geography of taste: analyzing cell-phone mobility and social events. In Pervasive computing, pages 22–37. Springer. Candia, J., González, M. C., Wang, P., Schoenharl, T., Madey, G., and Barabási, A.L. (2008). Uncovering individual and collective human dynamics from mobile phone records. Journal of Physics A: Mathematical and Theoretical, 41(22):224015. Chaintreau, A., Hui, P., Crowcroft, J., Diot, C., Gass, R., and Scott, J. (2007). Impact of human mobility on opportunistic forwarding algorithms. IEEE Transactions on Mobile Computing, 6(6):606–620. Daly, E. M. and Haahr, M. (2007). Social network analysis for routing in disconnected delay-tolerant manets. In Proceedings of the 8th ACM International Symposium on Mobile Ad Hoc Networking and Computing, MobiHoc ’07, pages 32–40, New York, NY, USA. ACM. Eagle, N. and Pentland, A. (2006). Reality mining: sensing complex social systems. Personal and ubiquitous computing, 10(4):255–268. Ekman, F., Keränen, A., Karvo, J., and Ott, J. (2008). Working day movement model. In Proceedings of the 1st ACM SIGMOBILE workshop on Mobility models, pages 33–40. ACM. Fortunato, S. (2010). Community detection in graphs. Physics reports, 486(3):75–174. Gonzalez, M. C., Hidalgo, C. A., and Barabasi, A.-L. (2008). Understanding individual human mobility patterns. Nature, 453(7196):779–782. Gregory, S. (2010). Finding overlapping communities in networks by label propagation. New Journal of Physics, 12(10):103018. Henderson, T., Kotz, D., and Abyzov, I. (2008). The changing usage of a mature campus-wide wireless network. Computer Networks, 52(14):2690–2712. Hong, X., Gerla, M., Pei, G., and Chiang, C.-C. (1999). A group mobility model for ad hoc wireless networks. In Proceedings of the 2Nd ACM International Workshop on Modeling, Analysis and Simulation of Wireless and Mobile Systems, MSWiM ’99, pages 53–60, New York, NY, USA. ACM.
BIBLIOGRAPHY
83
Hossmann, T., Spyropoulos, T., and Legendre, F. (2010). Know thy neighbor: Towards optimal mapping of contacts to social graphs for dtn routing. In INFOCOM, 2010 Proceedings IEEE, pages 1–9. Hui, P. and Crowcroft, J. (2008). Human mobility models and opportunistic communications system design. Philosophical Transactions of the Royal Society of London A: Mathematical, Physical and Engineering Sciences, 366(1872):2005–2016. Hui, P., Crowcroft, J., and Yoneki, E. (2011). Bubble rap: Social-based forwarding in delay-tolerant networks. Mobile Computing, IEEE Transactions on, 10(11):1576– 1589. Hui, P., Yoneki, E., Chan, S. Y., and Crowcroft, J. (2007). Distributed community detection in delay tolerant networks. In Proceedings of 2nd ACM/IEEE international workshop on Mobility in the evolving internet architecture, page 7. ACM. Isaacman, S., Becker, R., Cáceres, R., Martonosi, M., Rowland, J., Varshavsky, A., and Willinger, W. (2012). Human mobility modeling at metropolitan scales. In Proceedings of the 10th International Conference on Mobile Systems, Applications, and Services, MobiSys ’12, pages 239–252, New York, NY, USA. ACM. Karamshuk, D., Boldrini, C., Conti, M., and Passarella, A. (2011). Human mobility models for opportunistic networks. Communications Magazine, IEEE, 49(12):157– 165. Keränen, A., Ott, J., and Kärkkäinen, T. (2009). The one simulator for dtn protocol evaluation. In Proceedings of the 2nd international conference on simulation tools and techniques, page 55. ICST (Institute for Computer Sciences, Social-Informatics and Telecommunications Engineering). Laya, A., Wang, K., Widaa, A. A., Alonso-Zarate, J., Markendahl, J., and Alonso, L. (2014). Device-to-device communications and small cells: enabling spectrum reuse for dense networks. Wireless Communications, IEEE, 21(4):98–105. Lee, K., Hong, S., Kim, S. J., Rhee, I., and Chong, S. (2009). Slaw: A new mobility model for human walks. In INFOCOM 2009, IEEE, pages 855–863. IEEE. Leguay, J., Lindgren, A., Scott, J., Friedman, T., and Crowcroft, J. (2006). Opportunistic content distribution in an urban setting. In Proceedings of the 2006 SIGCOMM workshop on Challenged networks, pages 205–212. ACM.
84
BIBLIOGRAPHY
Li, Y., Wu, T., Hui, P., Jin, D., and Chen, S. (2014). Social-aware d2d communications: qualitative insights and quantitative analysis. Communications Magazine, IEEE, 52(6):150–158. Lindgren, A., Doria, A., and Schelén, O. (2003). Probabilistic routing in intermittently connected networks. ACM SIGMOBILE mobile computing and communications review, 7(3):19–20. Lu, J. and Cao, L. (2003). Congestion evaluation from traffic flow information based on fuzzy logic. In Intelligent Transportation Systems, 2003. Proceedings. 2003 IEEE, volume 1, pages 50–53. IEEE. Mei, A. and Stefa, J. (2009). Swim: A simple model to generate small mobile worlds. In INFOCOM 2009, IEEE, pages 2106–2113. IEEE. Mota, V. F., Cunha, F. D., Macedo, D. F., Nogueira, J. M., and Loureiro, A. A. (2014). Protocols, mobility models and tools in opportunistic networks: A survey. Computer Communications, 48:5–19. Mtibaa, A., May, M., Diot, C., and Ammar, M. (2010). Peoplerank: Social opportunistic forwarding. In INFOCOM, 2010 Proceedings IEEE, pages 1–5. Musolesi, M. and Mascolo, C. (2006). A community based mobility model for ad hoc network research. In Proceedings of the 2nd international workshop on Multi-hop ad hoc networks: from theory to reality, pages 31–38. ACM. Musolesi, M. and Mascolo, C. (2007). Designing mobility models based on social network theory. ACM SIGMOBILE Mobile Computing and Communications Review, 11(3):59–70. Nguyen, N. P., Dinh, T. N., Tokala, S., and Thai, M. T. (2011a). Overlapping communities in dynamic networks: their detection and mobile applications. In Proceedings of the 17th annual international conference on Mobile computing and networking, pages 85–96. ACM. Nguyen, N. P., Dinh, T. N., Tokala, S., and Thai, M. T. (2011b). Overlapping communities in dynamic networks: their detection and mobile applications. In Proceedings of the 17th annual international conference on Mobile computing and networking, pages 85–96. ACM.
BIBLIOGRAPHY
85
Nunes, I., Celes, C., Nunes, I., Vaz de Melo, P., and A.F. Loureiro, A. (2016a). Combining spatial and social awareness in d2d routing. Under review: IEEE Communications Magazine. Nunes, I. O., de Melo, P. O. V., and Loureiro, A. A. (2016b). Groups-net: Roteamento ciente de encontros de grupos em redes móveis d2d. In 34th Brazilian Symposium on Computer Networks and Distributed Systems. Nunes, I. O., Vaz de Melo, P., and A.F. Loureiro, A. (2016c). Group mobility: Detection, tracking and characterization. In IEEE ICC 2016 International Conference on Communications (ICC’16 SAC-8 SN), Kuala Lumpur, Malaysia. Nunes, I. O., Vaz de Melo, P., and A.F. Loureiro, A. (2016d). Leveraging d2d multi-hop communication through social group meetings awareness. Accepted for publication: Wireless Communications Magazine, IEEE. Palla, G., Barabási, A.-L., and Vicsek, T. (2007). Quantifying social group evolution. Nature, 446(7136):664–667. Palla, G., Derényi, I., Farkas, I., and Vicsek, T. (2005). Uncovering the overlapping community structure of complex networks in nature and society. Nature, 435(7043):814–818. Panisson, A., Barrat, A., Cattuto, C., den Broeck, W. V., Ruffo, G., and Schifanella, R. (2012). On the dynamics of human proximity for data diffusion in ad-hoc networks. Ad Hoc Networks, 10(8):1532 – 1543. Special Issue on Social-Based Routing in Mobile and Delay-Tolerant Networks. Pappalardo, L., Simini, F., Rinzivillo, S., Pedreschi, D., Giannotti, F., and Barabási, A.-L. (2015a). Returners and explorers dichotomy in human mobility. Nature communications, 6. Pappalardo, L., Simini, F., Rinzivillo, S., Pedreschi, D., Giannotti, F., and Barabási, A.-L. (2015b). Returners and explorers dichotomy in human mobility. Nature communications, 6. Peel, L. (2010). Estimating network parameters for selecting community detection algorithms. In Information Fusion (FUSION), 2010 13th Conference on, pages 1–8. IEEE.
86
BIBLIOGRAPHY
Rao, W., Zhao, K., Zhang, Y., Hui, P., and Tarkoma, S. (2015). Towards maximizing timely content delivery in delay tolerant networks. Mobile Computing, IEEE Transactions on, 14(4):755–769. Rhee, I., Shin, M., Hong, S., Lee, K., Kim, S. J., and Chong, S. (2011). On the levywalk nature of human mobility. IEEE/ACM transactions on networking (TON), 19(3):630–643. Sermpezis, P. and Spyropoulos, T. (2015). Modelling and analysis of communication traffic heterogeneity in opportunistic networks. Mobile Computing, IEEE Transactions on, 14(11):2316–2331. Shahbazi, S., Karunasekera, S., and Harwood, A. (2012). Improving performance in delay/disruption tolerant networks through passive relay points. Wireless Networks, 18(1):9–31. Silva, F. A., Celes, C., Boukerche, A., Ruiz, L. B., and Loureiro, A. A. (2015). Filling the gaps of vehicular mobility traces. In Proceedings of the 18th ACM International Conference on Modeling, Analysis and Simulation of Wireless and Mobile Systems, pages 47–54. ACM. Silva, T. H., Vaz de Melo, P. O., Almeida, J. M., Salles, J., and Loureiro, A. A. (2014). Revealing the city that we cannot see. ACM Transactions on Internet Technology (TOIT), 14(4):26. Silveira, L. M., de Almeida, J. M., Marques-Neto, H. T., Sarraute, C., and Ziviani, A. (2016). Mobhet: Predicting human mobility using heterogeneous data sources. Computer Communications. Song, C., Koren, T., Wang, P., and Barabási, A.-L. (2010). Modelling the scaling properties of human mobility. Nature Physics, 6(10):818–823. Spyropoulos, T., Psounis, K., and Raghavendra, C. S. (2005). Spray and wait: an efficient routing scheme for intermittently connected mobile networks. In Proceedings of the 2005 ACM SIGCOMM workshop on Delay-tolerant networking, pages 252–259. ACM. Terroso-Sáenz, F., Valdés-Vela, M., Sotomayor-Martínez, C., Toledo-Moreo, R., and Gómez-Skarmeta, A. F. (2012). A cooperative approach to traffic congestion detection with complex event processing and vanet. Intelligent Transportation Systems, IEEE Transactions on, 13(2):914–929.
BIBLIOGRAPHY
87
Treurniet, J. (2014). A taxonomy and survey of microscopic mobility models from the mobile networking domain. ACM Computing Surveys (CSUR), 47(1):14. Tsai, T.-C. and Chan, H.-H. (2015). Nccu trace: social-network-aware mobility trace. Communications Magazine, IEEE, 53(10):144–149. Vaz de Melo, P. O., Viana, A. C., Fiore, M., Jaffrès-Runser, K., Le Mouël, F., and Loureiro, A. A. (2013). Recast: Telling apart social and random relationships in dynamic networks. In Proceedings of the 16th ACM international conference on Modeling, analysis & simulation of wireless and mobile systems, pages 327–334. ACM. Wang, K. H. and Li, B. (2002). Group mobility and partition prediction in wireless adhoc networks. In Communications, 2002. ICC 2002. IEEE International Conference on, volume 2, pages 1017–1021 vol.2. Watts, D. J. (1999). Networks, dynamics, and the small-world phenomenon 1. American Journal of sociology, 105(2):493–527. Xu, H., Hu, Y., Wang, Z., Ma, J., and Xiao, W. (2013). Core-based dynamic community detection in mobile social networks. Entropy, 15(12):5419–5438. Zhu, Y., Xu, B., Shi, X., and Wang, Y. (2013). A survey of social-based routing in delay tolerant networks: positive and negative social effects. IEEE Communications Surveys & Tutorials, 15(1):387–401.